


Deze pagina biedt een uitgebreid overzicht van de functies van Chrome DevTools met betrekking tot het analyseren van prestaties.
Zie Runtimeprestaties analyseren voor een begeleide zelfstudie over het analyseren van de prestaties van een pagina met Chrome DevTools.
Live metrische gegevensscherm
Wanneer u het Prestatiepaneel voor het eerst opent, wordt het scherm Live Metrics weergegeven. Hier krijgt u direct een overzicht van de prestaties van de huidige pagina, aan de hand van de drie Core Web Vitals .
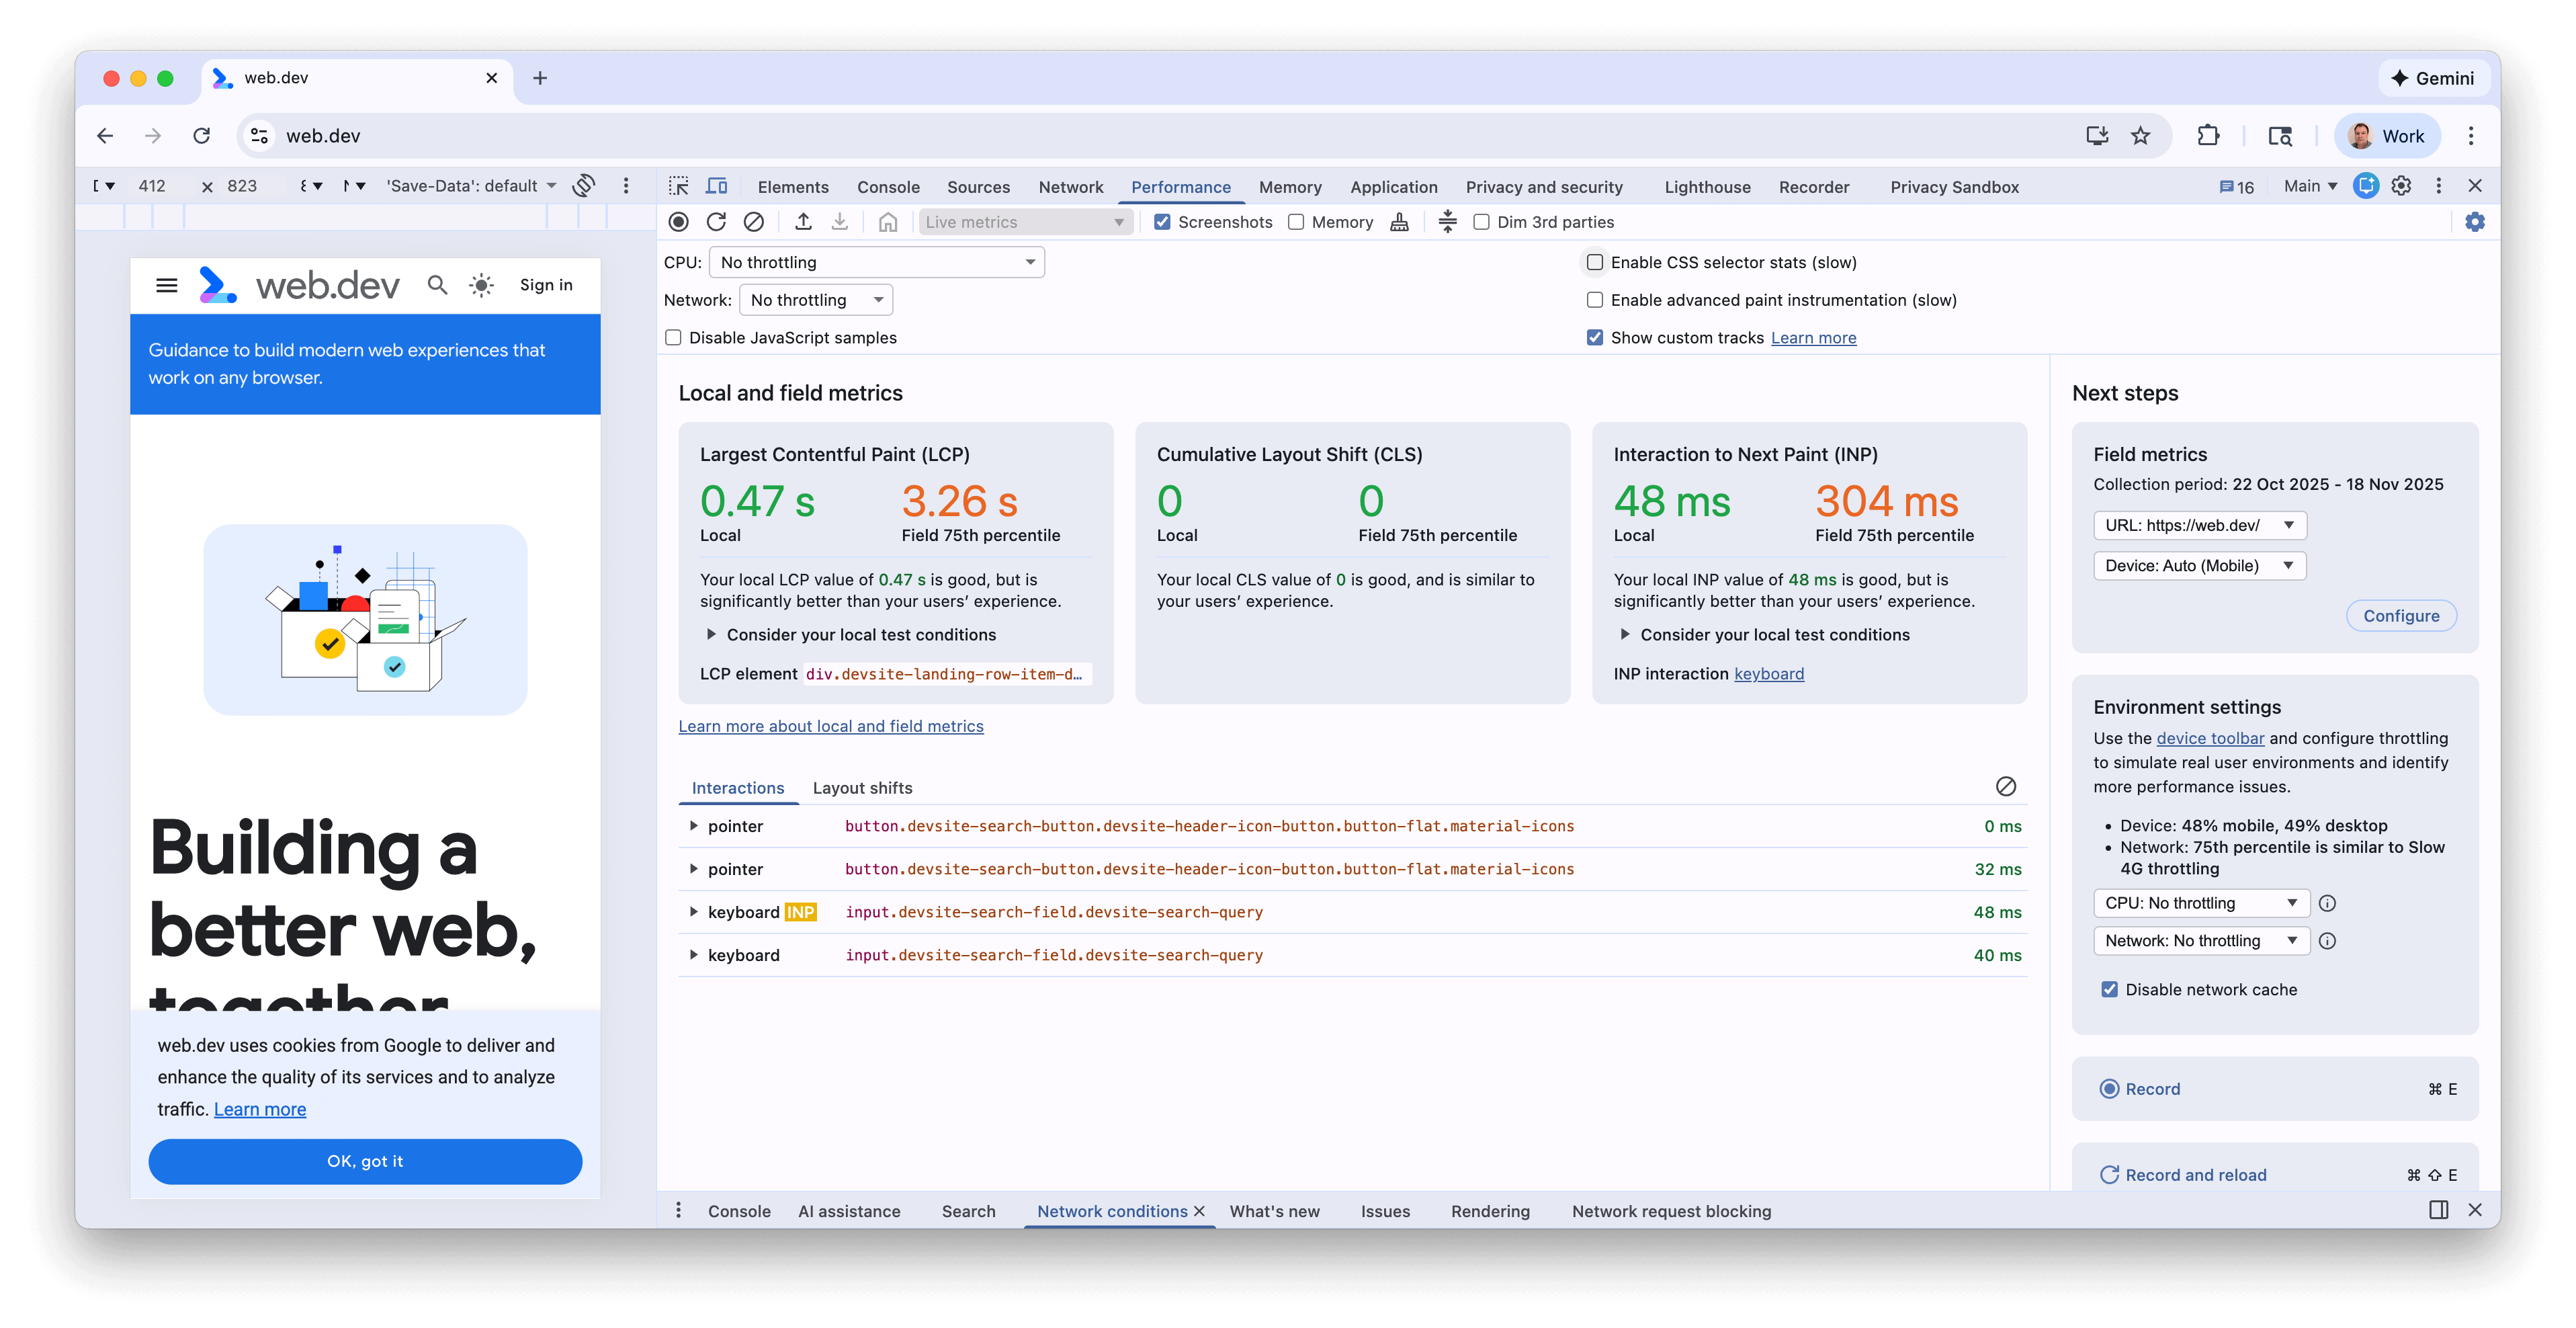
De statistieken worden bijgewerkt terwijl u met de pagina communiceert en naar nieuwe pagina's navigeert. Dit is een goede manier om prestatieproblemen te identificeren, met name voor INP en CLS als deze zich alleen onder bepaalde omstandigheden voordoen. Zodra een prestatieprobleem zich consistent herhaalt, kunt u een trace vastleggen om meer details te krijgen en het onderliggende probleem te debuggen.
Functies van het live-metrische scherm
Naast de statistieken bevat het scherm Live-statistieken de volgende functies:
- Veldmetrieken van CrUX wanneer ingeschakeld in het paneel Veldmetrieken .
- Een samenvatting van eventuele opvallende verschillen tussen de lokale en veldmetrieken.
- Het LCP-element, waar u met de muis overheen kunt bewegen om dit op de pagina te markeren.
- Details van het CLS-cluster en INP-type
- Meer details over het zweven over de metriek (bijvoorbeeld LCP- en INP-subonderdelen en veldhistogrammen)
- Met Interacties en Lay-out worden panelen gewijzigd waarin de geschiedenis van interacties en lay-outwijzigingen wordt vastgelegd.
- Een paneel met veldmetrieken waar u de CrUX-gegevens kunt inschakelen, details over de periode van die gegevens kunt bekijken en kunt schakelen tussen bron- en URL-gegevens (indien beschikbaar) en tussen desktop- en mobiele gegevens.
- Een paneel met omgevingsinstellingen met richtlijnen over welke apparaat-, CPU- en netwerkbeperking u moet gebruiken, op basis van CrUX-gegevens.
Zie voor meer informatie het blogbericht Monitor your local and real-user Core Web Vitals performance in DevTools .
Recordprestaties
U kunt de looptijd opnemen of de laadprestaties uitvoeren met behulp van de knoppen linksboven of de knop rechts op het scherm:

Record runtime-prestaties
Registreer runtimeprestaties als u de prestaties van een pagina wilt analyseren terwijl deze wordt uitgevoerd, in plaats van tijdens het laden.
- Ga naar de pagina die u wilt analyseren.
- Klik op het tabblad Prestaties in DevTools.
- Klik op Opnemen
 .
. - Interactie met de pagina. DevTools registreert alle pagina-activiteit die plaatsvindt als gevolg van uw interacties.
- Klik nogmaals op Opnemen of klik op Stoppen om de opname te stoppen.
Recordbelastingprestaties
Registreer de laadprestaties als u de prestaties van een pagina wilt analyseren terwijl deze wordt geladen, in plaats van terwijl deze wordt uitgevoerd.
- Ga naar de pagina die u wilt analyseren.
- Open het Prestatiepaneel van DevTools.
- Klik op Opnemen en opnieuw laden
 DevTools navigeert eerst naar
 about:blankom alle resterende screenshots en traces te wissen. Vervolgens registreert DevTools prestatiegegevens terwijl de pagina opnieuw laadt en stopt de opname automatisch een paar seconden nadat het laden is voltooid.
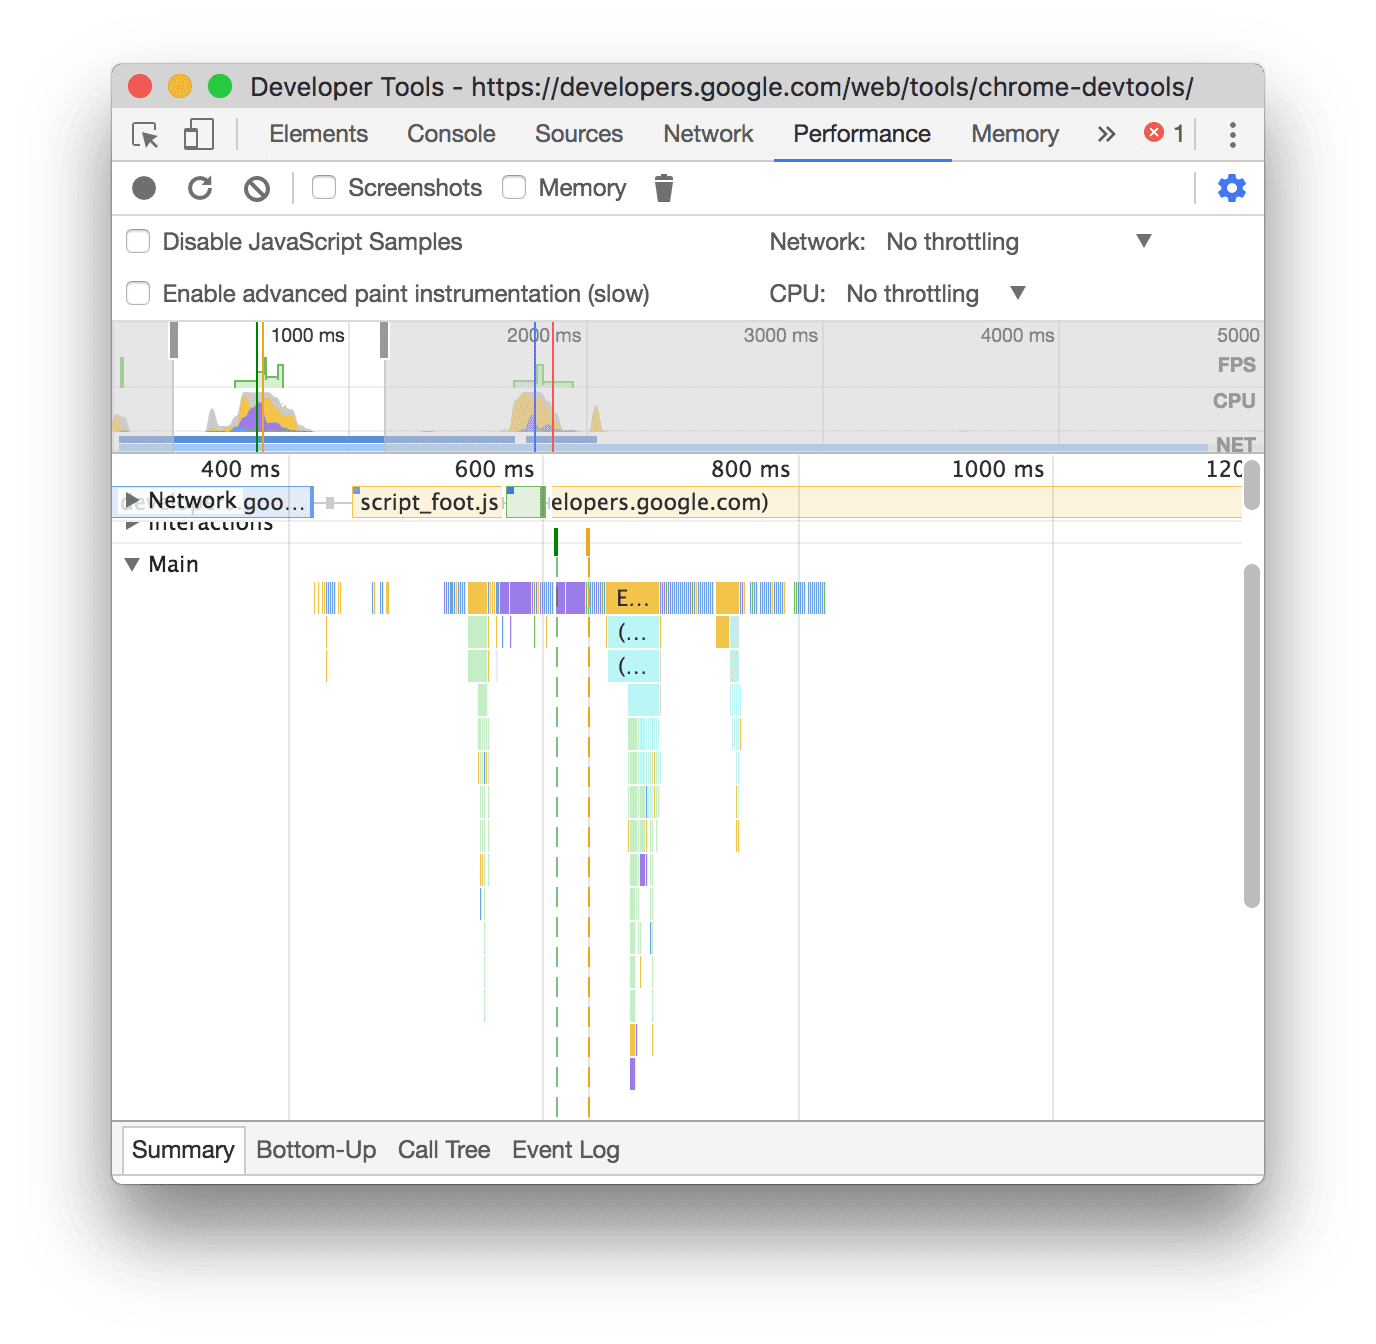
DevTools zoomt automatisch in op het gedeelte van de opname waar de meeste activiteit plaatsvond.
In dit voorbeeld toont het paneel Prestaties de activiteit tijdens het laden van een pagina.
Maak screenshots tijdens het opnemen
Schakel het selectievakje Schermafbeeldingen in om tijdens de opname van elk frame een schermafbeelding te maken.

Zie Een schermafbeelding bekijken voor meer informatie over hoe u met schermafbeeldingen kunt werken.
Garbage collection forceren tijdens het opnemen
Terwijl u een pagina opneemt, klikt u op Garbage- verzamelen om garbage collection af te dwingen.

Opname-instellingen weergeven
Klik op Vastleginstellingen ![]() om meer instellingen bloot te leggen die betrekking hebben op de manier waarop DevTools prestatie-opnamen maakt.
om meer instellingen bloot te leggen die betrekking hebben op de manier waarop DevTools prestatie-opnamen maakt.

JavaScript-voorbeelden uitschakelen
Standaard worden op het hoofdspoor van een opname gedetailleerde call stacks weergegeven van JavaScript-functies die tijdens de opname zijn aangeroepen. Om deze call stacks uit te schakelen:
- Open de Capture-instellingen
 menu. Zie Opname-instellingen weergeven .
 - Schakel het selectievakje JavaScript-voorbeelden uitschakelen in.
- Maak een opname van de pagina.
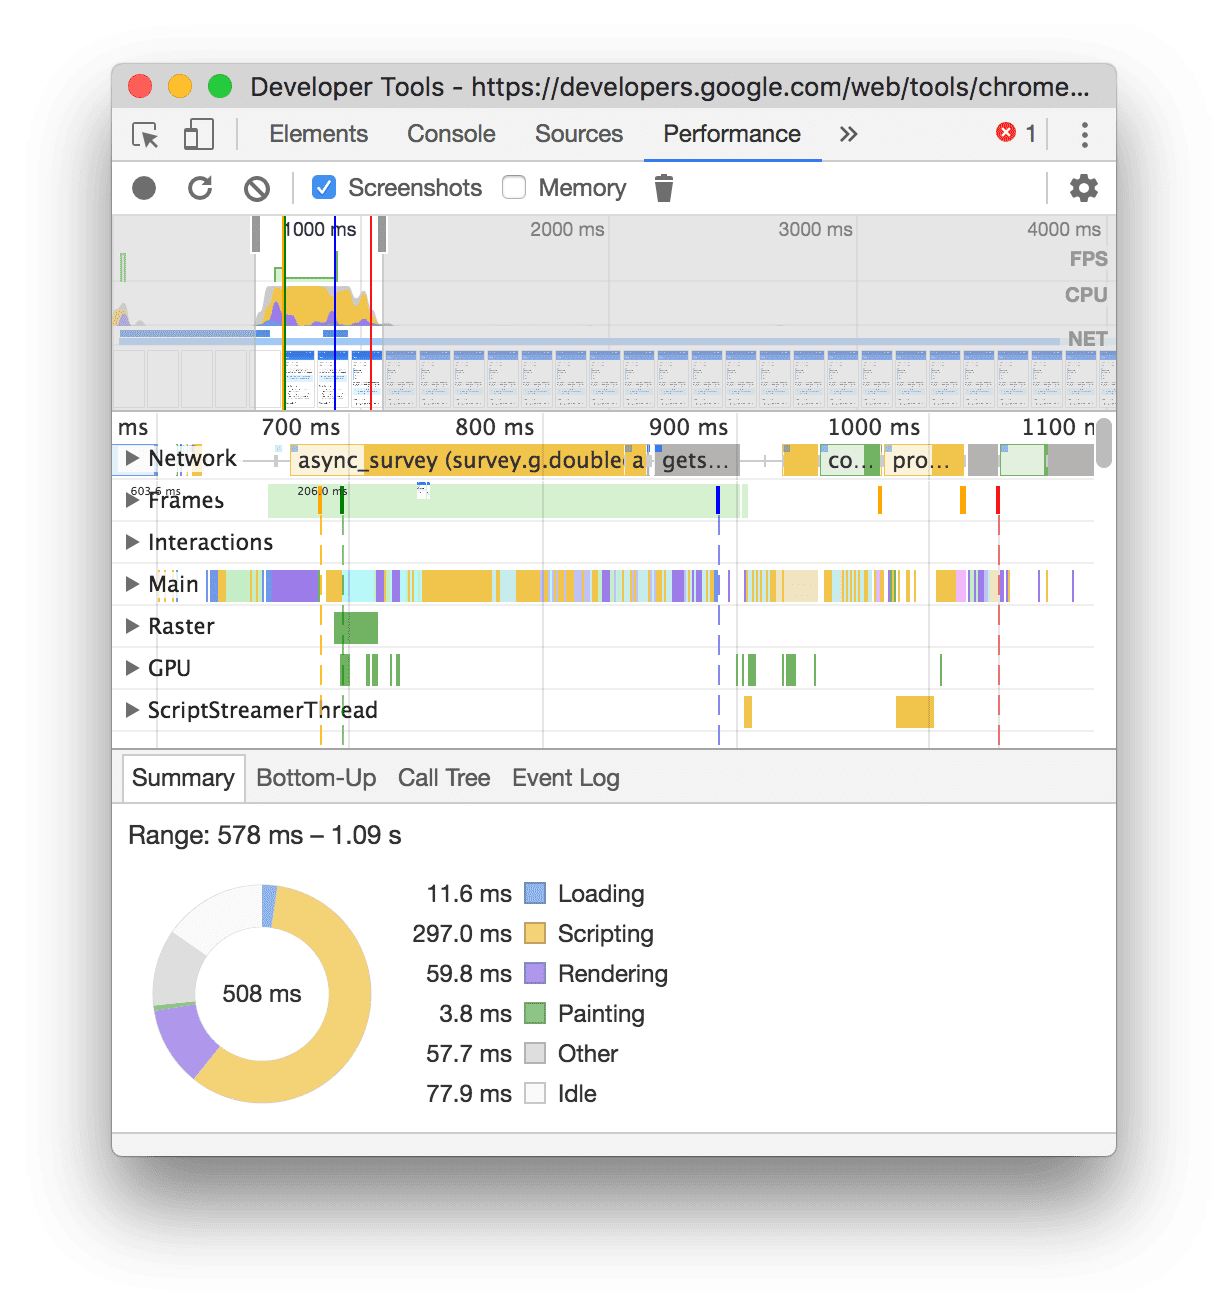
De volgende schermafbeeldingen laten het verschil zien tussen het in- en uitschakelen van JavaScript-samples. De hoofdtrack van de opname is veel korter wanneer sampling is uitgeschakeld, omdat alle JavaScript-aanroepstacks worden weggelaten.
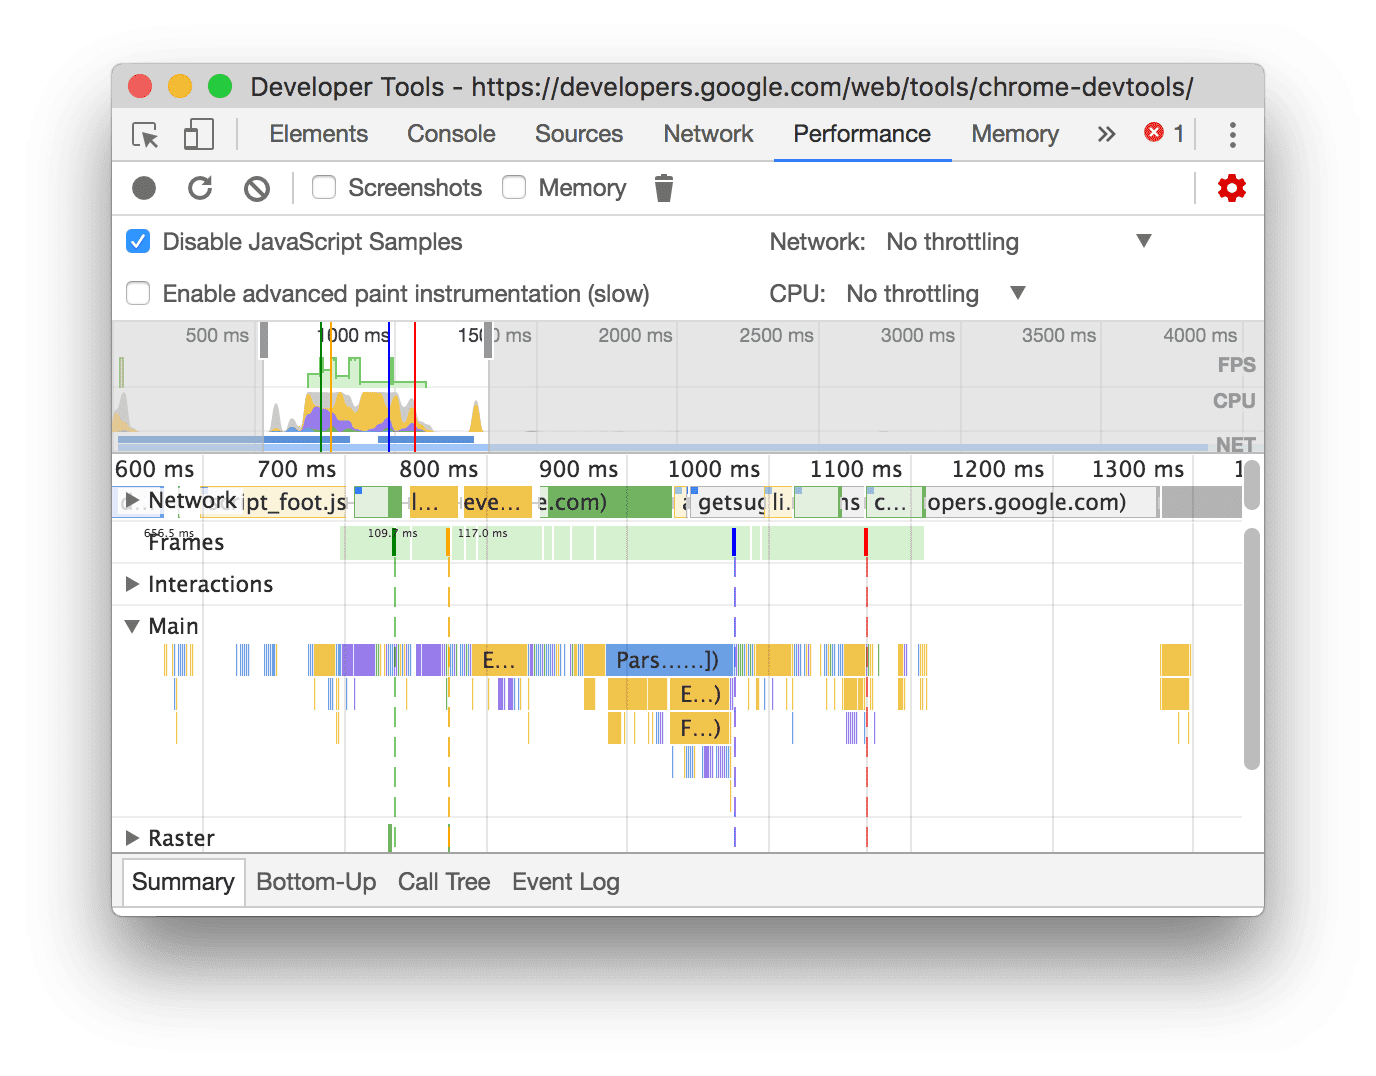
Dit voorbeeld toont een opname met uitgeschakelde JS-samples.
Dit voorbeeld toont een opname met ingeschakelde JS-samples.
Beperk het netwerk tijdens het opnemen
Om het netwerk te beperken tijdens het opnemen:
- Open de Capture-instellingen
 menu. Zie Opname-instellingen weergeven .
 - Stel het netwerk in op het gekozen bandbreedtebeperkingsniveau.
In het vervolgkeuzemenu kan het paneel Prestaties ook een standaardvoorinstelling voor snelheidsbeperking aanbevelen of een voorinstelling die de ervaring van uw gebruikers benadert op basis van veldgegevens .
Beperk de CPU tijdens het opnemen
Om de CPU te beperken tijdens het opnemen:
- Open de Capture-instellingen
 menu. Zie Opname-instellingen weergeven .
 - Stel de CPU in op het gekozen CPU-beperkingsniveau.
Throttling is relatief ten opzichte van de mogelijkheden van uw computer. De optie 2x vertragen zorgt er bijvoorbeeld voor dat uw CPU twee keer langzamer werkt dan normaal. DevTools kunnen de CPU's van mobiele apparaten niet echt simuleren, omdat de architectuur van mobiele apparaten sterk verschilt van die van desktops en laptops.
In het vervolgkeuzemenu kan het paneel Prestaties ook een standaardvoorinstelling voor snelheidsbeperking aanbevelen of een voorinstelling die de ervaring van uw gebruikers benadert op basis van veldgegevens .
CSS-selectorstatistieken inschakelen
Om de statistieken van uw CSS-regelselectors te bekijken tijdens langdurige Recalculate Style- gebeurtenissen:
- Open de Capture-instellingen
 menu. Zie Opname-instellingen weergeven .
 - Vink het selectievakje CSS-selectorstatistieken inschakelen aan.
Zie voor meer informatie Hoe u de prestaties van de CSS-selector kunt analyseren tijdens gebeurtenissen waarbij de stijl opnieuw wordt berekend .
Geavanceerde verfinstrumentatie inschakelen
Voor gedetailleerde verfinstrumentatie:
- Open de Capture-instellingen menu. Zie Opname-instellingen weergeven .
- Schakel het selectievakje Geavanceerde tekeninstrumentatie inschakelen in.
Zie Lagen weergeven en Verfprofiel weergeven voor meer informatie over hoe u met de verfgegevens kunt werken.
Aangepaste tracks weergeven
Maakt aangepaste tracks mogelijk die verder kunnen worden aangepast met behulp van de DevTools Extensibility API .
Wis de vorige opname
Nadat u een opname hebt gemaakt, drukt u op Opname wissen ![]() om de opname uit het paneel Prestaties te wissen.
om de opname uit het paneel Prestaties te wissen.

Een prestatie-opname analyseren
Nadat u de runtime-prestaties of laadprestaties hebt vastgelegd, biedt het paneel Prestaties veel gegevens waarmee u de prestaties van wat er zojuist is gebeurd, kunt analyseren.
Een opname annoteren en delen
Bekijk Annotate en deel uw prestatiebevindingen .
Krijg bruikbare inzichten
Het paneel Prestaties bevat prestatie-inzichten die ook in Lighthouse -rapporten voorkomen. Deze inzichten kunnen suggesties bieden voor prestatieverbetering en bieden een gerichte analyse van de volgende prestatieproblemen, zoals LCP- en INP-subonderdelen, problemen met LCP-aanvraagdetectie, externe partijen en verouderde en gedupliceerde JavaScript-resources. Raadpleeg de documentatie over Prestatie-inzichten voor een volledige lijst.
De inzichten worden goedgekeurd wanneer er geen problemen worden gedetecteerd. Het tabblad 'Inzichten' vermeldt ze onder de samengevouwen sectie ' Geslaagde inzichten' onderaan. De inzichten die niet zijn goedgekeurd, worden in hun eigen secties weergegeven.
Om gebruik te maken van inzichten:
- Maak een opname van uw optreden .
- Open het tabblad 'Inzichten ' in de linkerzijbalk van het paneel 'Prestaties ', vouw verschillende secties uit en beweeg de muis over de items om erop te klikken. Het paneel 'Prestaties ' markeert de bijbehorende gebeurtenissen in de trace.
Navigeer door de opname
Om u te helpen navigeren, doet het Prestatiepaneel het volgende wanneer u de muisaanwijzer over de prestatietracering beweegt:
- Wanneer u met de muis over het Tijdlijnoverzicht beweegt, wordt er een verticale markering weergegeven die de volledige prestatietracering beslaat.
- Markeert een bereik in het Tijdlijnoverzicht wanneer u de muisaanwijzer over items in het hoofdspoor beweegt.
Om uw uitvoeringsopname nauwkeurig te bekijken, kunt u een gedeelte van een opname selecteren, door een lange vlamgrafiek scrollen, in- en uitzoomen en broodkruimels gebruiken om tussen zoomniveaus te springen.
Gebruik sneltoetsen om te navigeren
Als u sneltoetsen wilt gebruiken om snel door de opname te navigeren, kiest u eerst de gewenste toetsenbordnavigatiestijl.
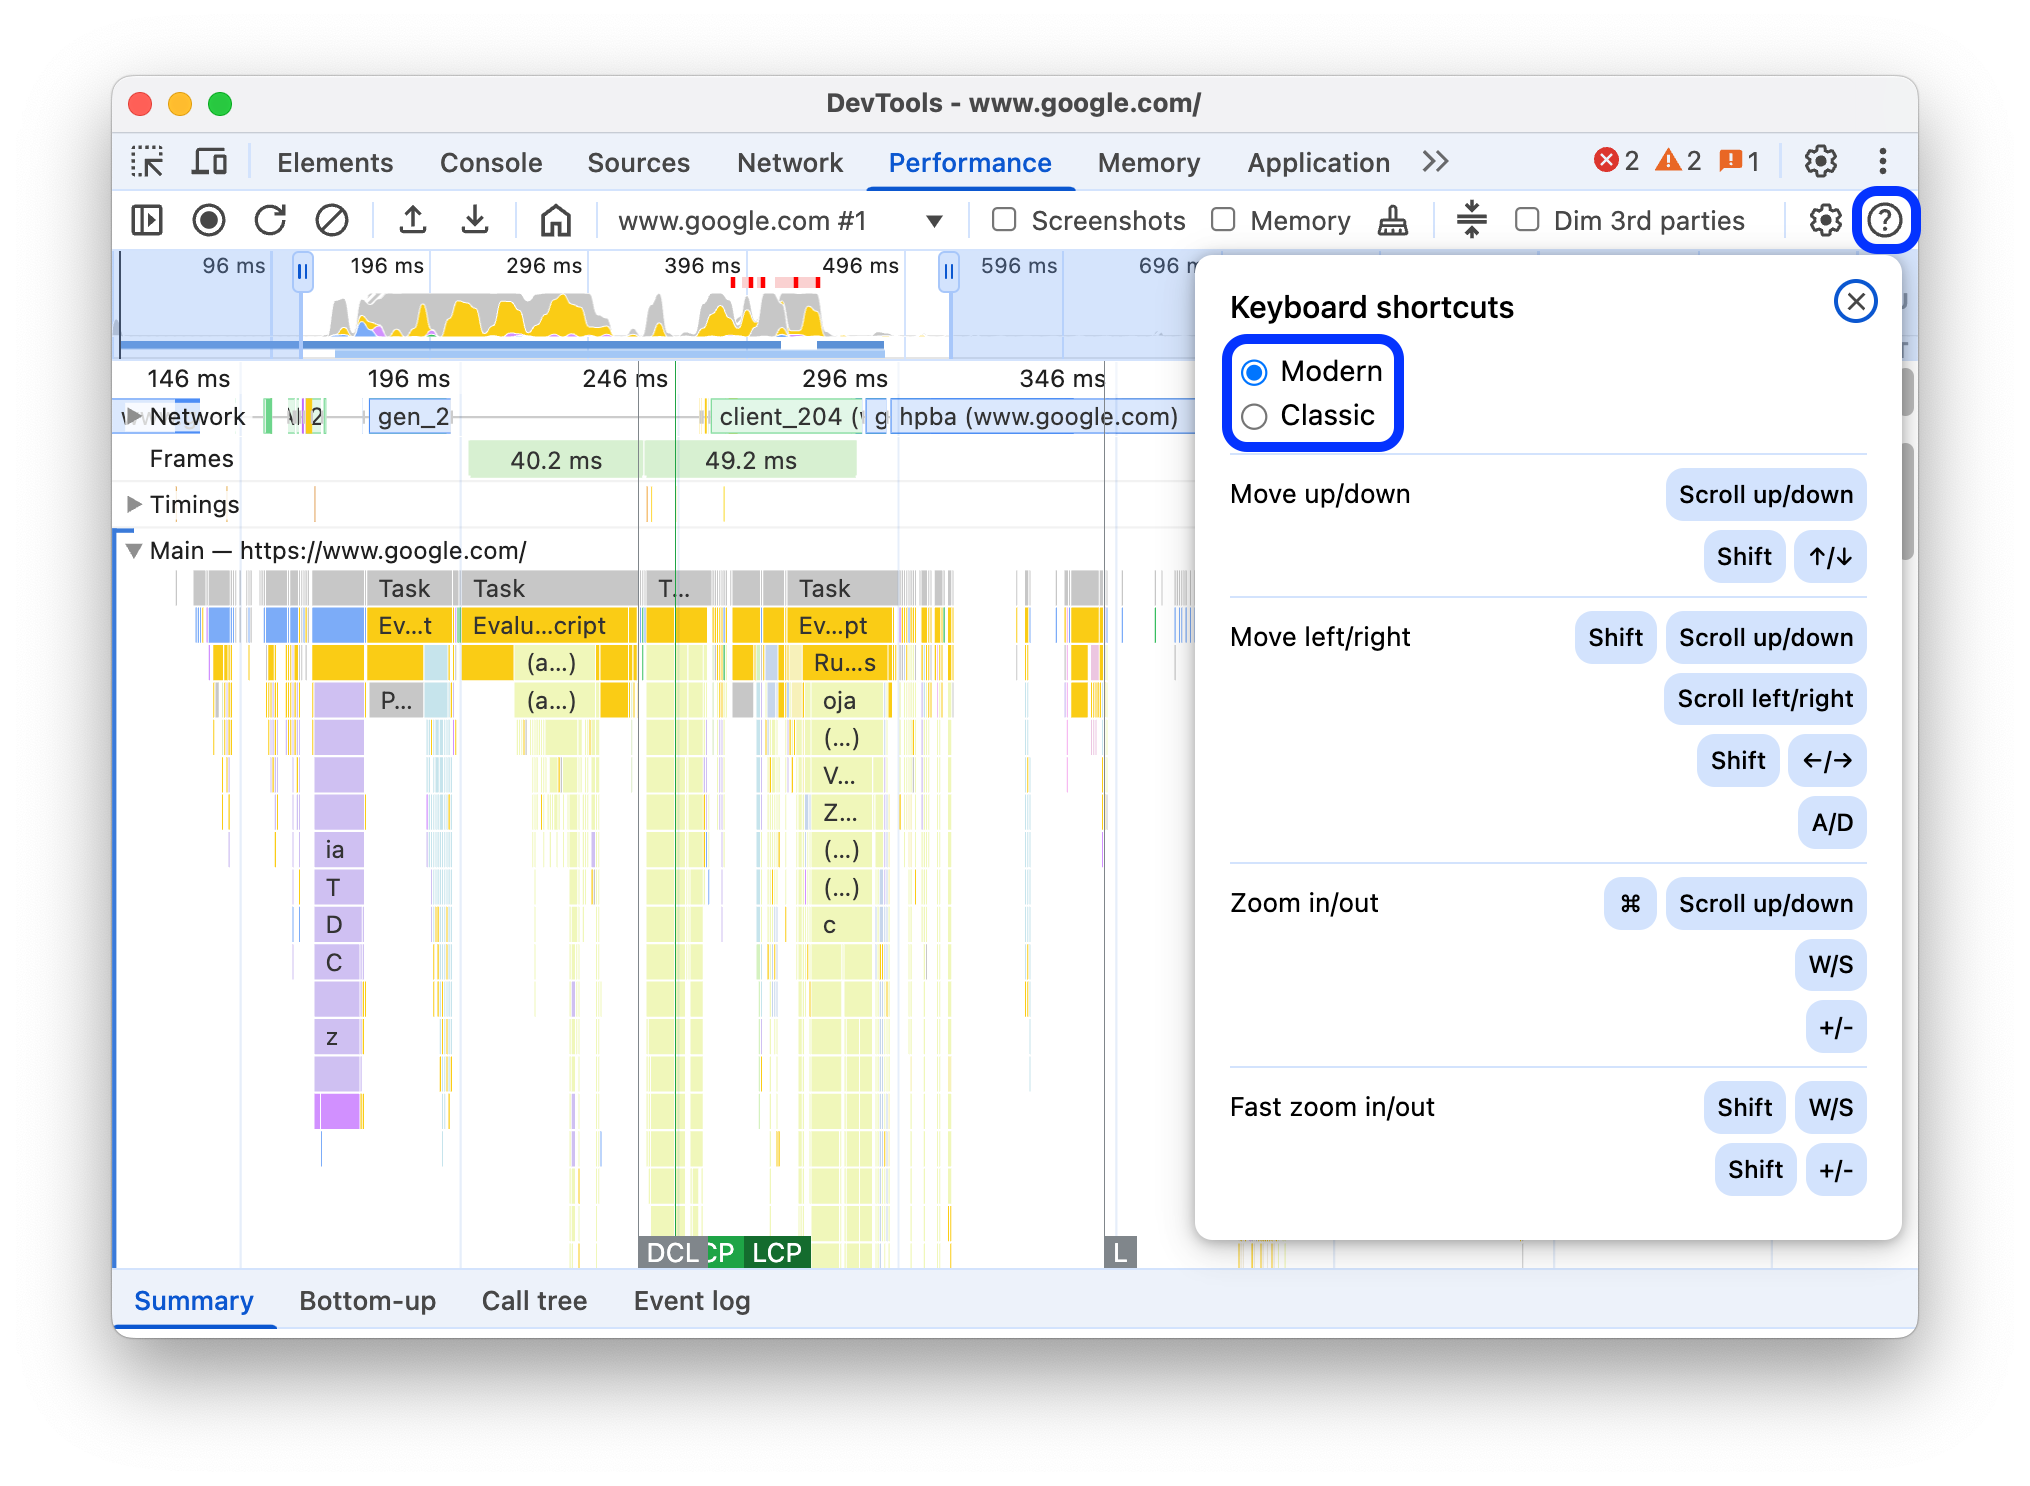
Klik in de rechterbovenhoek van het paneel op , Snelkoppelingen weergeven en selecteer een van de volgende opties:
- Klassiek : Zoomen met het muiswieltje (touchpad omhoog of omlaag) en verticaal scrollen met Shift + muiswieltje.
- Modern : Verticaal scrollen met het muiswiel, horizontaal scrollen met Shift + muiswiel en zoomen met Command/Control + muiswiel.
In het dialoogvenster Sneltoetsen vindt u ook een overzicht van de beschikbare sneltoetsen.
Selecteer een gedeelte van de opname
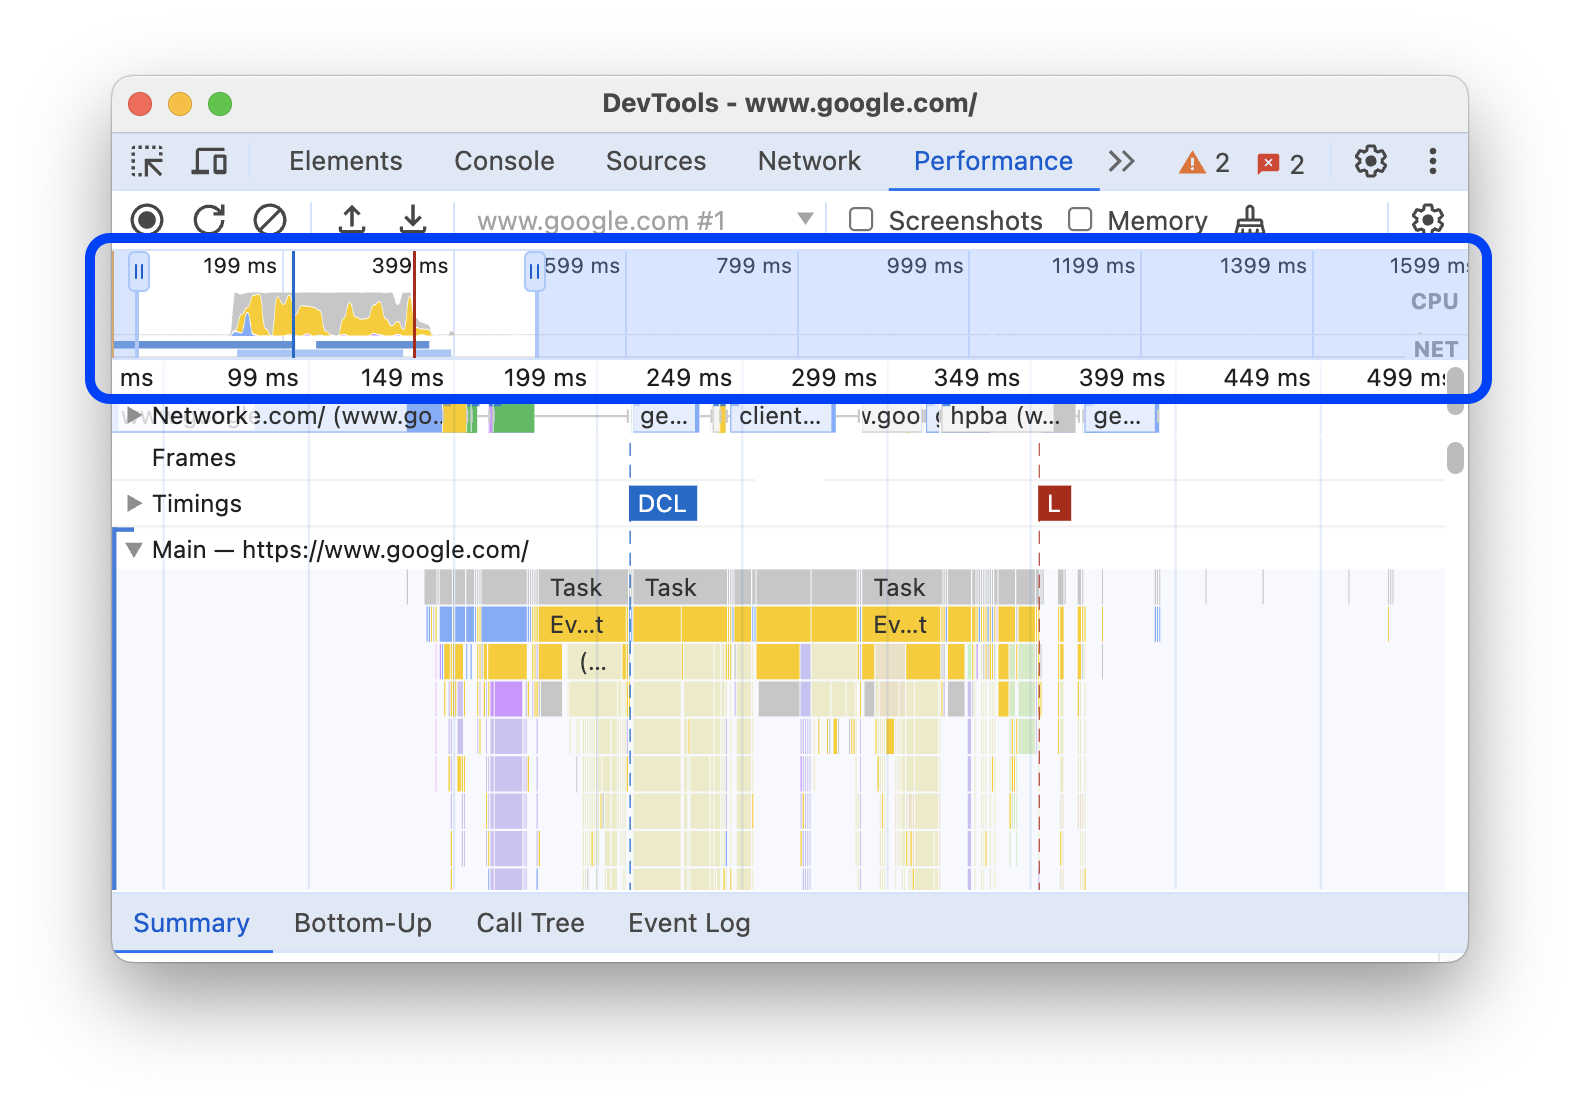
Onder de actiebalk van het paneel Prestaties en boven aan de opname ziet u het overzicht van de Tijdlijn met de CPU- en NET -grafieken.
Om een gedeelte van een opname te selecteren, klikt u op het Tijdlijnoverzicht , houdt u de muisknop ingedrukt en sleept u vervolgens naar links of rechts.
Om een gedeelte te selecteren met behulp van het toetsenbord:
- Focus op het hoofdspoor of een van de aangrenzende sporen.
- Gebruik de toetsen W , A , S en D om respectievelijk in te zoomen, naar links te bewegen, uit te zoomen en naar rechts te bewegen.
Om een gedeelte te selecteren met behulp van het trackpad:
- Beweeg de muis over het tijdlijnoverzicht of over een van de tracks ( Hoofdtrack en de tracks ernaast).
- Veeg met twee vingers omhoog om uit te zoomen, veeg naar links om naar links te gaan, veeg omlaag om in te zoomen en veeg naar rechts om naar rechts te gaan.
Maak broodkruimels en spring tussen zoomniveaus
Met het Tijdlijnoverzicht kunt u meerdere geneste broodkruimels achter elkaar maken, de zoomniveaus verhogen en vervolgens vrij tussen de zoomniveaus springen.
Om broodkruimels te maken en te gebruiken:
- Selecteer in het Tijdlijnoverzicht een gedeelte van de opname .
- Beweeg de muis over de selectie en klik op de inknop van N ms . De selectie wordt uitgebreid en vult het tijdlijnoverzicht . Bovenaan het tijdlijnoverzicht begint een reeks broodkruimels te ontstaan.
- Herhaal de vorige twee stappen om nog een geneste breadcrumb te maken. U kunt breadcrumbs blijven nesten zolang het selectiebereik groter is dan 5 milliseconden.
- Om naar een gekozen zoomniveau te springen, klikt u op het overeenkomstige broodkruimelpad in de keten bovenaan het Tijdlijnoverzicht .
Om de onderliggende breadcrumbs te verwijderen, klikt u met de rechtermuisknop op de bovenliggende breadcrumb en selecteert u Onderliggende breadcrumbs verwijderen .
Blader door een lange vlamgrafiek
Om door een lange vlamgrafiek in het hoofdspoor of een van de aangrenzende sporen te scrollen, klikt u en houdt u de muisknop ingedrukt. Vervolgens sleept u in de gewenste richting totdat hetgeen u zoekt in beeld komt.
Negeer irrelevante scripts in de vlamgrafiek
Om u beter op uw code te kunnen concentreren, kunt u irrelevante scripts toevoegen aan de negeerlijst.
Om scripts te negeren, voert u een van de volgende handelingen uit:
- Klik op Instellingen voor negeerlijst weergeven' in de bovenste actiebalk en typ een reguliere expressie in het invoerveld. De vlamgrafiek past de nieuwe regel toe terwijl u typt.
- Klik met de rechtermuisknop op een script en selecteer Script toevoegen aan negeerlijst . Het paneel Prestaties voegt dit script toe aan de lijst in het dialoogvenster 'Instellingen negeerlijst weergeven'
Het paneel zal automatisch overmatige nesting van dergelijke scripts inklappen en ze markeren als On ignore list ( REGULAR_EXPRESSION ) .
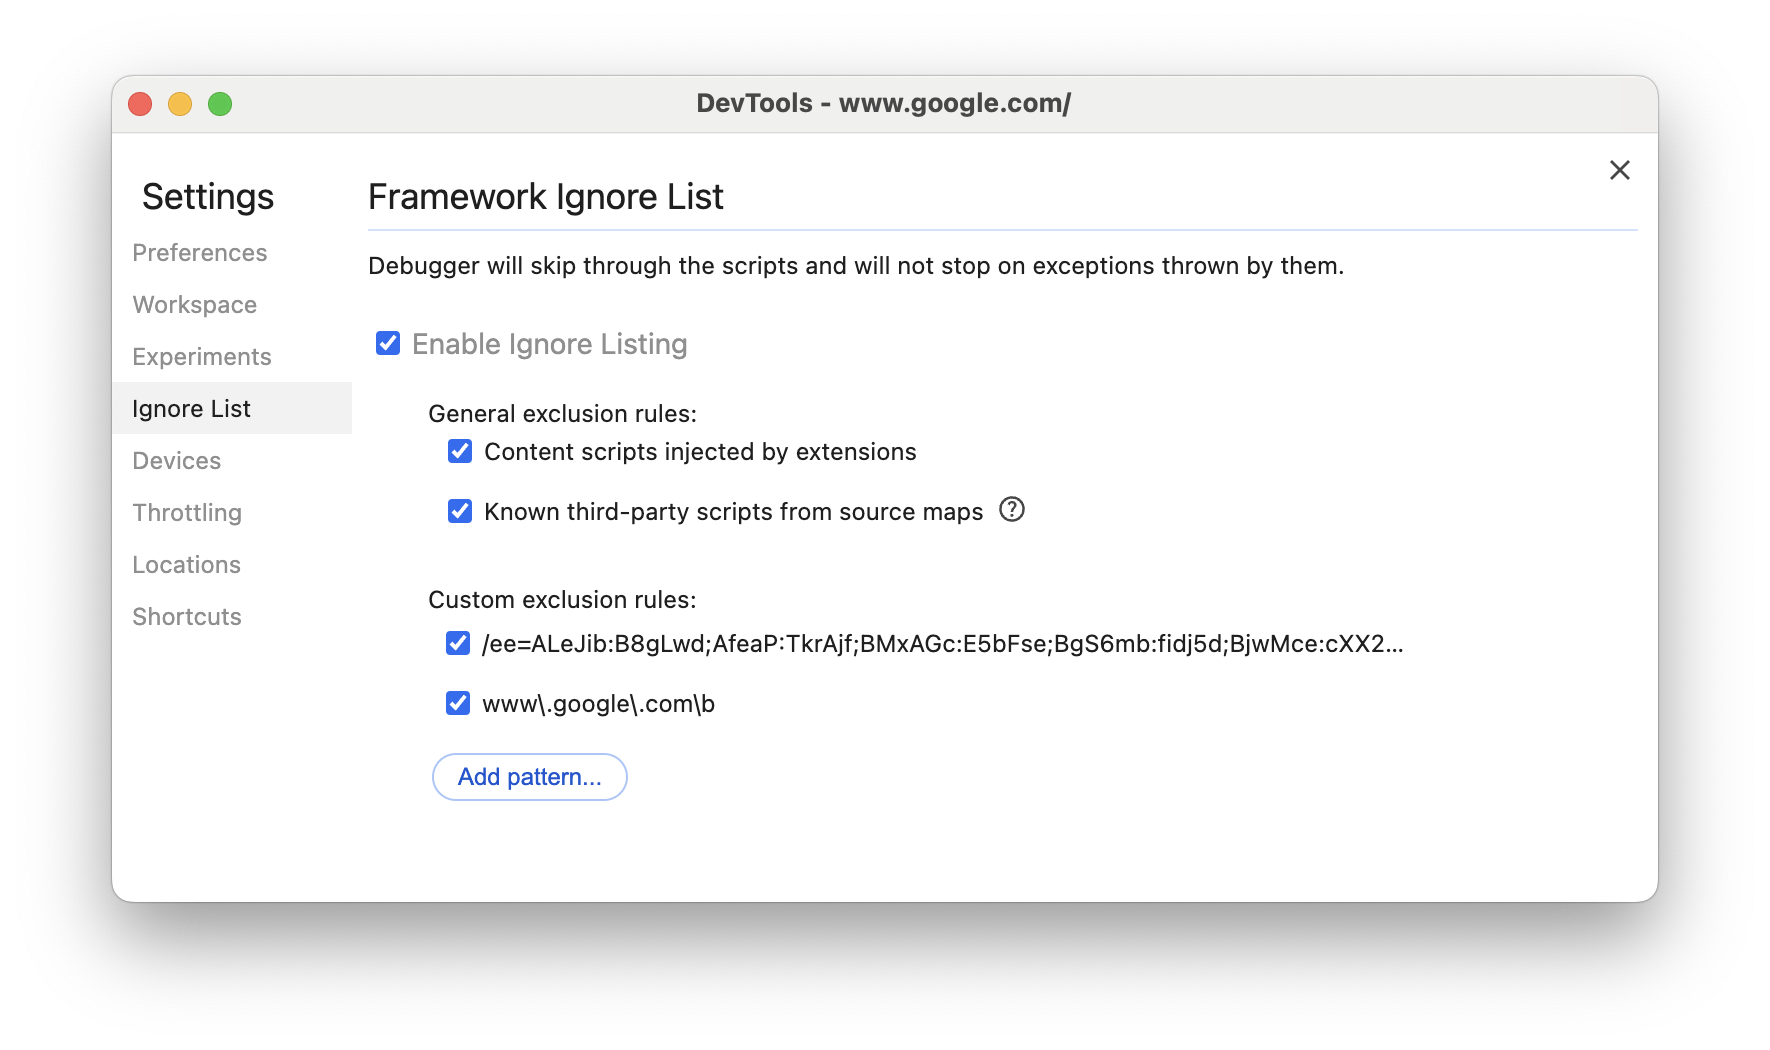
In het dialoogvenster Instellingen negeerlijst weergeven u de regels voor de negeerlijst in- en uitschakelen.
Om een script uit de negeerlijst te verwijderen, klikt u er met de rechtermuisknop op in het vlamdiagram en selecteert u Script verwijderen uit negeerlijst. U kunt ook met eroverheen bewegen in het dialoogvenster Instellingen negeerlijst weergeven en op klikken.
DevTools slaat de regels voor de negeerlijst op die u toevoegt in > Negeerlijst .
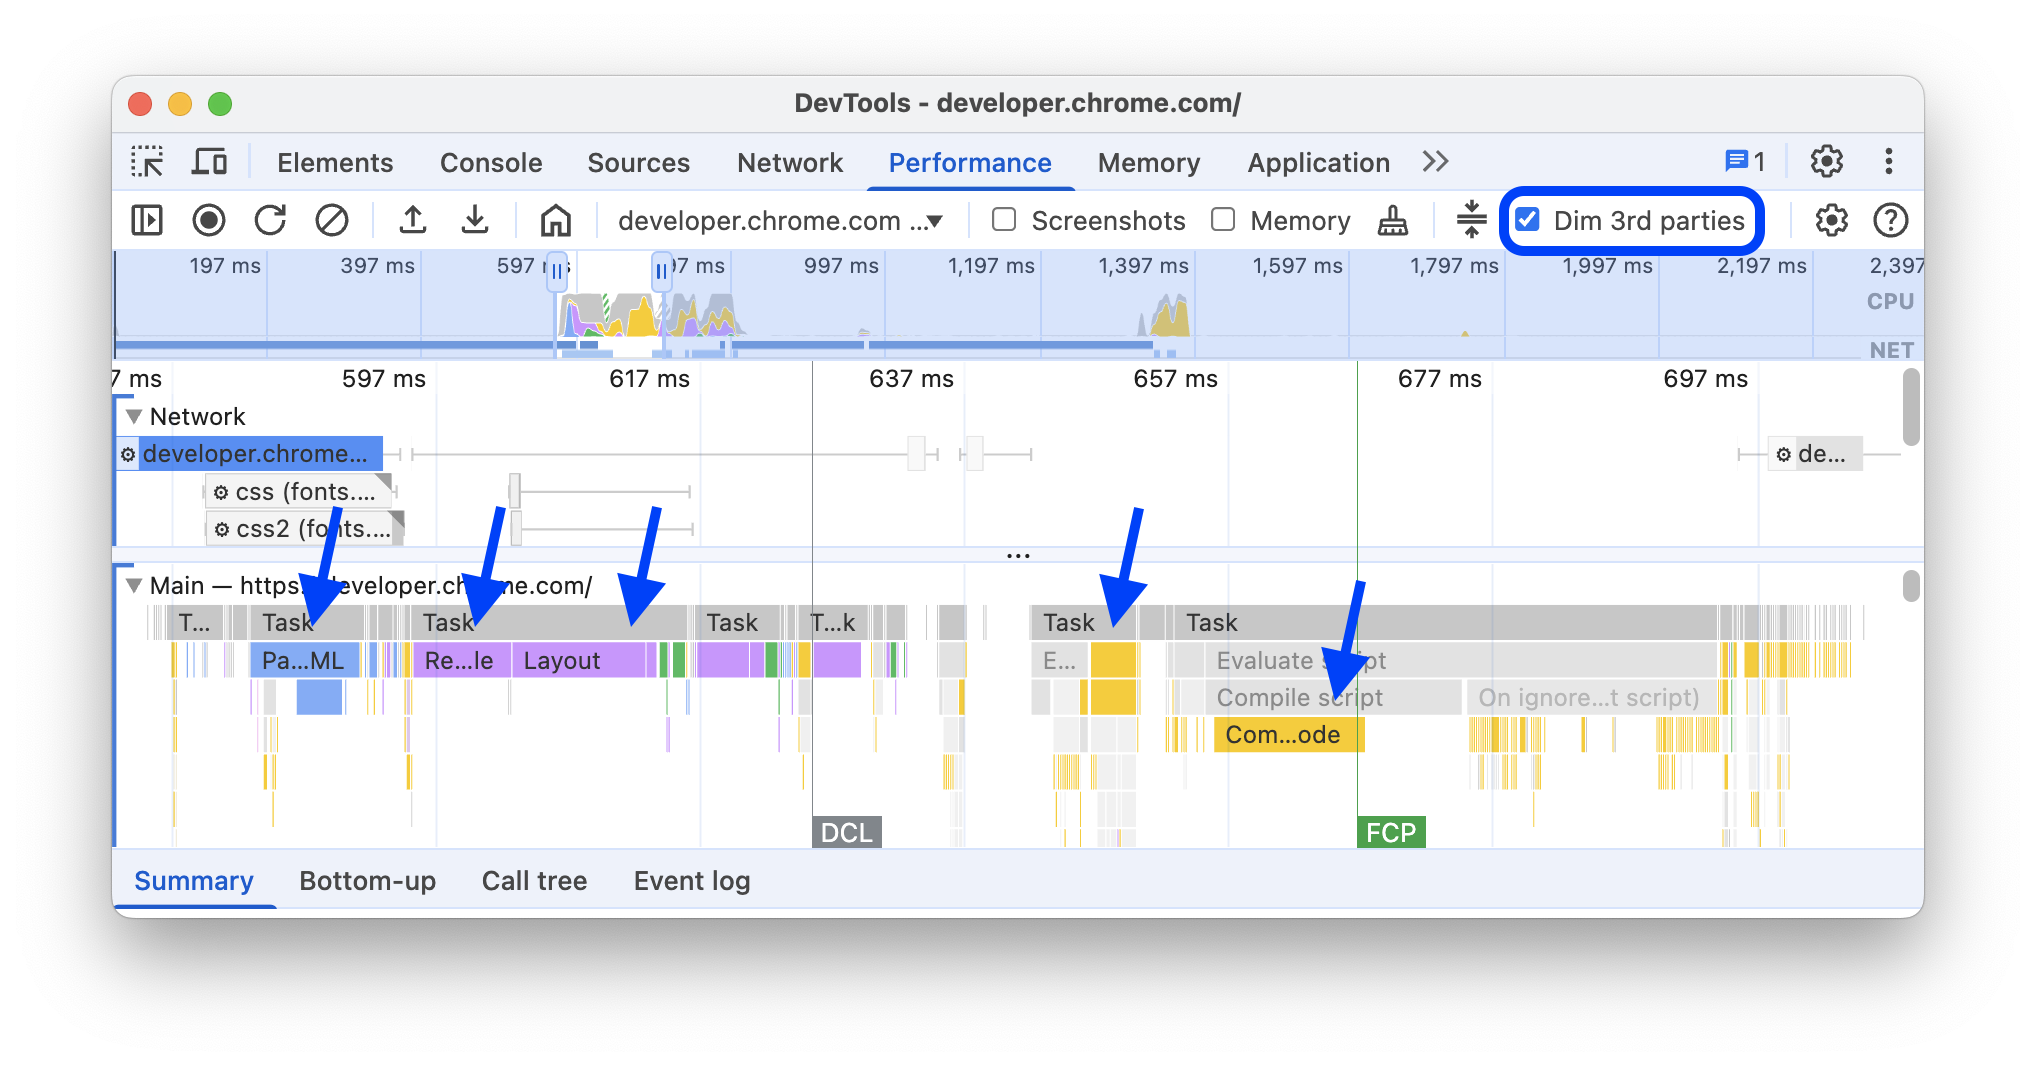
Om alleen op first-party scripts te focussen, vinkt u Dim 3rd parties aan. Het paneel Prestaties zal third-party scripts grijs weergeven.
Zoekactiviteiten
U kunt zoeken in de activiteiten in het Hoofdspoor en in de verzoeken in het Netwerkspoor .
Om een zoekvak onderaan het Prestatiepaneel te openen, drukt u op:
- macOS: Command + F
- Windows, Linux: Control + F
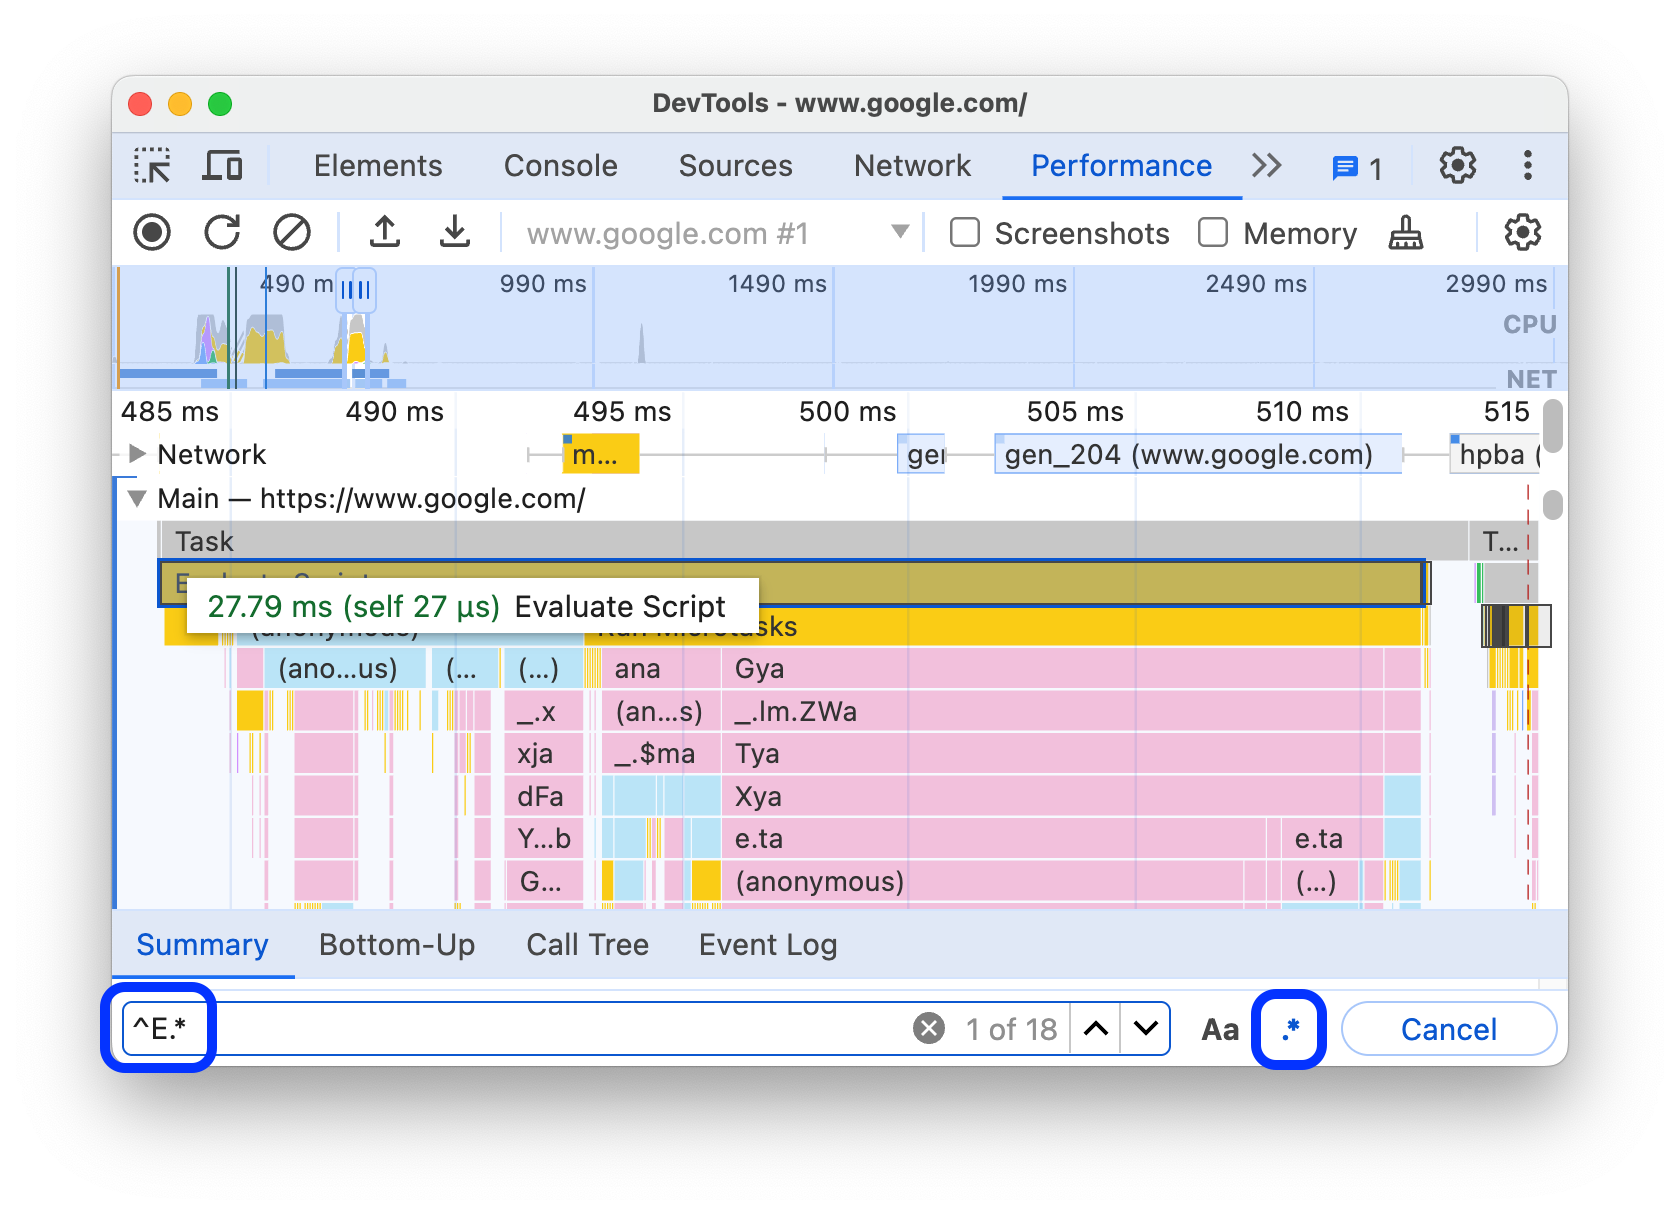
In dit voorbeeld ziet u een reguliere expressie in het zoekvak onderaan die alle activiteiten vindt die beginnen met E
Om door activiteiten te bladeren die overeenkomen met uw zoekopdracht:
- Klik op de knoppen Vorige of Volgende .
- Druk op Shift + Enter om de vorige te selecteren of op Enter om de volgende te selecteren.
In het paneel Prestaties wordt een tooltip weergegeven over de activiteit die in het zoekvak is geselecteerd.
Om queryinstellingen te wijzigen:
- Klik op Hoofdlettergevoelig om de query hoofdlettergevoelig te maken.
- Klik op Reguliere expressie om een reguliere expressie in uw query te gebruiken.
Om het zoekvak te verbergen, klikt u op Annuleren .
De volgorde van de tracks wijzigen en ze verbergen
Om de prestatietracering overzichtelijk te houden, kunt u de volgorde van de tracks wijzigen en de irrelevante tracks verbergen in de trackconfiguratiemodus.
Om tracks te verplaatsen en te verbergen:
- Om de configuratiemodus te openen, klikt u met de rechtermuisknop op een tracknaam en selecteert u Tracks configureren .
- Klik op up of down om een track omhoog of omlaag te verplaatsen. Klik op om deze te verbergen.
- Wanneer u klaar bent, klikt u onderaan op Voltooi het configureren van tracks om de configuratiemodus te verlaten.
Bekijk de video om deze workflow in actie te zien.
Het paneel Prestaties slaat de spoorconfiguratie op voor nieuwe sporen, maar niet voor volgende DevTools-sessies.
Bekijk de belangrijkste threadactiviteit
Met het hoofdspoor kunt u de activiteit bekijken die heeft plaatsgevonden in de hoofdthread van de pagina.
Klik op een gebeurtenis om meer informatie hierover te bekijken op het tabblad Samenvatting , inclusief maar niet beperkt tot: duur (en eigen duur), link naar de overeenkomstige regel in het bronscript, URL van oorsprong (met entiteitsnaam, indien bekend), stack trace, indien van toepassing, en timingverdeling in een cirkeldiagram.
In het paneel Prestaties wordt de geselecteerde gebeurtenis in het blauw weergegeven.
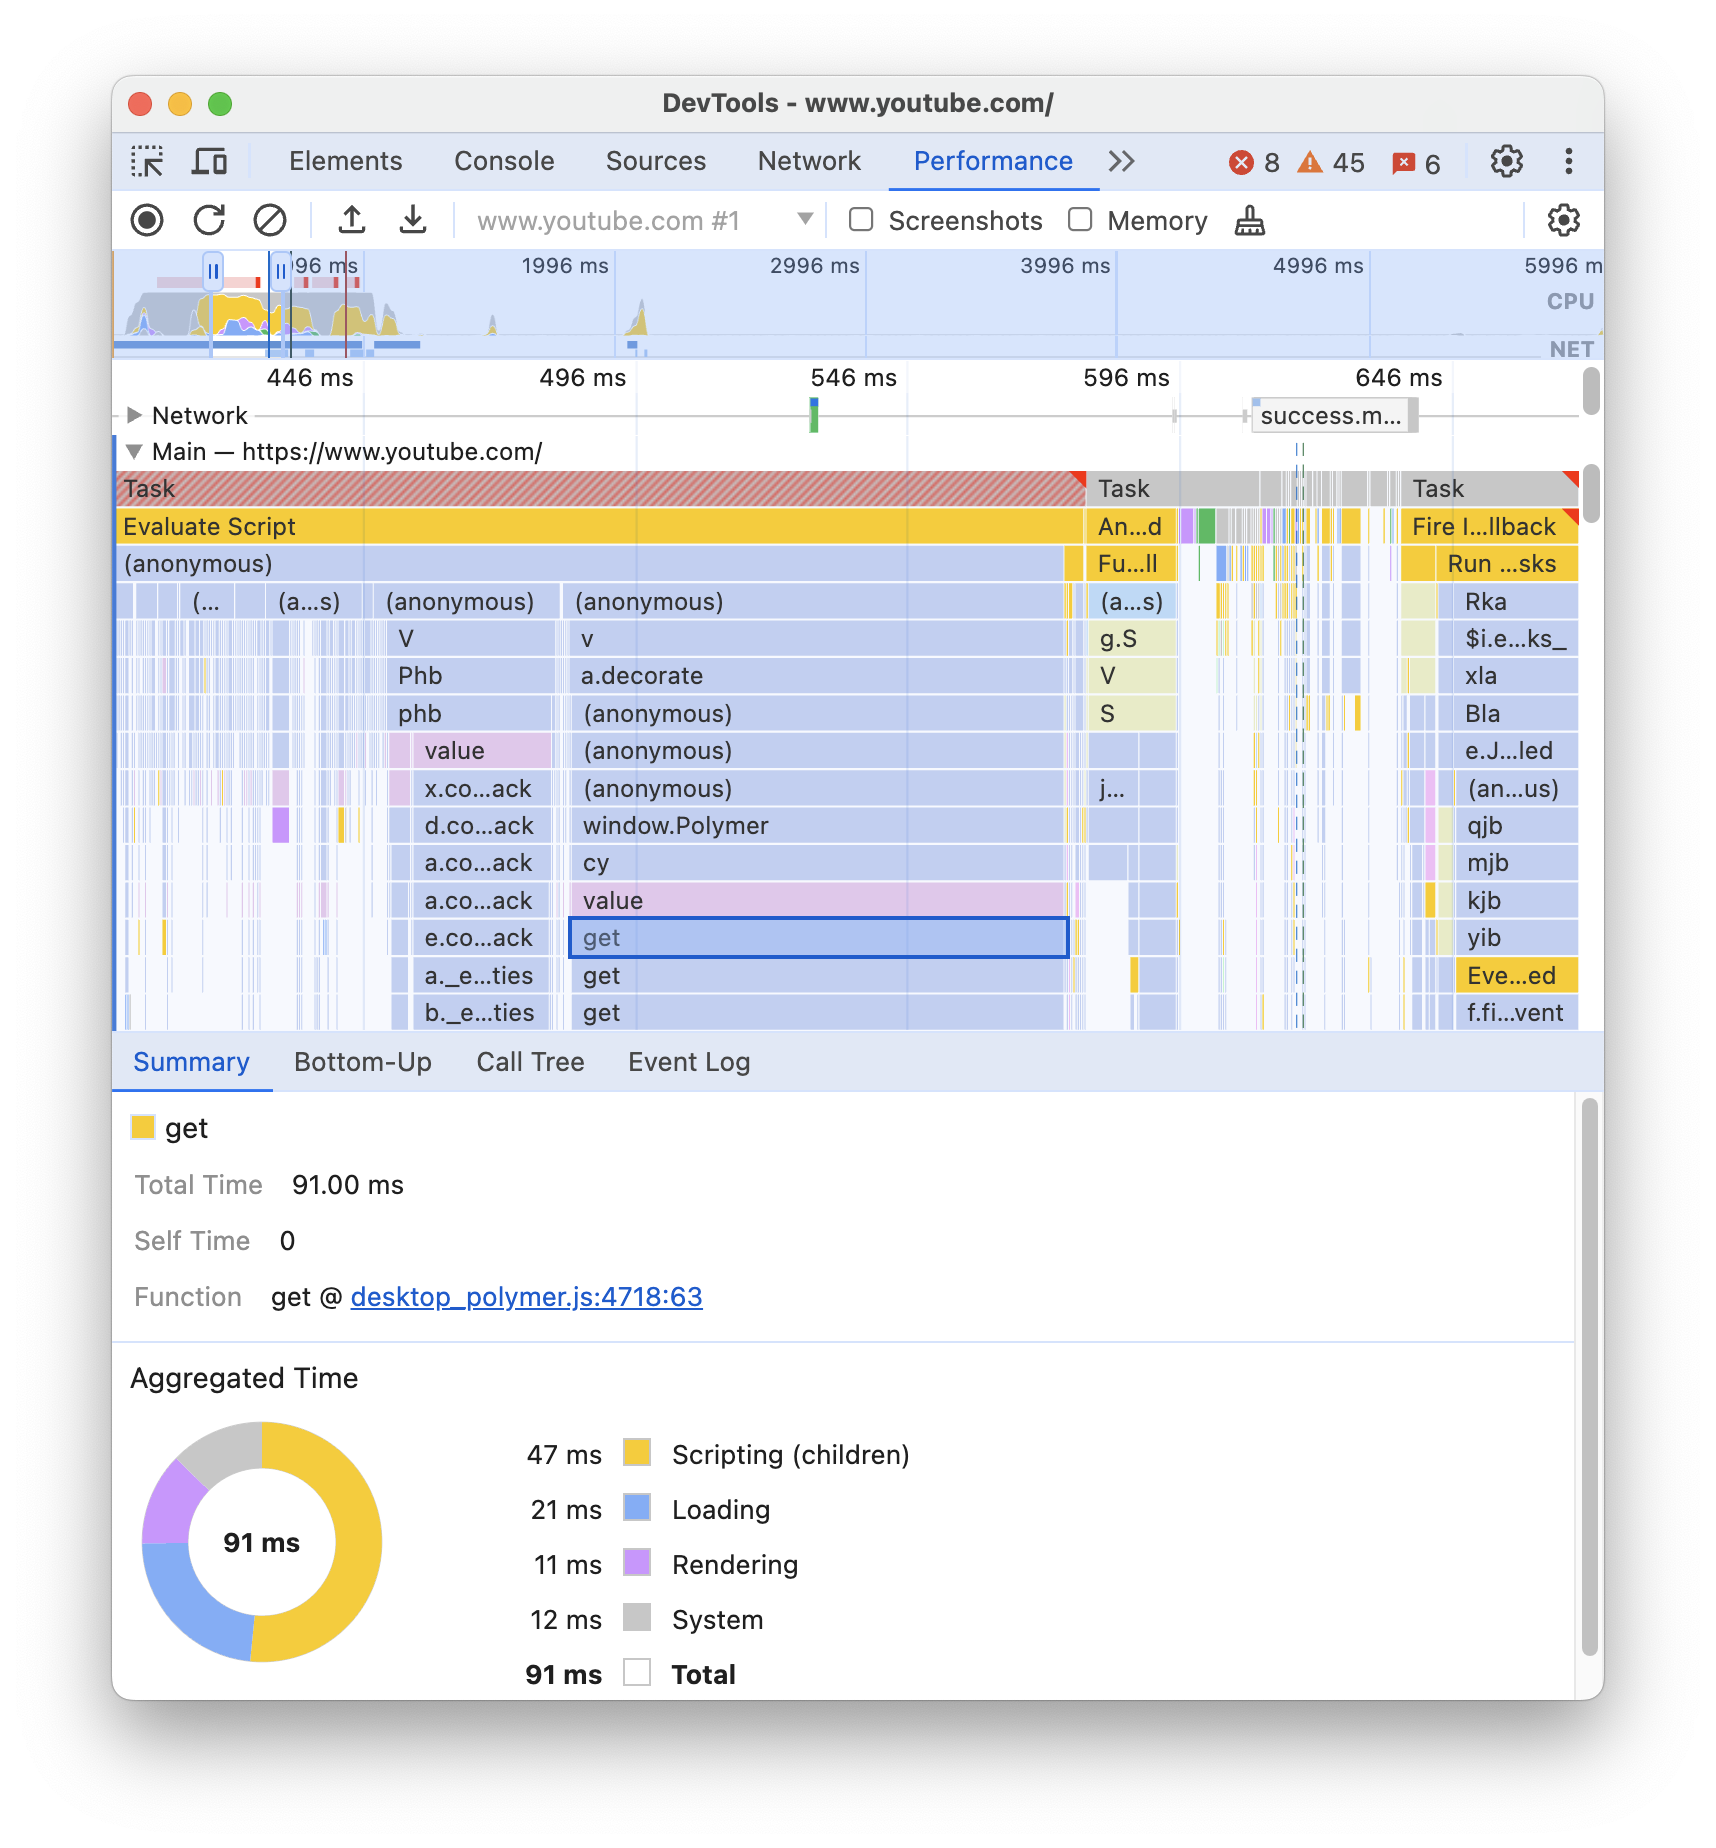
In dit voorbeeld wordt meer informatie over de aanroepgebeurtenis van de functie get weergegeven op het tabblad Samenvatting .
Maak onderscheid tussen first-party- en third-party-evenementen
Overmatige afhankelijkheid van code van derden kan de laadprestaties negatief beïnvloeden. Het paneel Prestaties helpt u visueel onderscheid te maken tussen first-party en third-party events in de trace, zodat u een weloverwogen beslissing kunt nemen over het verminderen of uitstellen van het laden van third-party code om de content van uw pagina te prioriteren.
Om alleen te focussen op de prestaties van first-party code:
- Zorg ervoor dat er niets is geselecteerd in de prestatietracering of op het tabblad Inzichten . Klik hiervoor op een lege ruimte in de tracering.
- Vink 'Dim 3rd parties' aan in de actiebalk bovenaan. Het paneel 'Prestaties' markeert gebeurtenissen gerelateerd aan derden in de prestatietracering en laat alleen de eerste partij gemarkeerd.
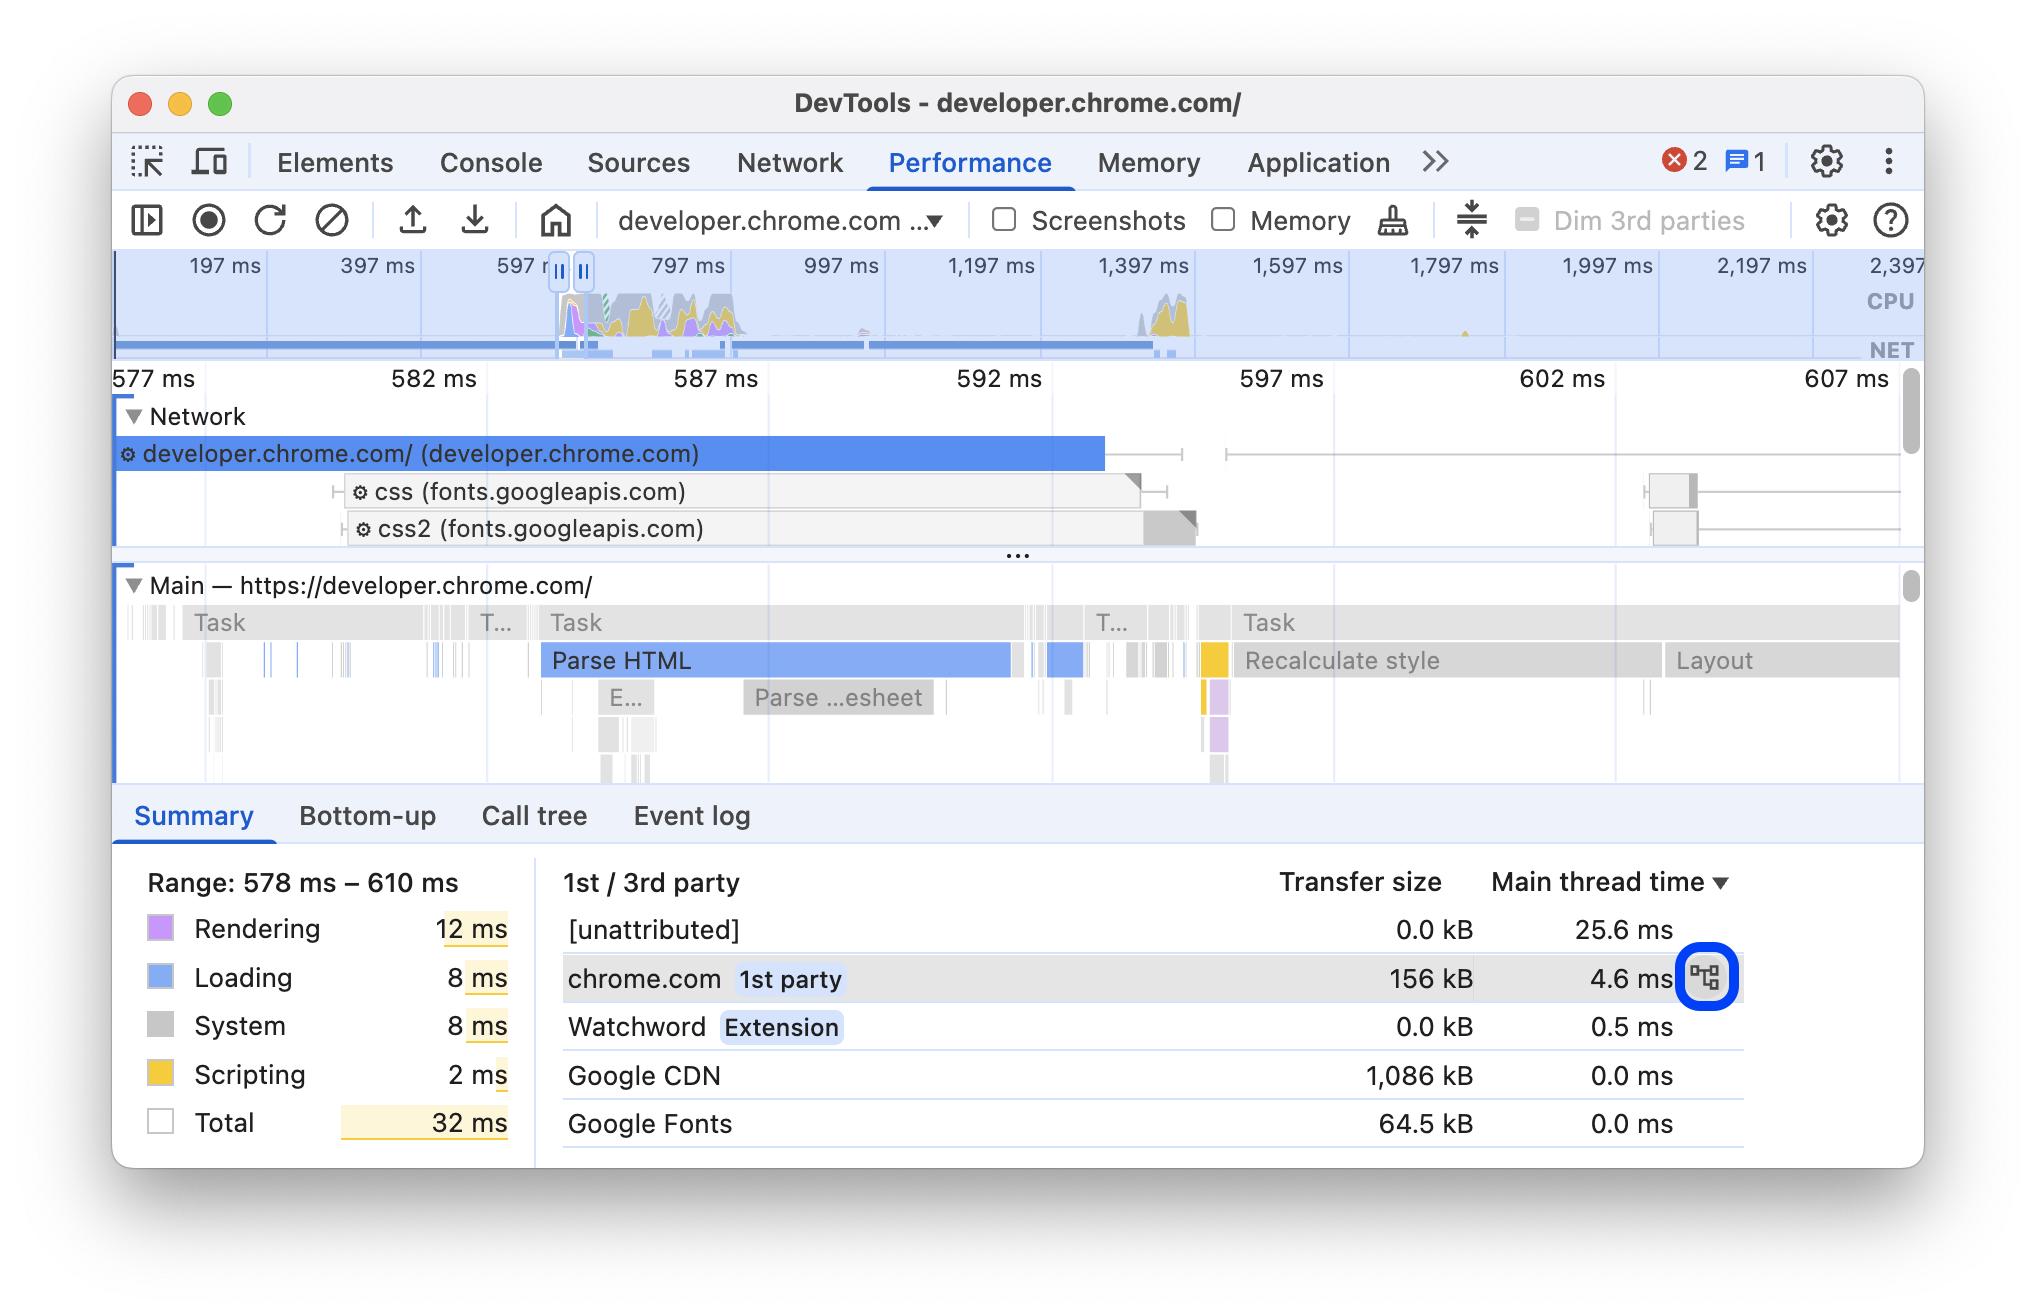
Markeer gebeurtenissen met de tabel '1e / 3e partij'
Binnen een geselecteerd bereik in het Tijdlijnoverzicht en wanneer geen van de gebeurtenissen is geselecteerd, wordt op het tabblad Samenvatting een tabel met 1e/3e partijen weergegeven met daarin de respectievelijke overdrachtsgroottes en hoofdthreadtijden van het volgende:
- First-party entiteit gemarkeerd met een
1st partybadge. - Alle gedetecteerde entiteiten van derden in het geselecteerde bereik, niet gemarkeerd.
- Extensies gemarkeerd met
Extension. - Andere
[unattributed]entiteiten.
Om gerelateerde gebeurtenissen gemarkeerd in de trace te zien en de rest grijs weergegeven, beweegt u de muisaanwijzer over de entiteiten in de tabel. Om de gebeurtenissen van een entiteit gemarkeerd te laten, selecteert u deze in de tabel. Om de markering te verwijderen, klikt u op een lege ruimte in de trace.
Als u activiteiten wilt openen die op deze entiteit zijn gegroepeerd in het tabblad Bottom-up , beweegt u de muis over de entiteit in de tabel en klikt u op Bottom-up ernaast.
Lees de vlamgrafiek
Het paneel Prestaties geeft de activiteit van de hoofdthread weer in een vlamdiagram. De x-as geeft de registratie in de loop van de tijd weer. De y-as geeft de call stack weer. De gebeurtenissen bovenaan veroorzaken de gebeurtenissen eronder.
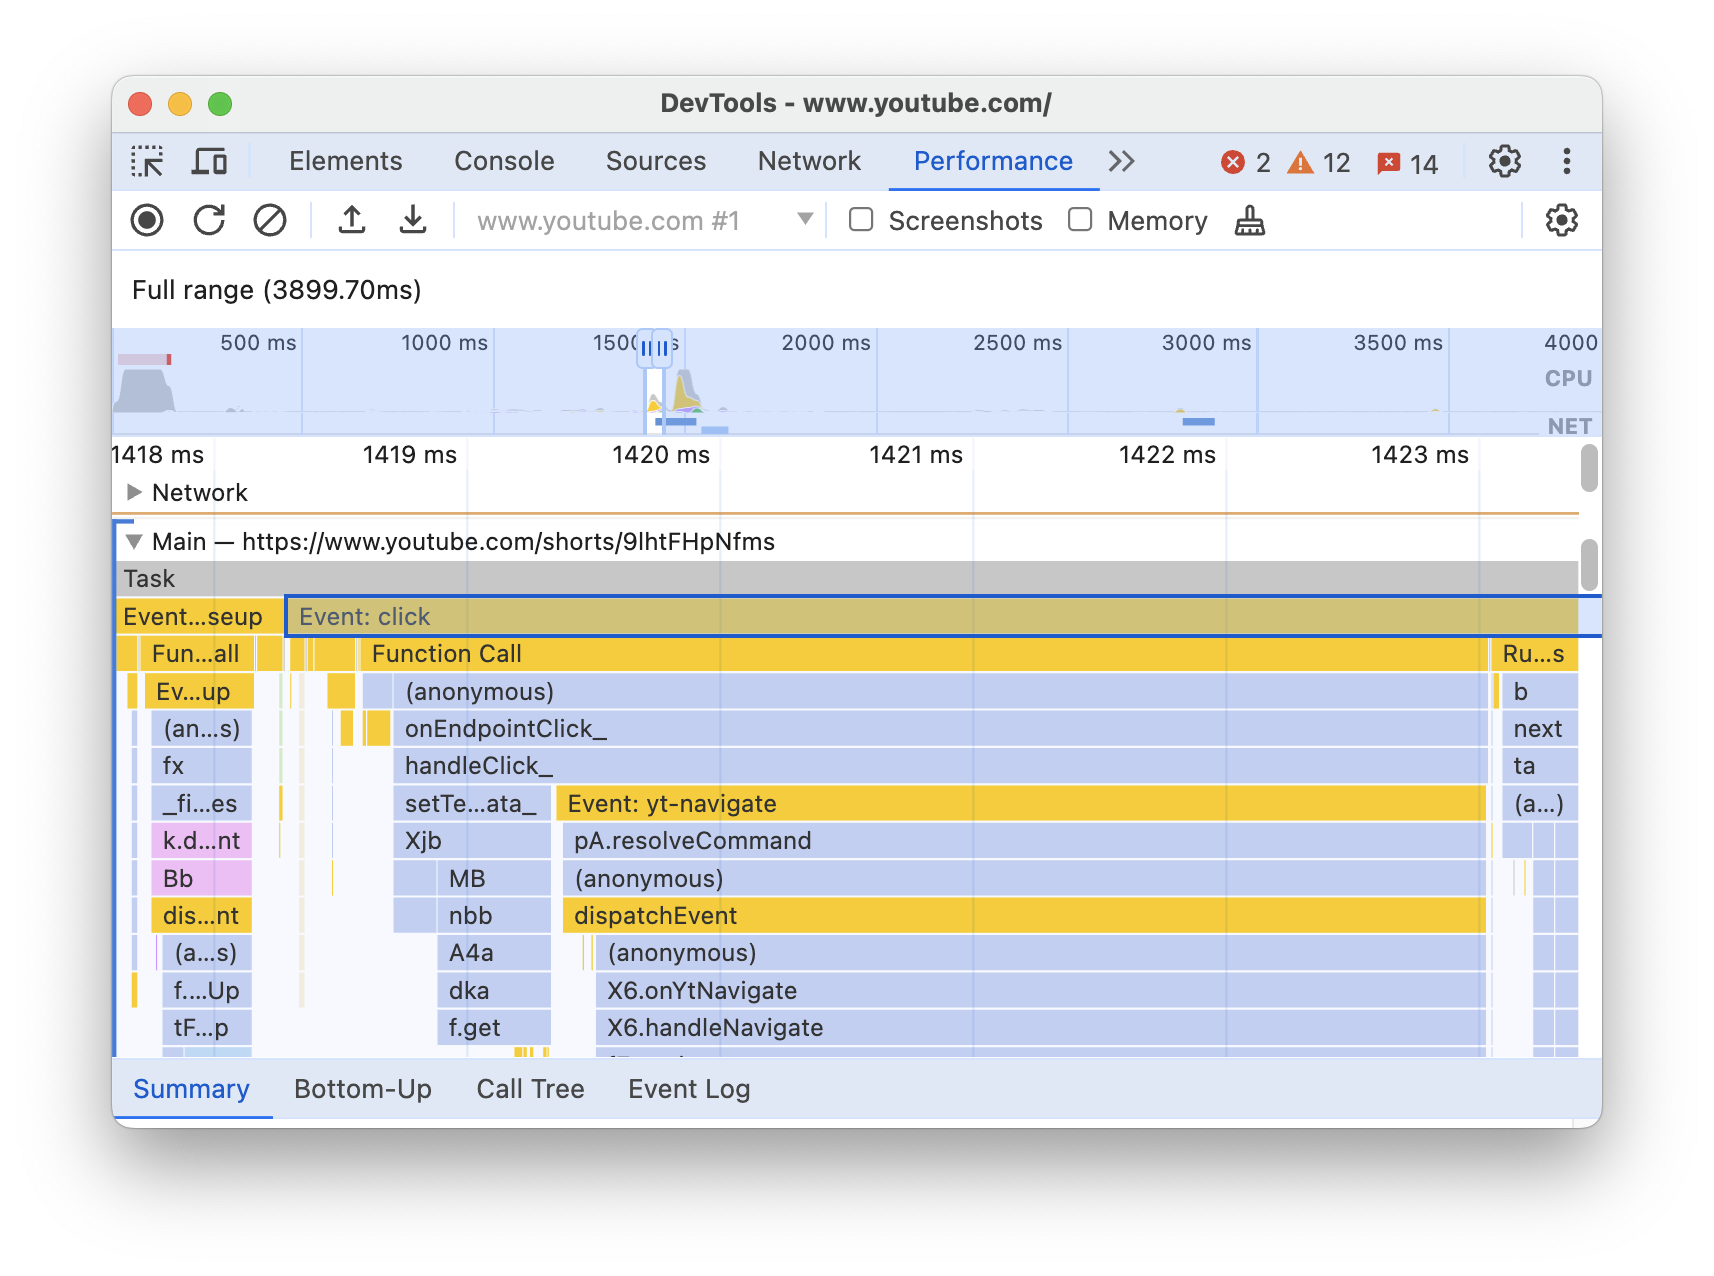
Dit voorbeeld toont een vlamdiagram in het hoofdspoor . Een click veroorzaakte een anonieme functieaanroep. Deze functie riep op zijn beurt onEndpointClick_ aan, wat handleClick_ aanriep, enzovoort.
Het paneel Prestaties wijst scripts willekeurige kleuren toe om de vlamgrafiek op te splitsen en leesbaarder te maken. In het eerdere voorbeeld zijn functieaanroepen van het ene script lichtblauw gekleurd. Aanroepen van een ander script zijn lichtroze gekleurd. Het donkergeel staat voor scriptactiviteit en de paarse gebeurtenis voor renderingactiviteit. Deze donkergele en paarse gebeurtenissen zijn consistent in alle opnames.
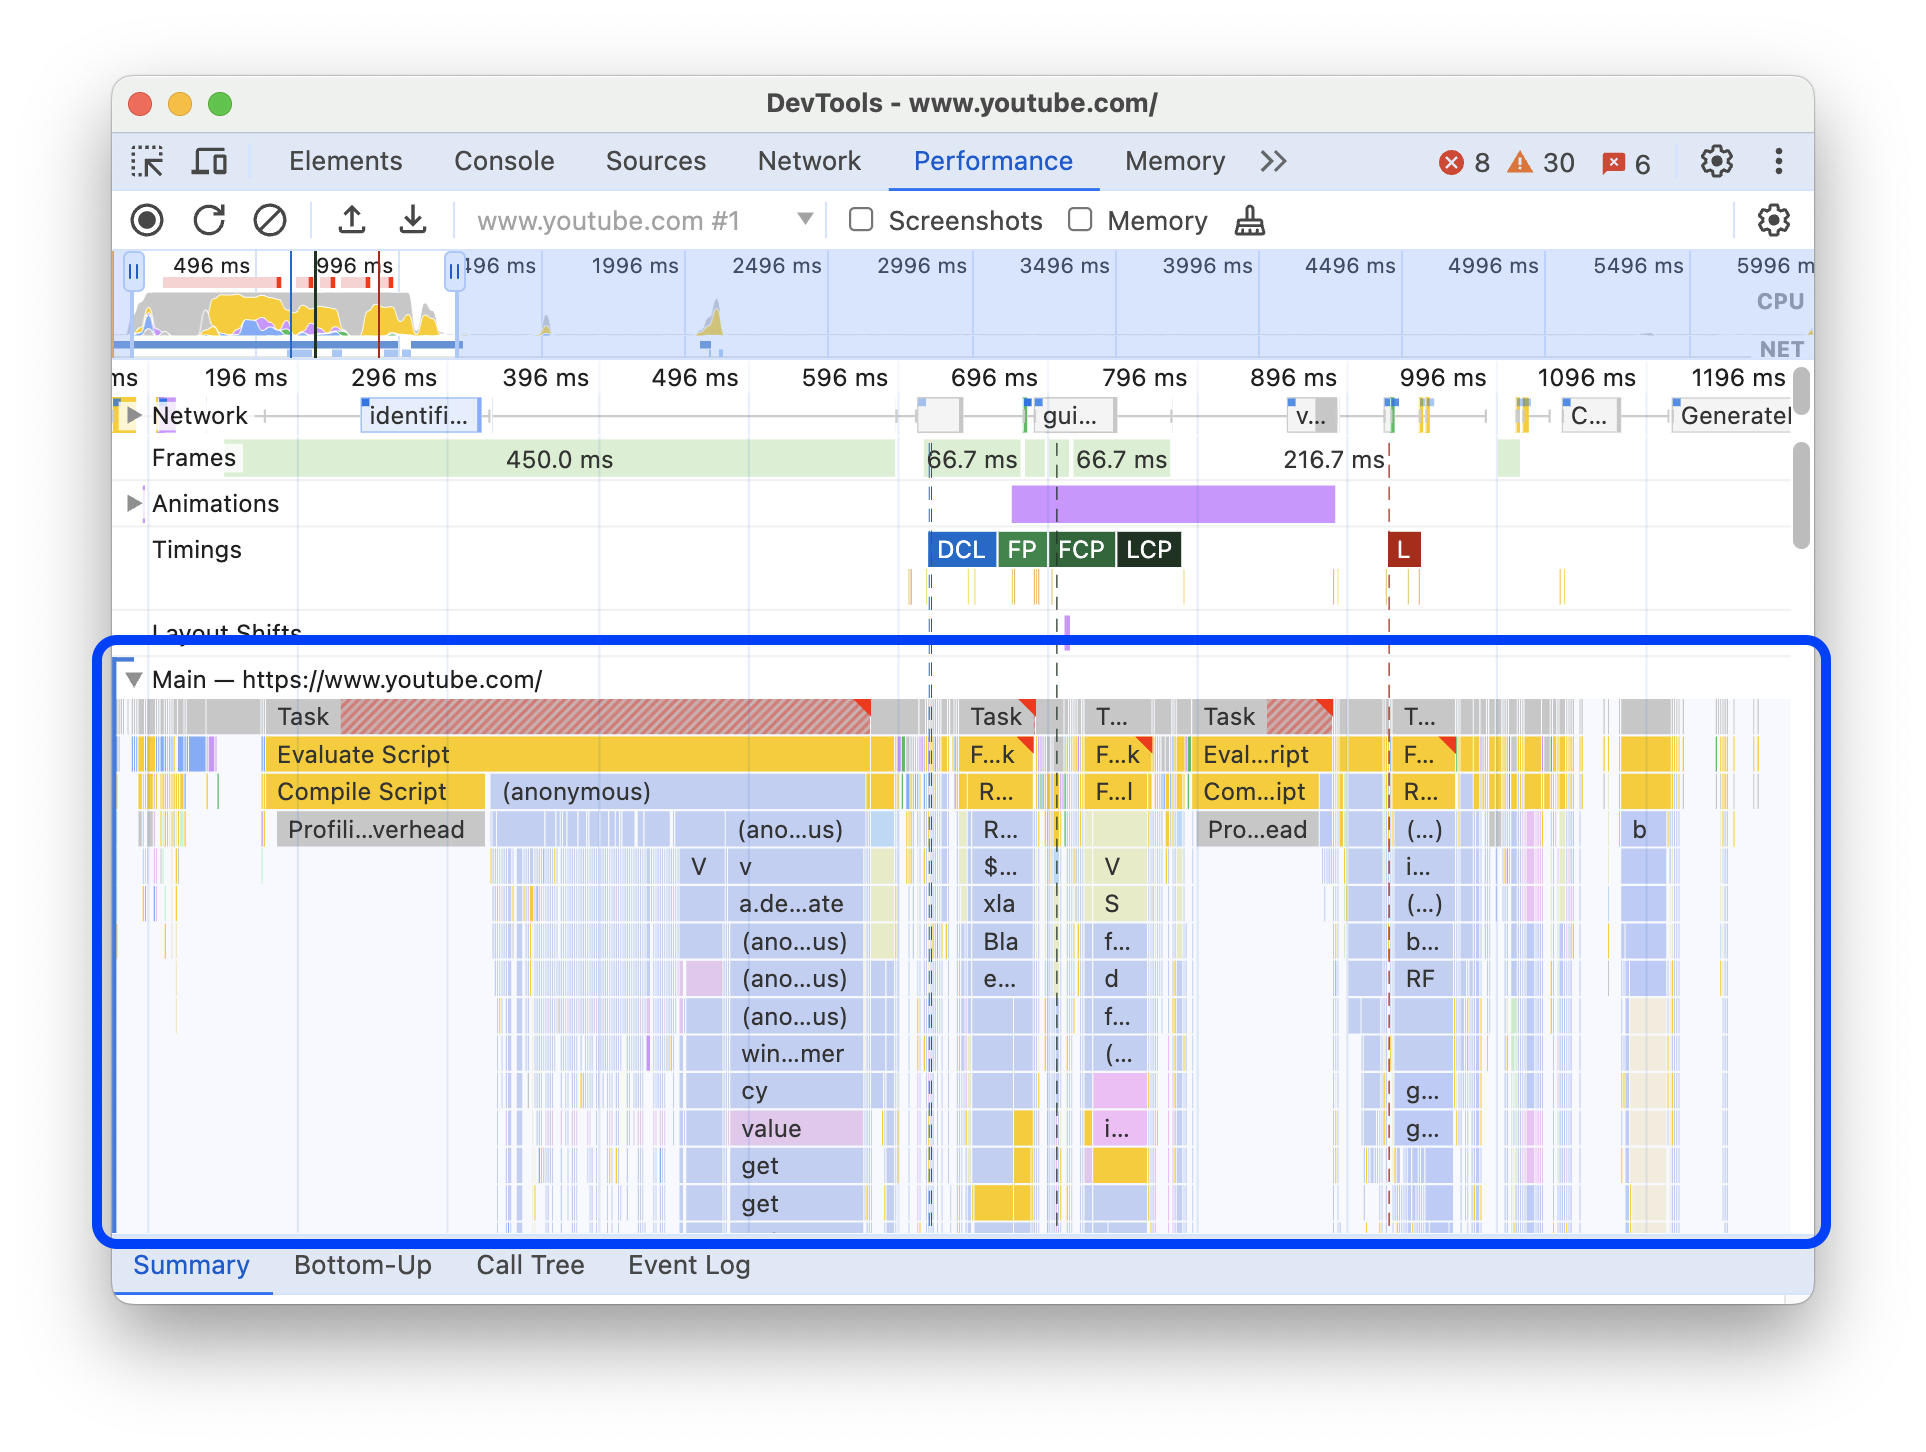
Lange taken worden ook gemarkeerd met een rode driehoek, en het deel dat langer duurt dan 50 milliseconden wordt rood gearceerd:
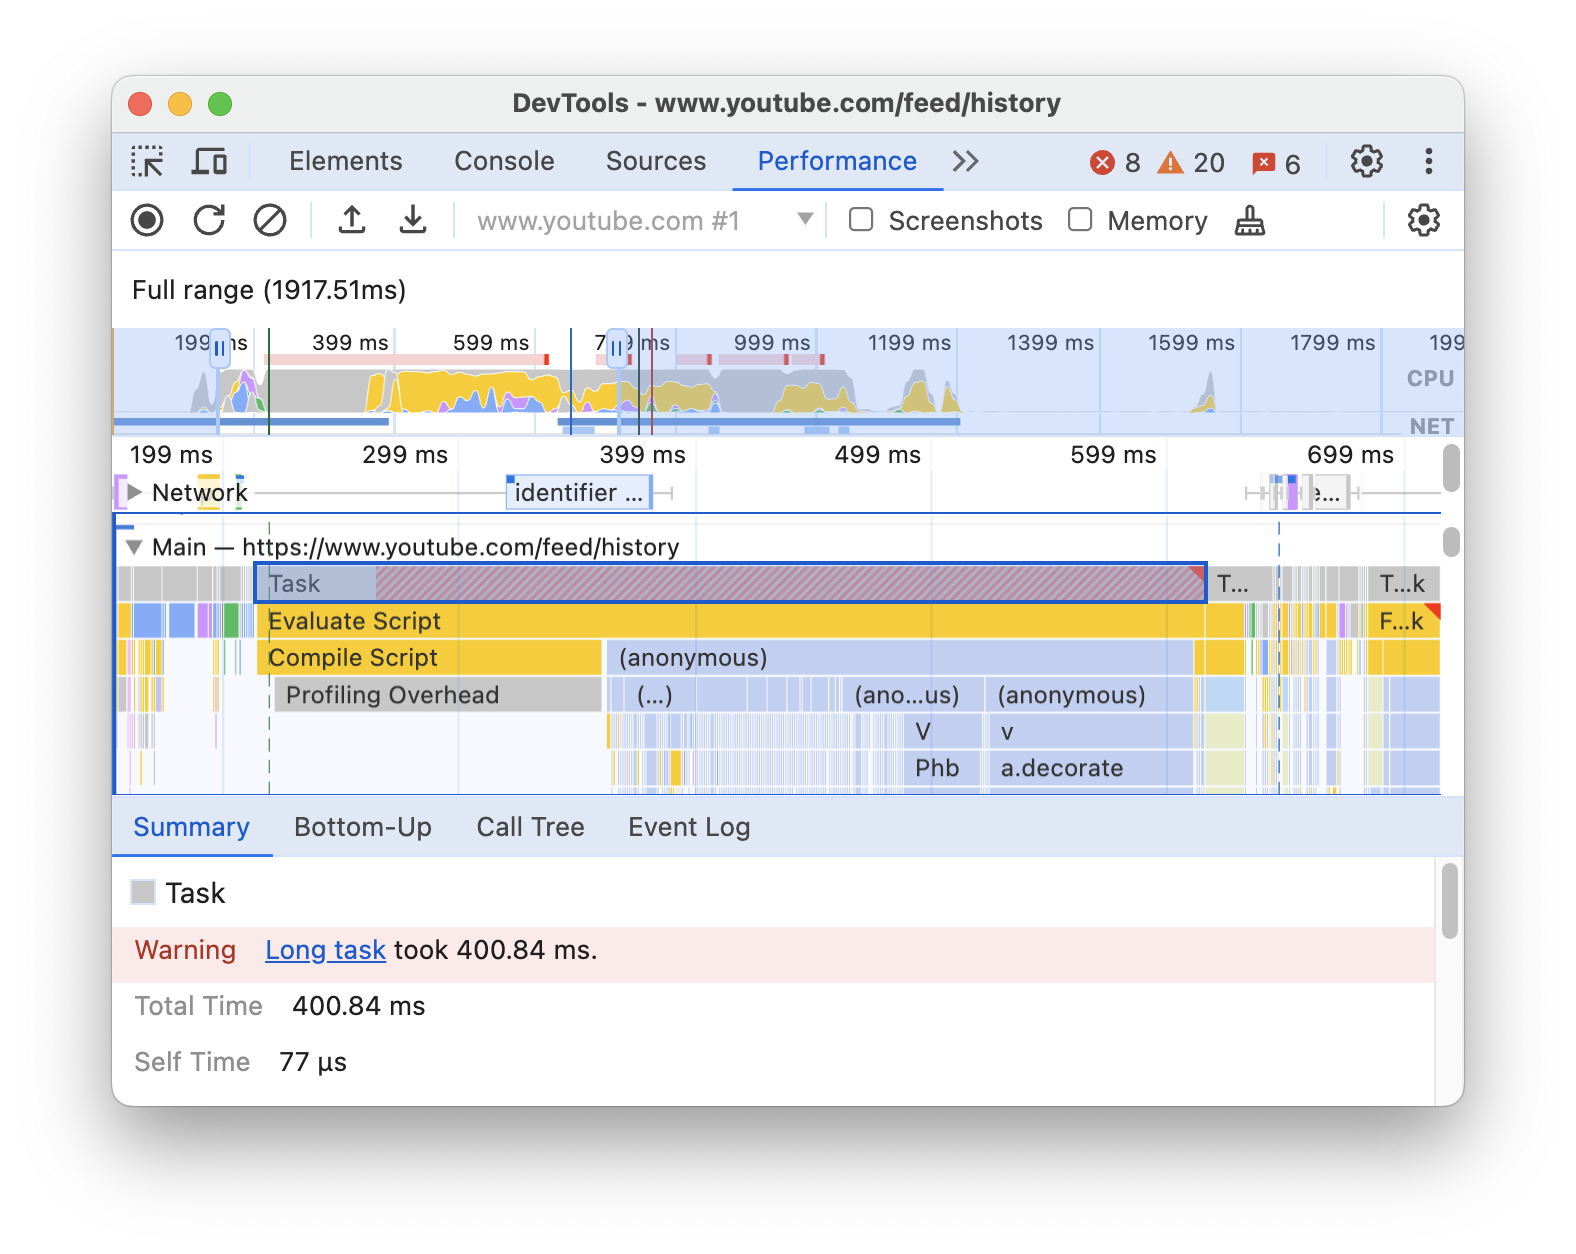
In dit voorbeeld duurde de taak meer dan 400 milliseconden. Het gedeelte dat de laatste 350 milliseconden vertegenwoordigt, is daarom rood gearceerd, terwijl de eerste 50 milliseconden dat niet zijn.
Bovendien toont het hoofdspoor informatie over CPU-profielen die zijn gestart en gestopt met de consolefuncties profile() en profileEnd() .
Zie JavaScript-samples uitschakelen om het gedetailleerde vlamdiagram van JavaScript-aanroepen te verbergen. Wanneer JavaScript-samples zijn uitgeschakeld, ziet u alleen de gebeurtenissen op hoog niveau, zoals Event (click) en Function Call .
Volg de initiatiefnemers van evenementen
Op het hoofdspoor kunnen pijlen worden weergegeven die de volgende initiators en de gebeurtenissen die ze veroorzaakten met elkaar verbinden:
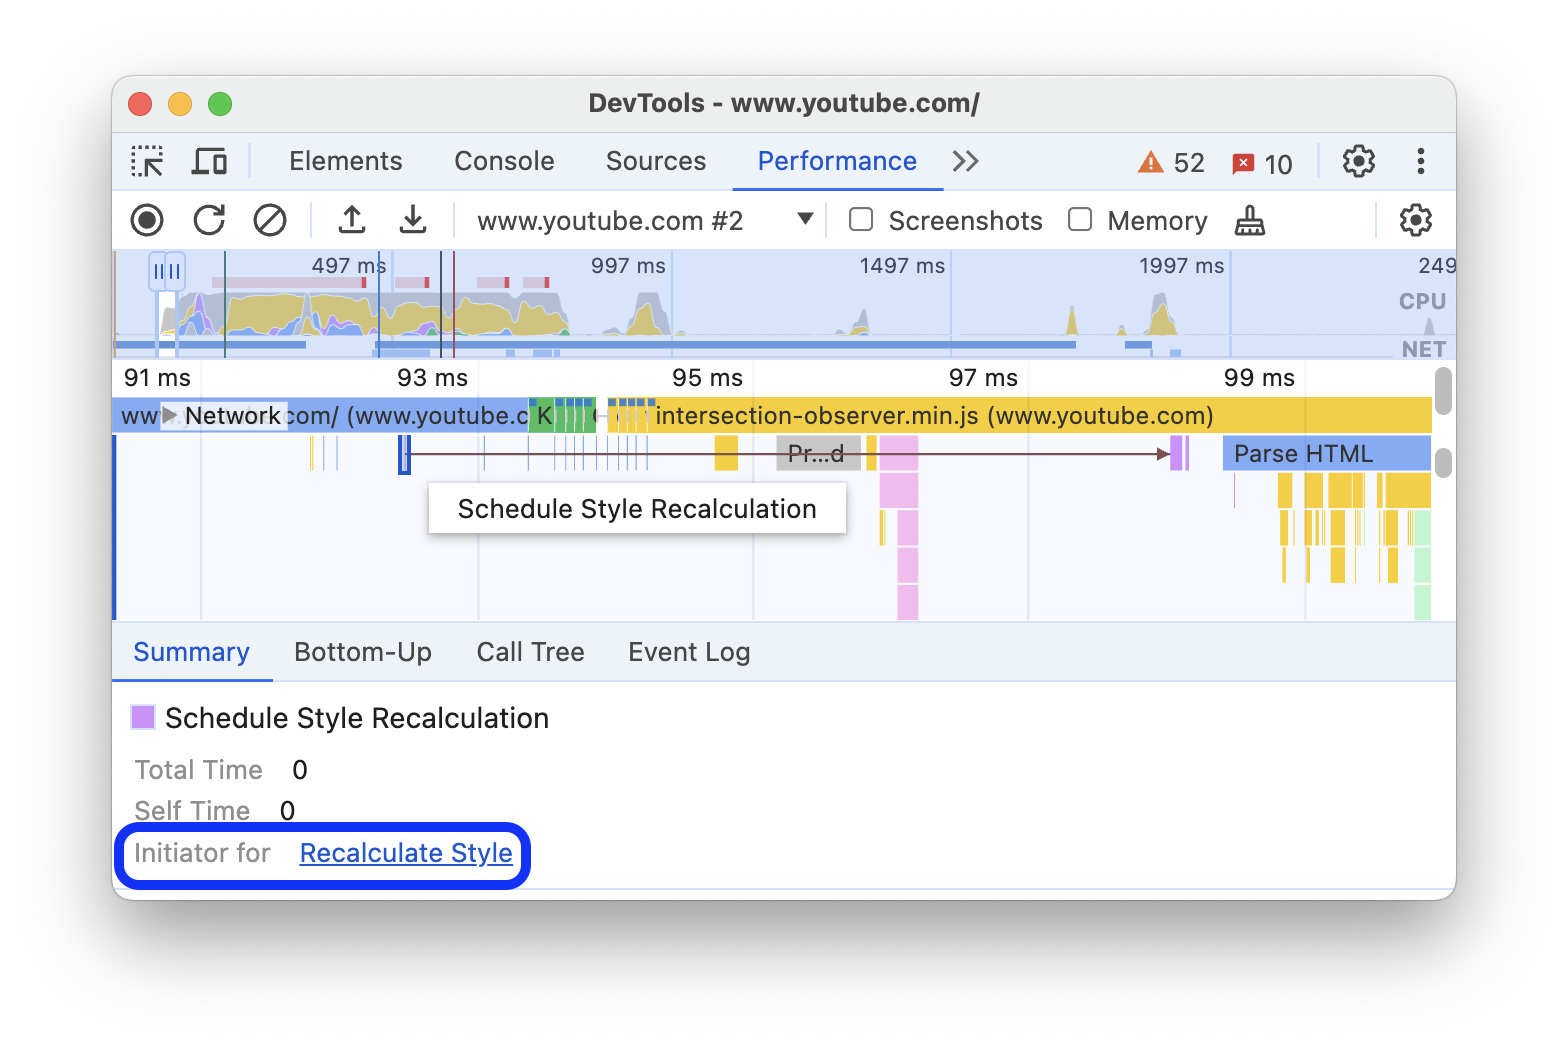
- Ongeldigverklaring van stijl of lay-out -> Stijlen of lay-out opnieuw berekenen
- Animatieframe aanvragen -> Animatieframe geactiveerd
- Verzoek om terug te bellen bij inactiviteit -> Brand om terug te bellen bij inactiviteit
- Timer installeren -> Timer geactiveerd
- WebSocket aanmaken -> WebSocket-handshake verzenden... en ontvangen of WebSocket vernietigen
- PostTaak plannen -> PostTaak activeren of PostTaak afbreken
Om de pijlen te zien, zoekt u in het vlammendiagram naar een initiator of de gebeurtenis die deze heeft veroorzaakt en selecteert u deze.
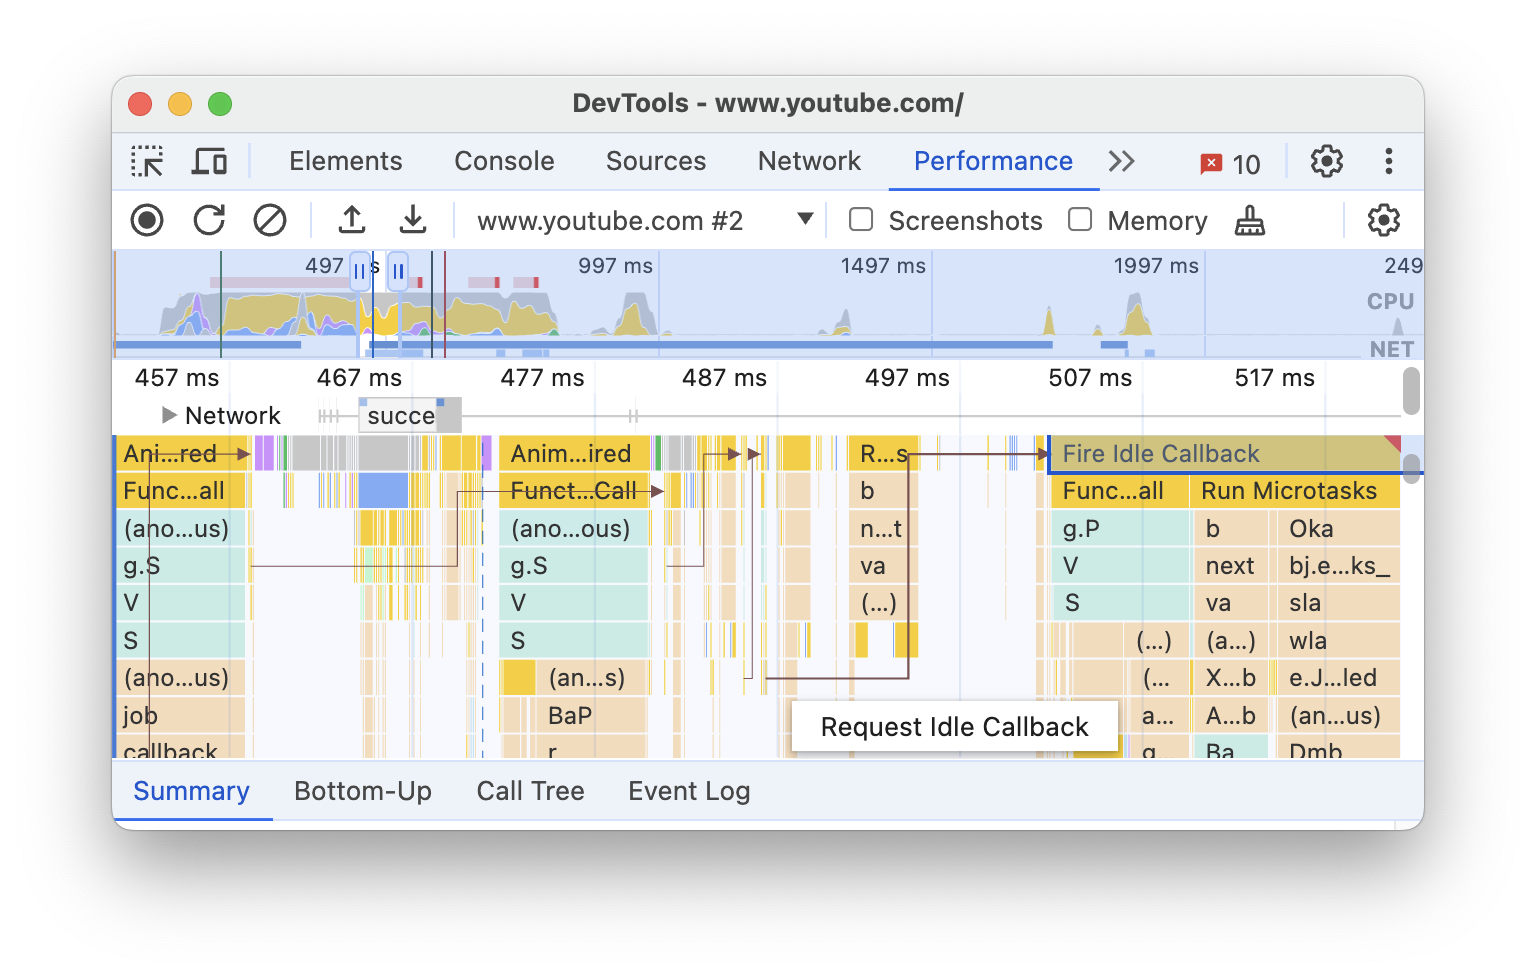
Indien geselecteerd, toont het tabblad Samenvatting 'Initiator' voor koppelingen voor initiators en ' Geïnitieerd door ' voor de gebeurtenissen die ze hebben veroorzaakt. Klik erop om tussen de bijbehorende gebeurtenissen te springen.
Verberg functies en hun kinderen in het vlamdiagram
Om het vlammendiagram in de hoofdthread overzichtelijk te houden, kunt u geselecteerde functies of hun onderliggende functies verbergen:
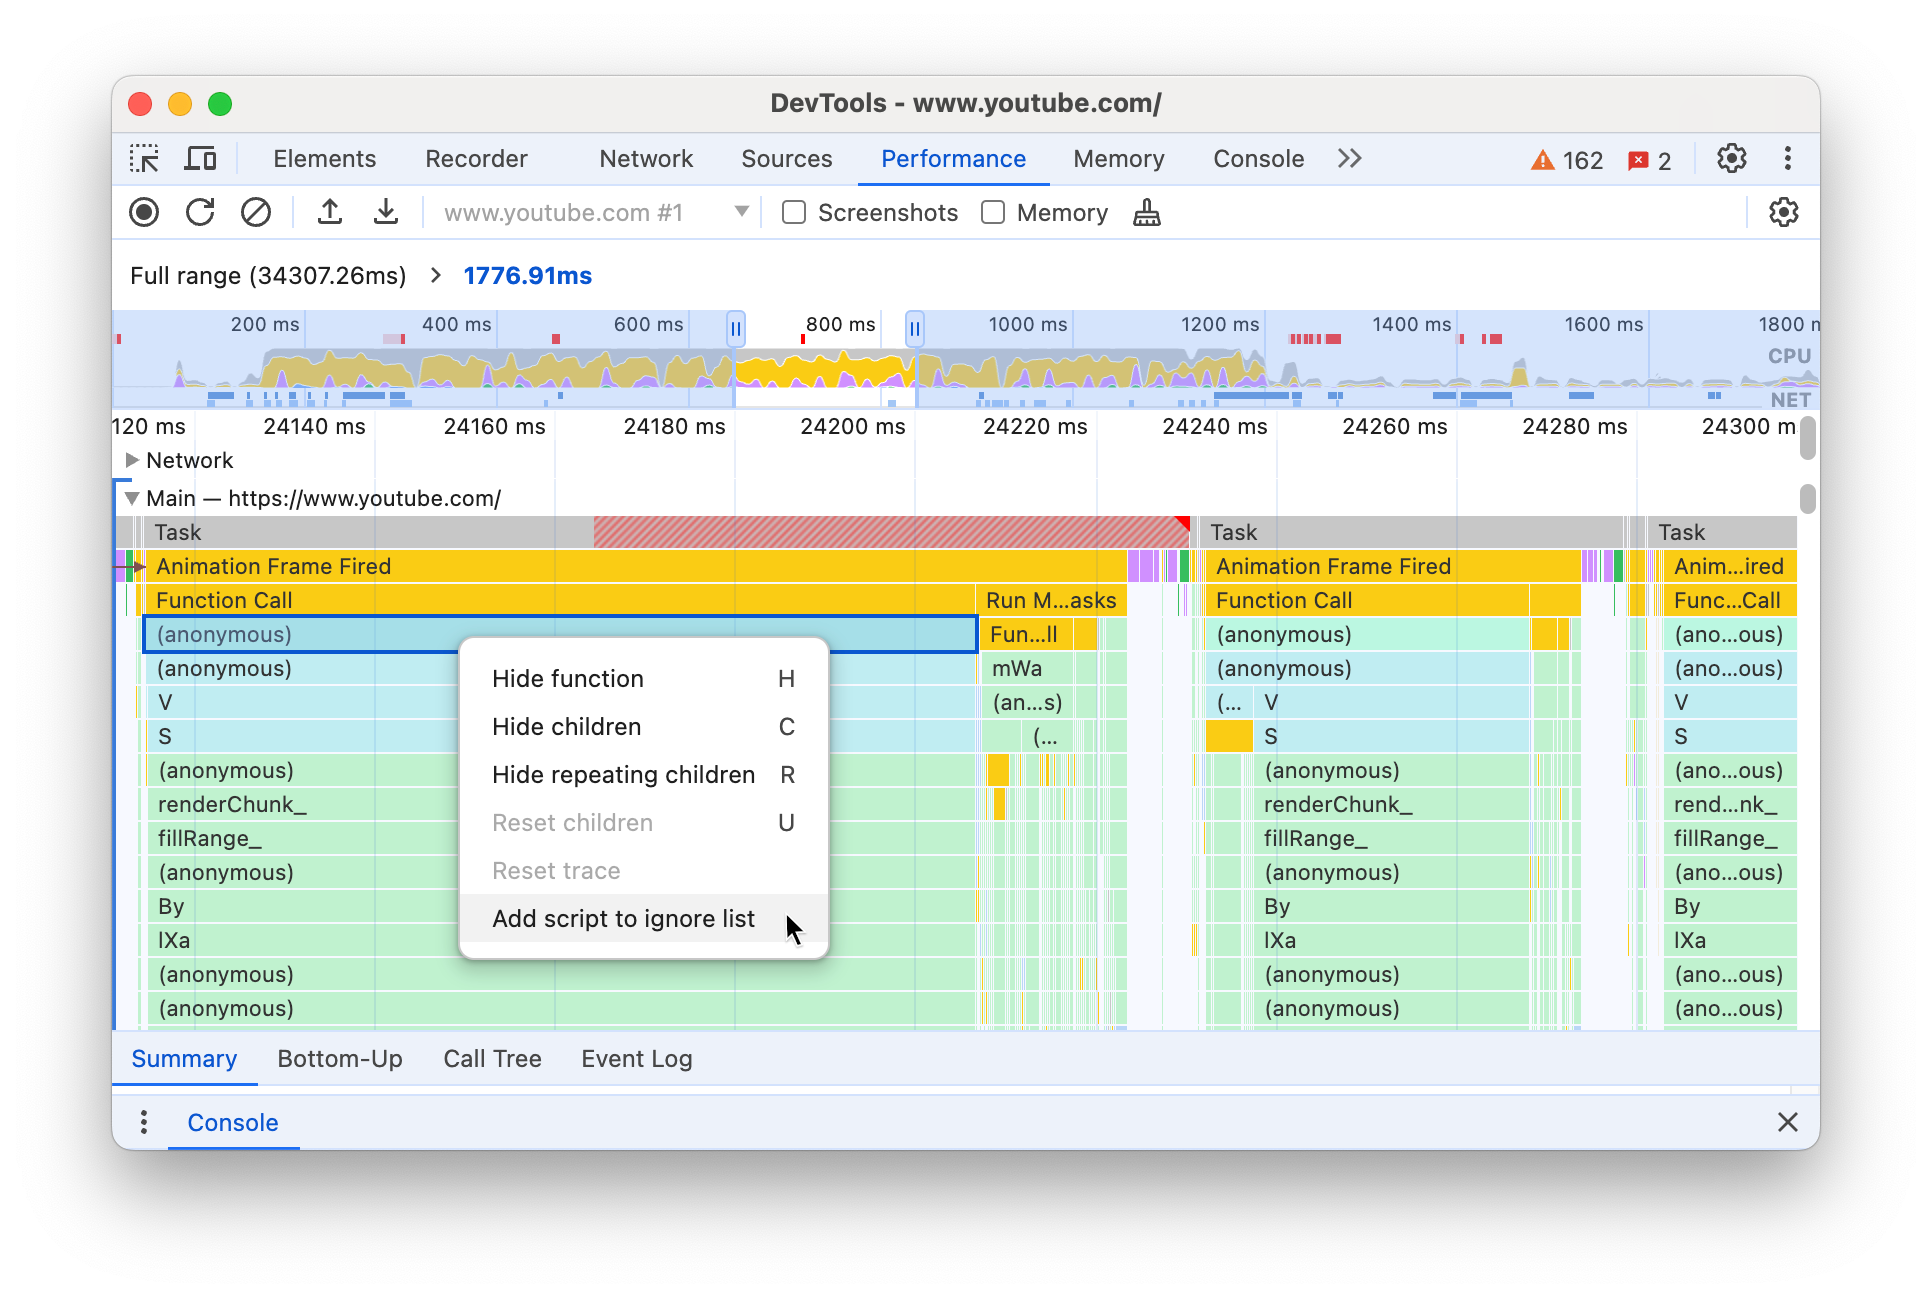
Klik in het hoofdspoor met de rechtermuisknop op een functie en kies een van de volgende opties of druk op de overeenkomstige sneltoets:
- Verberg functie (
H) - Verberg kinderen (
C) - Verberg herhalende kinderen (
R) - Kinderen resetten (
U) - Trace resetten (
T) - Script toevoegen aan negeerlijst (
I)
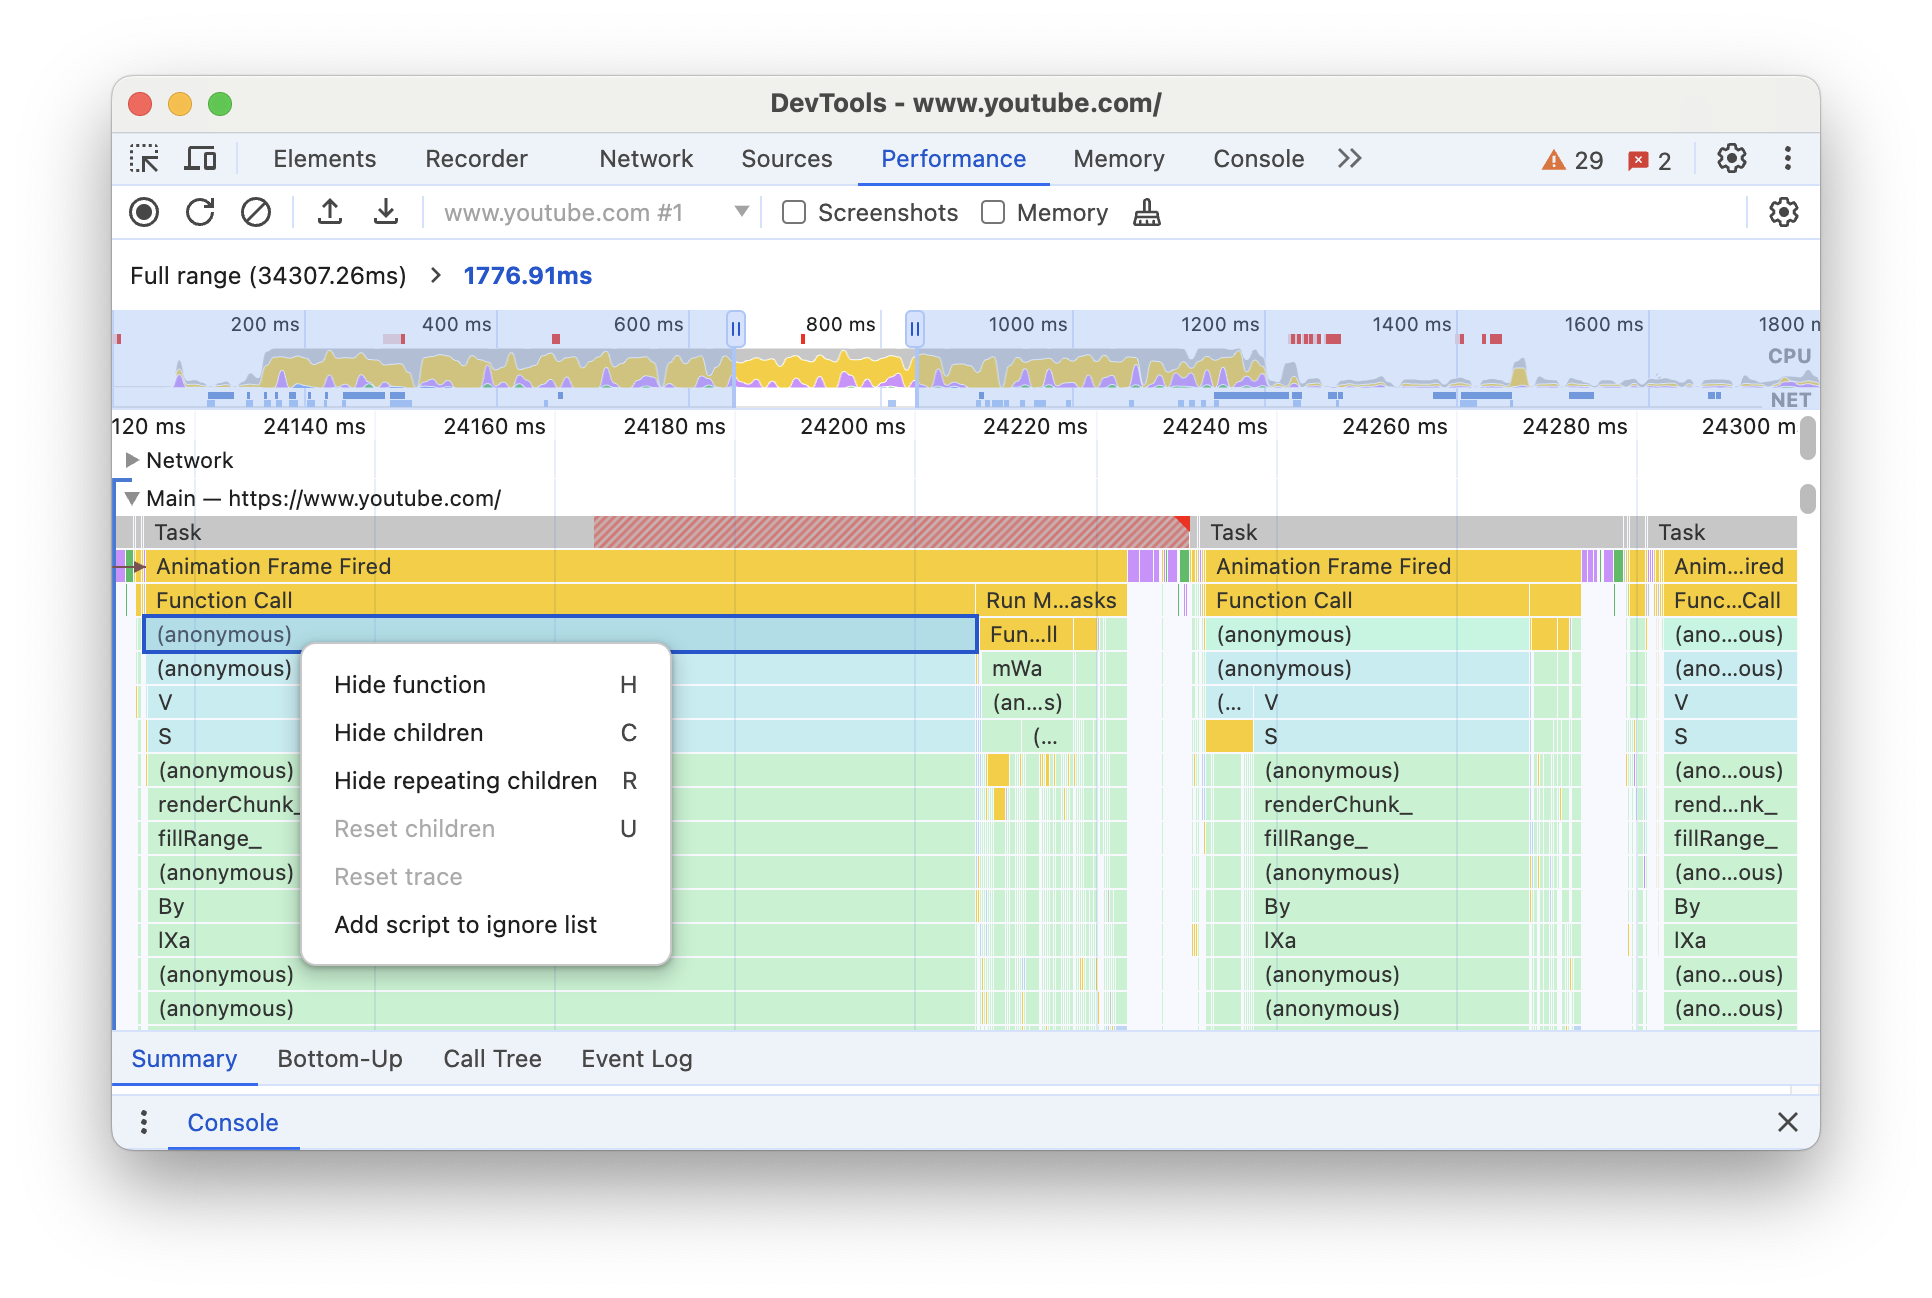
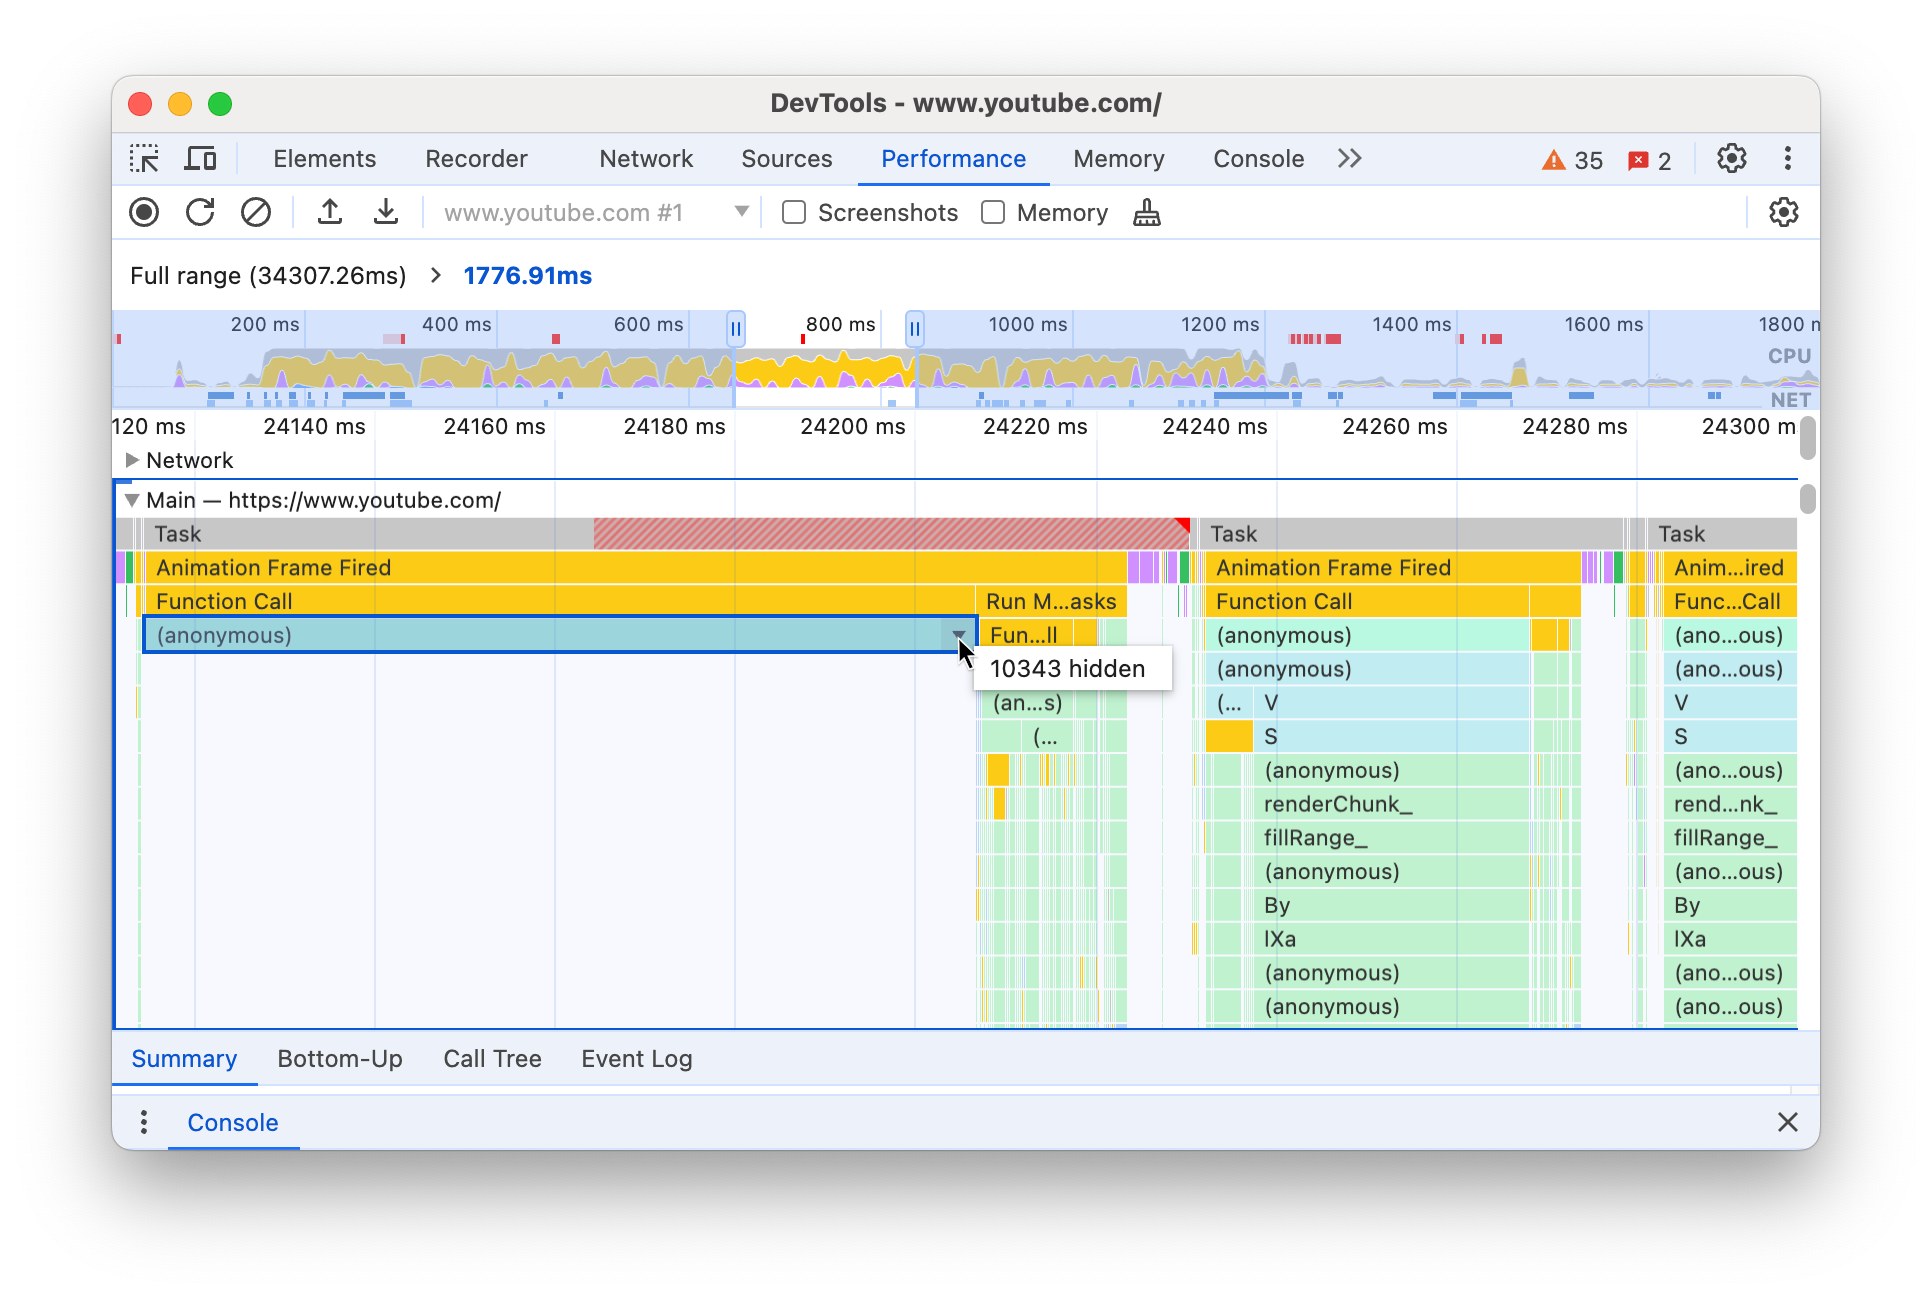
Er verschijnt een vervolgkeuzeknop naast de functienaam met verborgen onderliggende items.
- Verberg functie (
Om het aantal verborgen kinderen te zien, beweegt u de muis over de vervolgkeuzeknop .
Om een functie met verborgen onderliggende elementen of de gehele vlamgrafiek te resetten, selecteert u de functie en drukt u op
Uof klikt u met de rechtermuisknop op een functie en selecteert u Trace resetten .
Negeer scripts in de vlamgrafiek
Om een script aan de negeerlijst toe te voegen, klikt u met de rechtermuisknop op een script in de grafiek en selecteert u Script toevoegen aan negeerlijst .
De grafiek vouwt genegeerde scripts samen, markeert ze als 'Op negeerlijst' en voegt ze toe aan de aangepaste uitsluitingsregels in > Negeerlijst . Genegeerde scripts worden bewaard totdat u ze uit de trace of uit de aangepaste uitsluitingsregels verwijdert.
Activiteiten in een tabel bekijken
Nadat u een pagina hebt opgenomen, hoeft u niet langer uitsluitend op het hoofdspoor te vertrouwen om activiteiten te analyseren. DevTools biedt ook drie tabelweergaven voor het analyseren van activiteiten. Elke weergave geeft u een ander perspectief op de activiteiten:
- Wanneer u de hoofdactiviteiten wilt bekijken die het meeste werk veroorzaken, gebruikt u het tabblad Aanroepboom .
- Als u de activiteiten wilt bekijken waaraan direct de meeste tijd is besteed, gebruikt u het tabblad Bottom-up .
- Als u de activiteiten wilt bekijken in de volgorde waarin ze tijdens de opname hebben plaatsgevonden, gebruikt u het tabblad Gebeurtenislogboek .
U kunt op een item in een van de drie tabellen klikken (en in de tabel '1e/3e partij' op het tabblad ' Samenvatting ') om de bijbehorende gebeurtenissen gemarkeerd te houden in de tracering en de rest te dimmen terwijl u door de prestatietracering bladert.
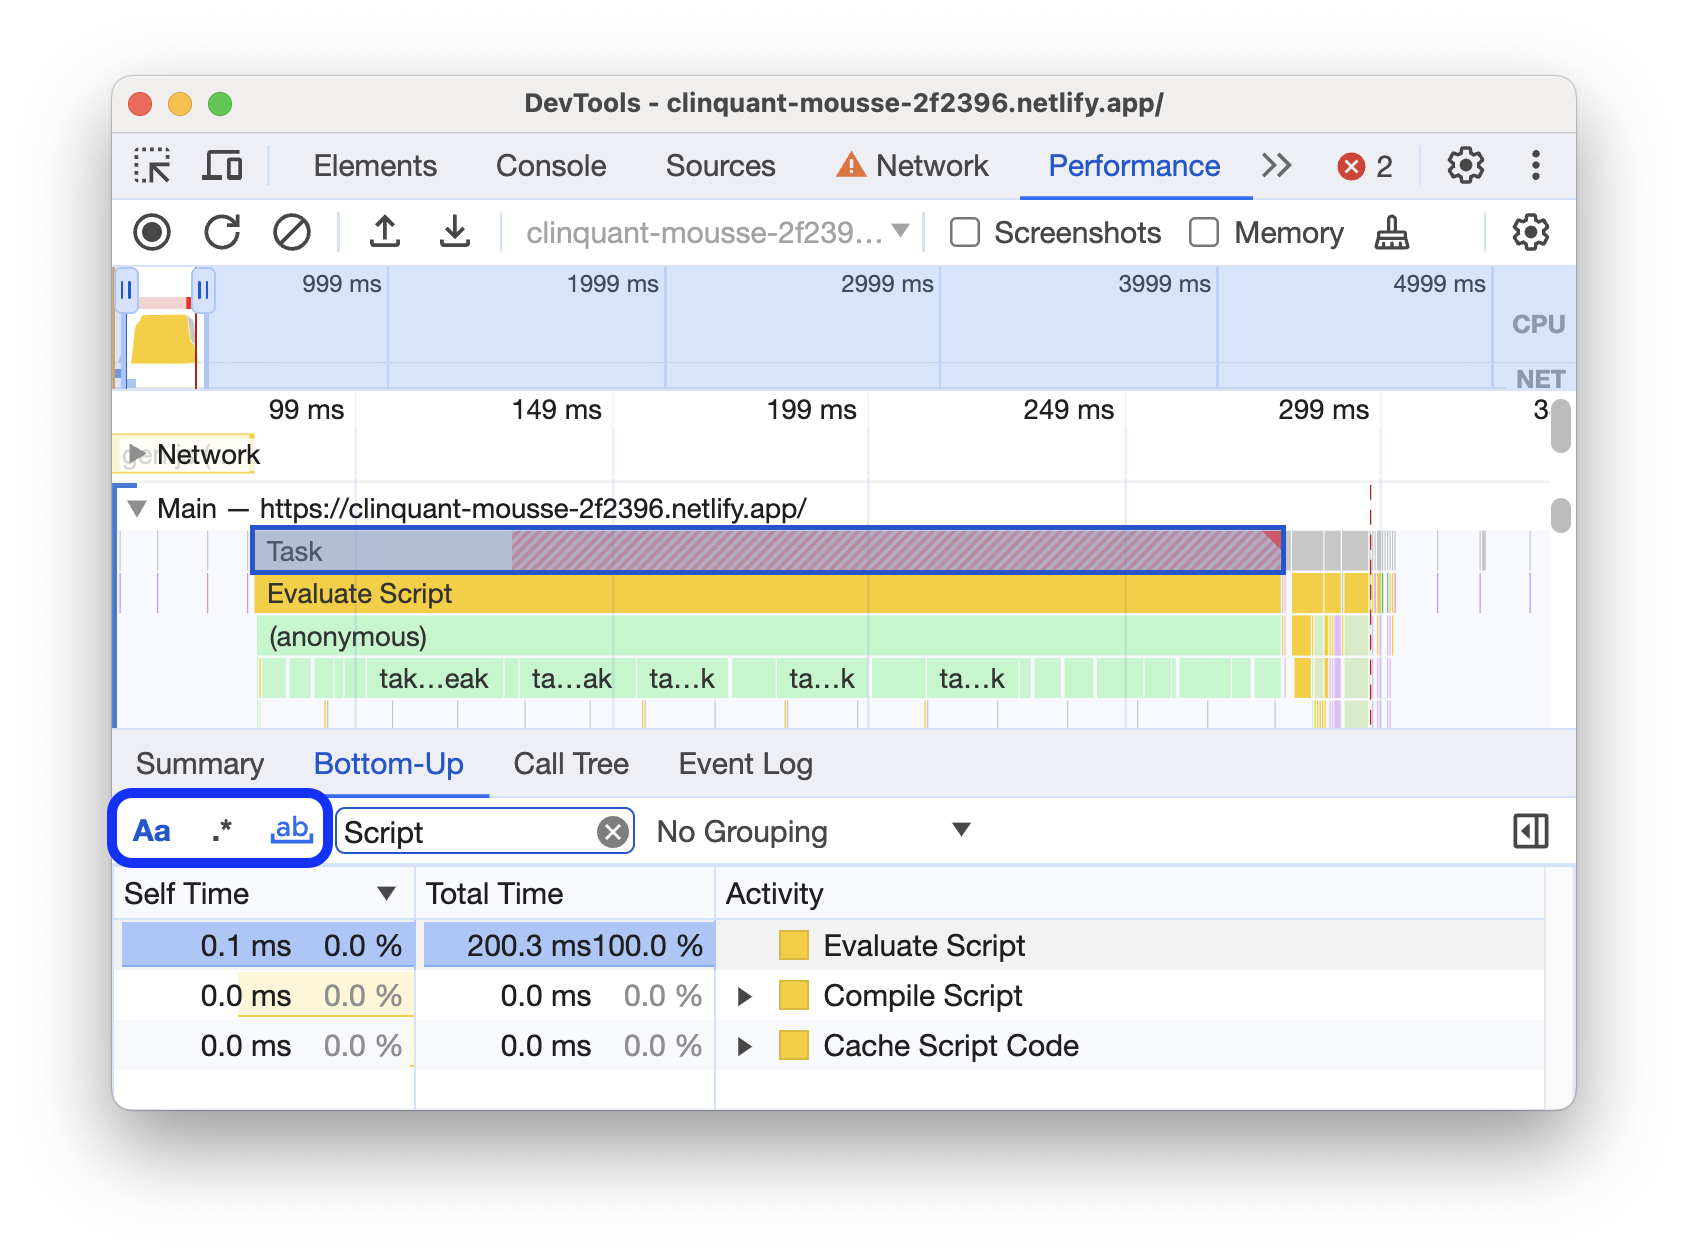
Om u te helpen sneller te vinden wat u zoekt, bevinden zich op alle drie de tabbladen knoppen voor geavanceerd filteren naast de filterbalk :
- Overeenkomende case .
- Reguliere expressie .
- Match het hele woord .
Elke tabelweergave in het paneel Prestaties bevat koppelingen naar activiteiten zoals functieaanroepen. Om u te helpen bij het debuggen, vindt DevTools de bijbehorende functiedeclaraties in bronbestanden. Als de juiste bronmaps aanwezig en ingeschakeld zijn, vindt DevTools bovendien automatisch de originele bestanden.
Klik op een koppeling om een bronbestand te openen in het paneel Bronnen .
Root-activiteiten
Hier volgt een uitleg van het concept van root-activiteiten dat wordt genoemd in de secties Oproepstructuur , Bottom-up en Gebeurtenislogboek .
Rootactiviteiten zijn activiteiten die de browser aanzetten tot het uitvoeren van een taak. Wanneer u bijvoorbeeld op een pagina klikt, activeert de browser een Event als rootactiviteit. Die Event kan er vervolgens voor zorgen dat een handler wordt uitgevoerd.
In de vlamgrafiek van het hoofdspoor staan rootactiviteiten bovenaan. Op de tabbladen Call Tree en Event Log zijn rootactiviteiten de items op het hoogste niveau.
Zie het tabblad Oproepboom voor een voorbeeld van rootactiviteiten.
Het tabblad Oproepboom
Gebruik het tabblad Oproepboom om te zien welke hoofdactiviteiten het meeste werk veroorzaken.
Het tabblad Oproepboom toont alleen activiteiten tijdens het geselecteerde deel van de opname. Zie Een deel van een opname selecteren voor meer informatie over het selecteren van delen.
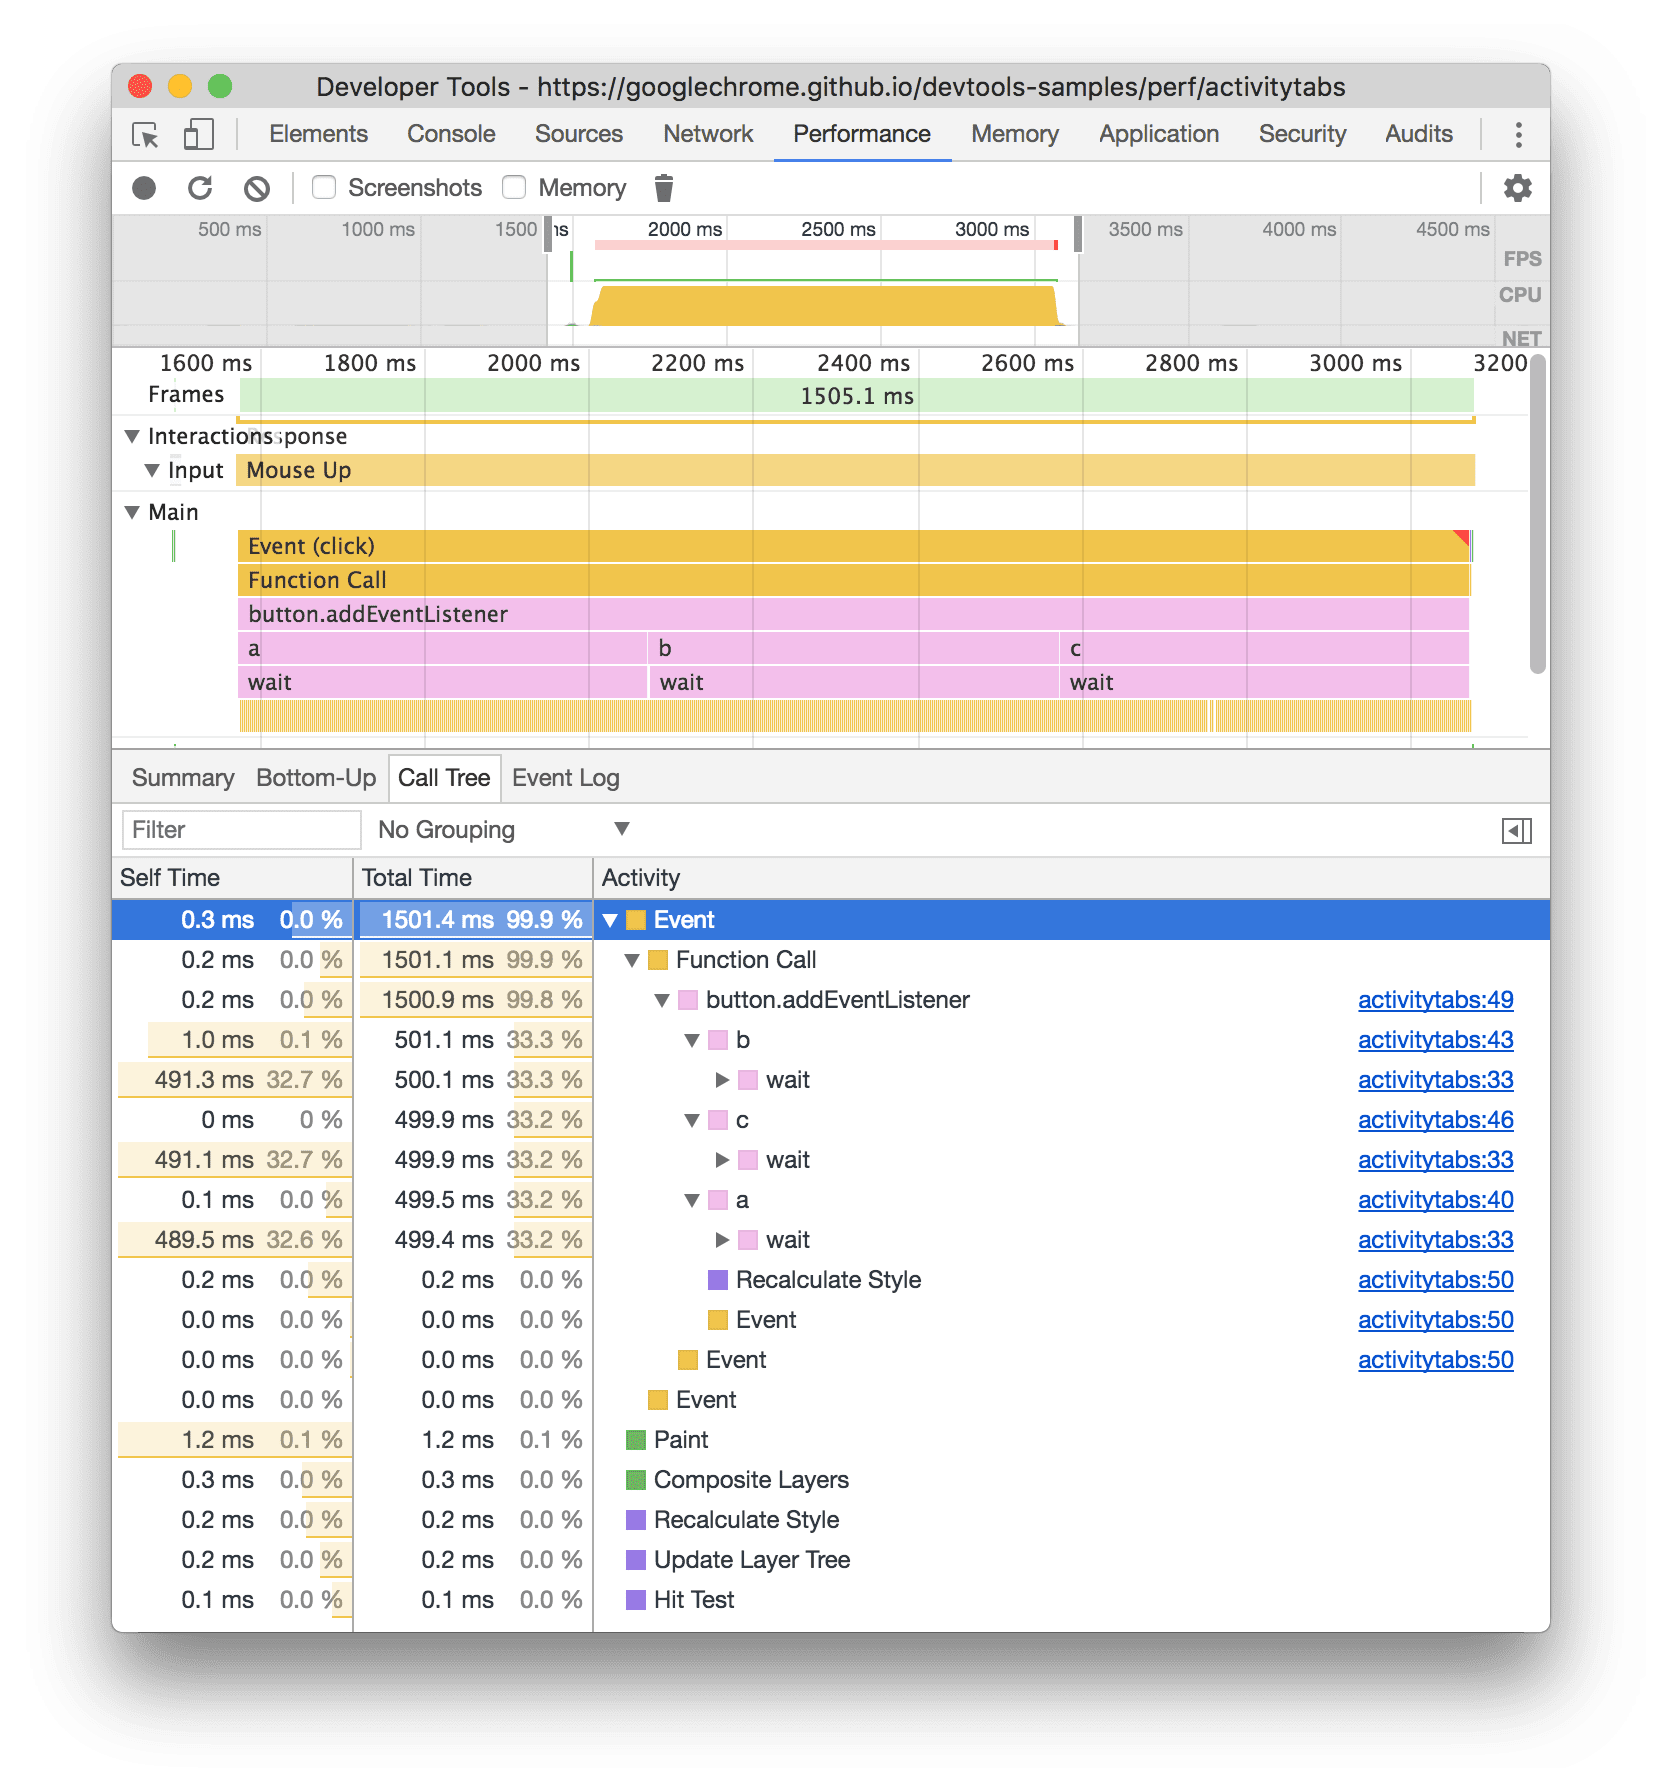
In dit voorbeeld zijn de items op het hoogste niveau in de kolom Activiteit , zoals Event , Paint en Composite Layers , rootactiviteiten. De nesting vertegenwoordigt de call stack. In dit voorbeeld veroorzaakte de Event de Function Call , die op zijn beurt button.addEventListener veroorzaakte, die op zijn beurt b veroorzaakte, enzovoort.
Eigen tijd vertegenwoordigt de tijd die direct aan die activiteit is besteed. Totale tijd vertegenwoordigt de tijd die aan die activiteit of een van de onderliggende activiteiten is besteed.
Klik op Zelftijd , Totale tijd of Activiteit om de tabel op die kolom te sorteren.
Gebruik het filtervak om gebeurtenissen te filteren op activiteitsnaam.
Standaard staat het menu Groepering ingesteld op Geen groepering . Gebruik het menu Groepering om de activiteitentabel te sorteren op basis van verschillende criteria.
Het tabblad Bottom-up
Via het tabblad Bottom-up kunt u zien welke activiteiten in totaal het meeste tijd in beslag namen.
Het tabblad Bottom-up toont alleen activiteiten tijdens het geselecteerde deel van de opname. Zie Een deel van een opname selecteren voor meer informatie over het selecteren van delen.
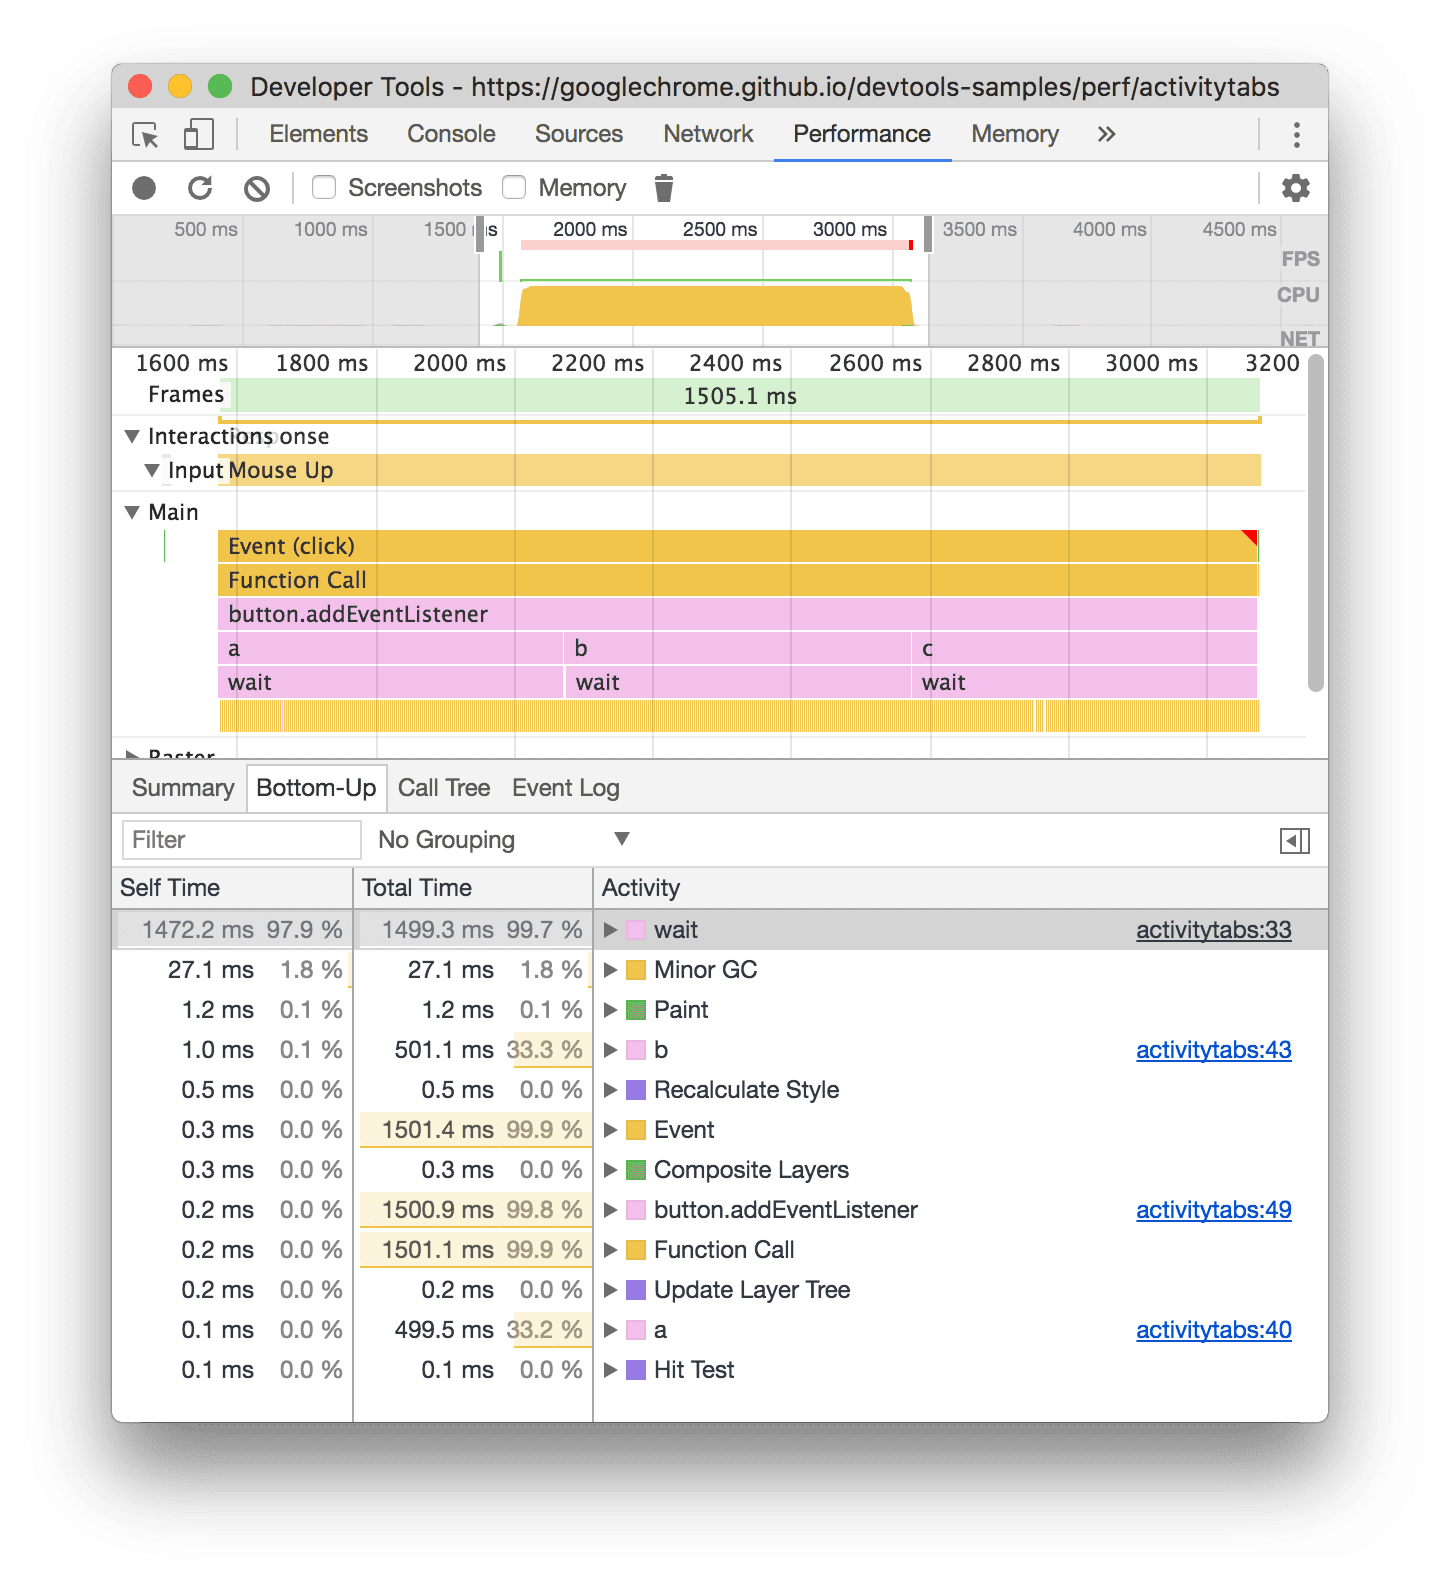
In de 'Flame'-grafiek van het hoofdspoor van dit voorbeeld ziet u dat bijna alle tijd is besteed aan het uitvoeren van de drie aanroepen van wait() . De hoogste activiteit op het tabblad 'Bottom-up' is dus wait . In de 'Flame'-grafiek zijn de gele velden onder de aanroepen van wait in feite duizenden Minor GC aanroepen. U ziet dus dat de op één na duurste activiteit op het tabblad 'Bottom-up Minor GC is.
De kolom Eigen tijd geeft de totale tijd weer die rechtstreeks aan die activiteit is besteed, voor alle keren dat die activiteit heeft plaatsgevonden.
De kolom Totale tijd geeft de totale tijd weer die aan die activiteit of aan een van de onderliggende activiteiten is besteed.
Zwaarste stapeltafel
Klik aan de rechterkant van de Aanroepboom of het tabblad Bottom-up op Toon zwaarste stapel om de tabel Zwaarste stapel weer te geven.
Deze tabel laat zien welke onderliggende activiteiten van de geselecteerde activiteit het langst duurden. Beweeg de muis over een item in de tabel om de bijbehorende gebeurtenis gemarkeerd te zien in het hoofdspoor en de rest grijs.
Op deze manier kunt u in de prestatietracering visueel de geneste activiteiten uit de aanroepstack vinden die het meeste tijd kosten.
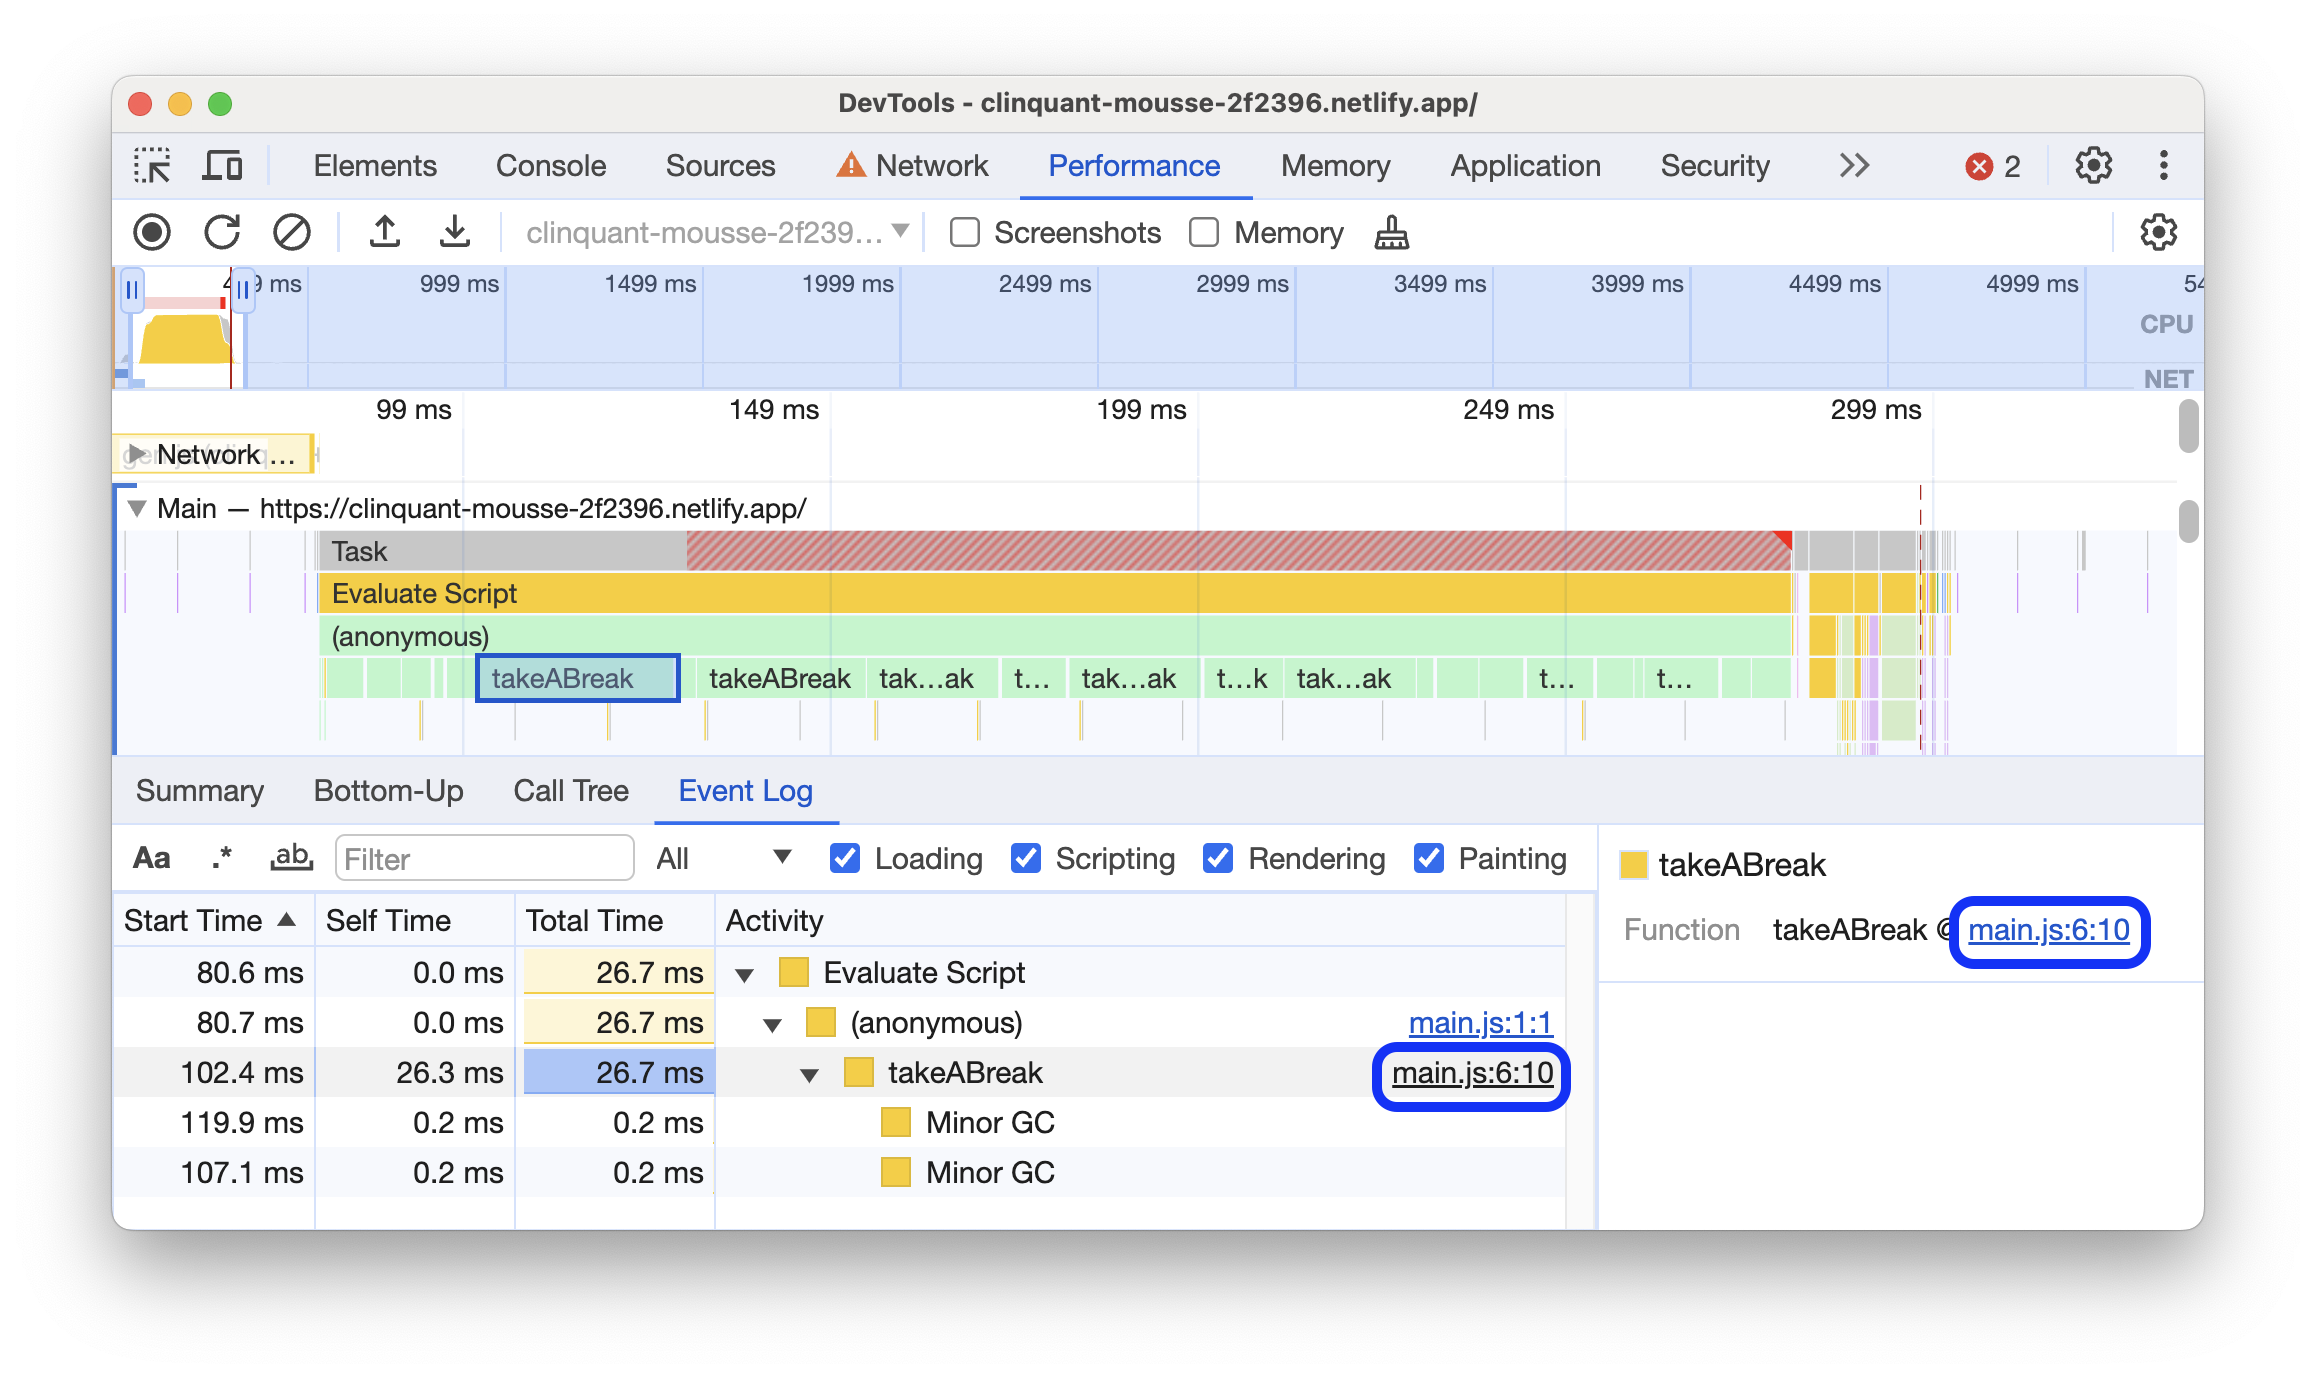
Het tabblad Gebeurtenislogboek
Via het tabblad Gebeurtenislogboek kunt u activiteiten bekijken in de volgorde waarin ze tijdens de opname hebben plaatsgevonden.
Het tabblad Gebeurtenislogboek geeft alleen activiteiten weer tijdens het geselecteerde deel van de opname. Zie Een deel van een opname selecteren voor meer informatie over het selecteren van delen.
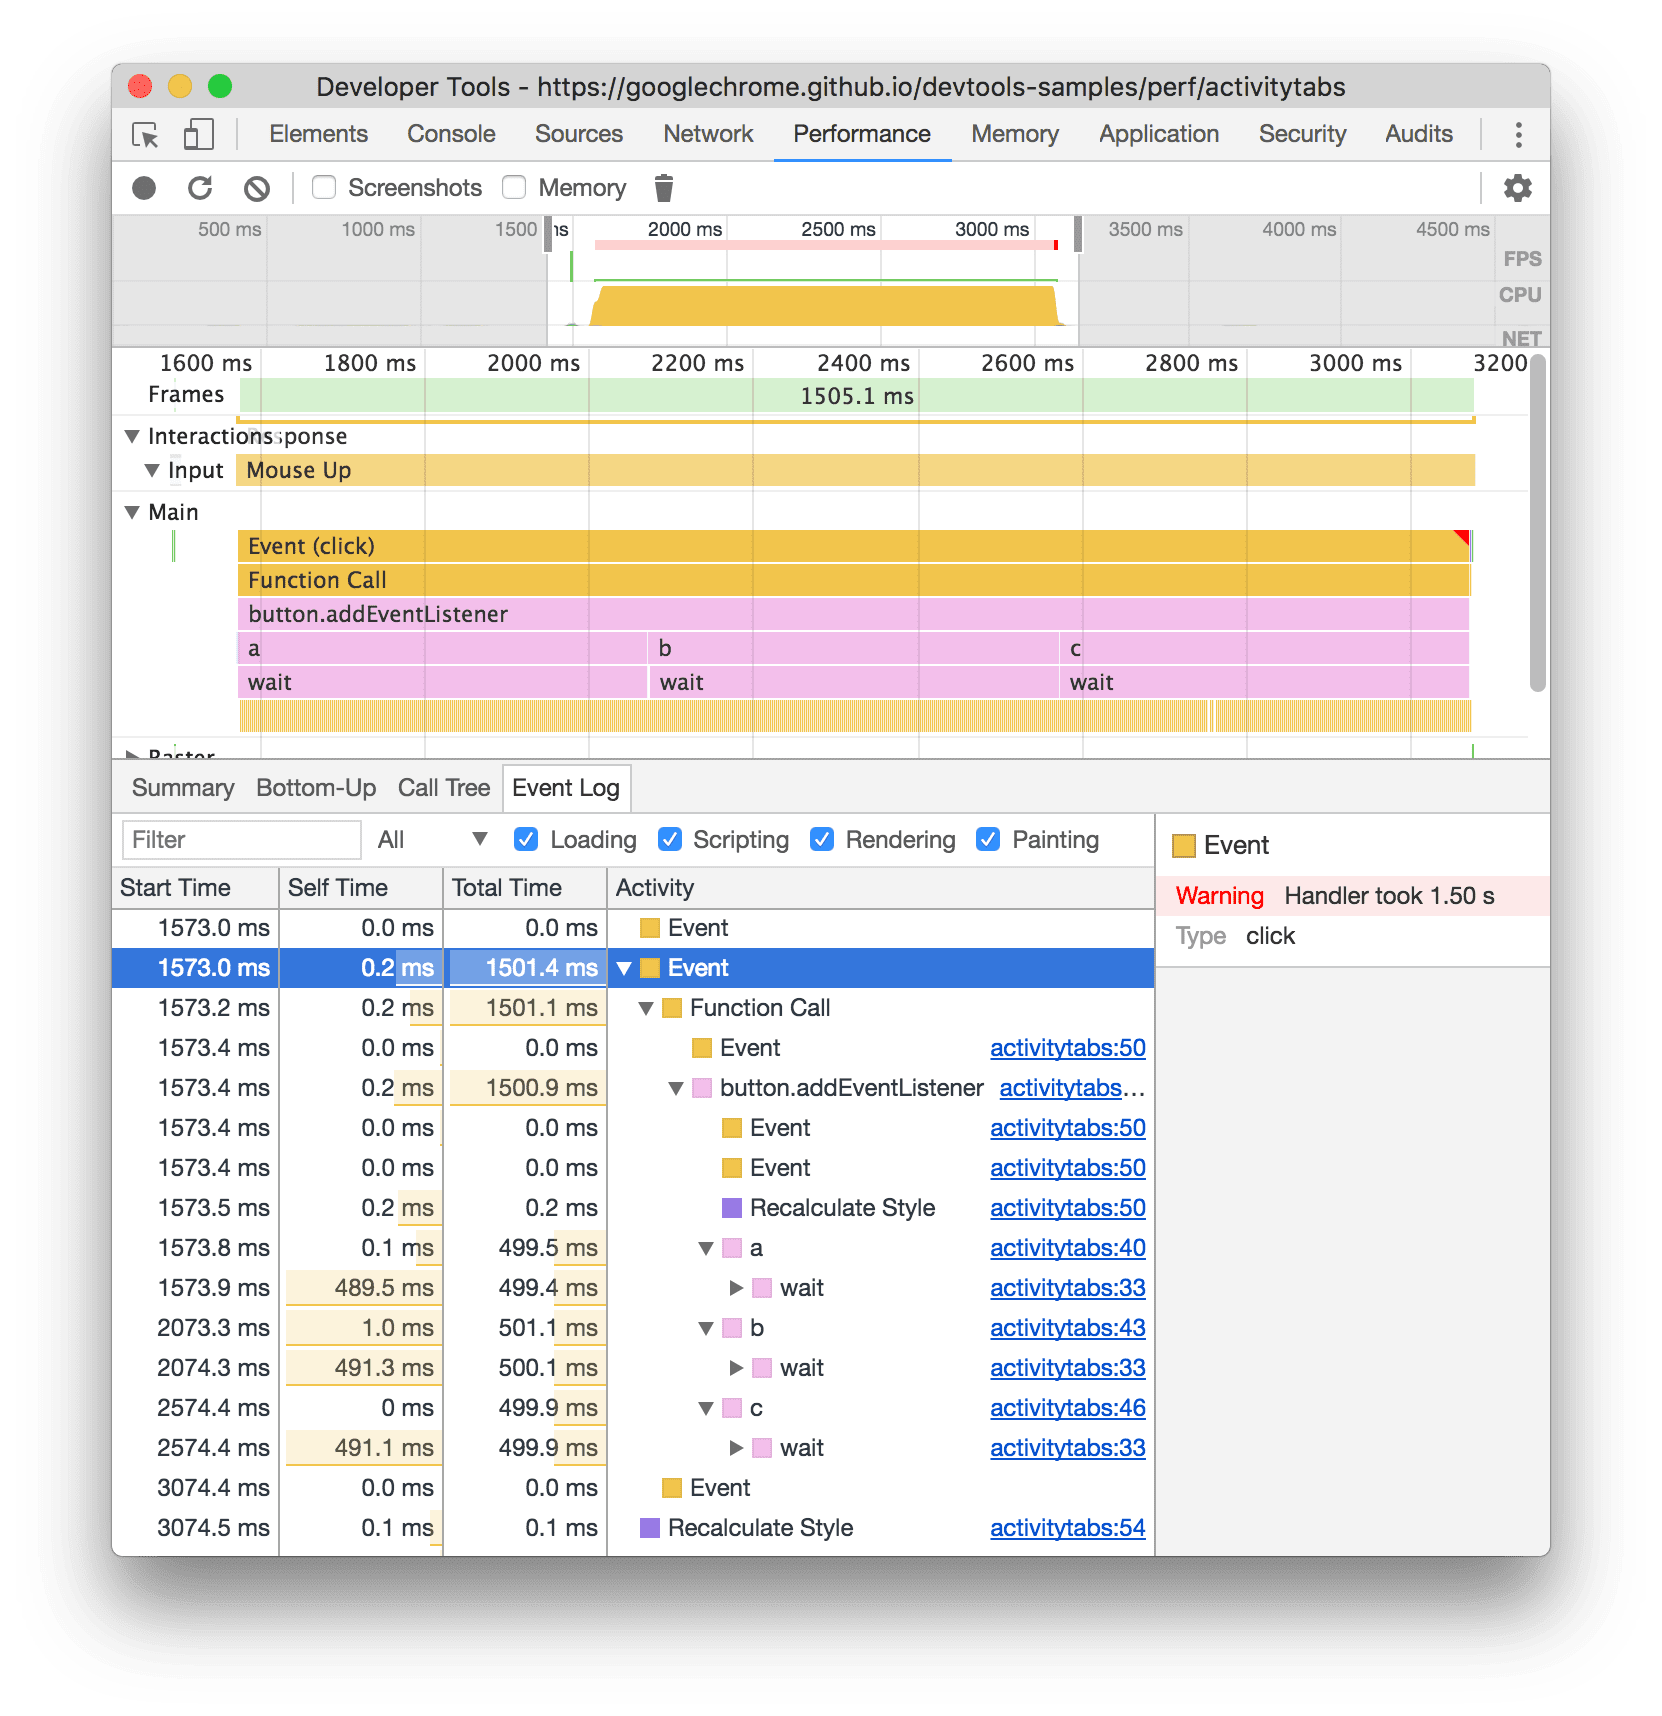
De kolom Starttijd geeft het punt weer waarop die activiteit is gestart, ten opzichte van het begin van de opname. De starttijd van 1573.0 ms voor het geselecteerde item in dit voorbeeld betekent dat de activiteit 1573 ms na het begin van de opname is gestart.
De kolom Zelftijd geeft de tijd weer die rechtstreeks aan die activiteit is besteed.
De kolom Totale tijd geeft de tijd weer die direct aan de betreffende activiteit of aan een van de onderliggende activiteiten is besteed.
Klik op Starttijd , Eigen tijd of Totale tijd om de tabel op die kolom te sorteren.
Gebruik het filtervak om activiteiten op naam te filteren.
Gebruik het menu Duur om activiteiten te filteren die korter dan 1 ms of 15 ms duurden. Standaard staat het menu Duur ingesteld op Alles , wat betekent dat alle activiteiten worden weergegeven.
Schakel de selectievakjes Laden , Scripting , Rendering of Schilderen uit om alle activiteiten uit die categorieën te filteren.
Prestatiemarkeringen bekijken
In een overlay met verticale lijnen over de prestatietracering kunt u belangrijke prestatiemarkeringen zien, zoals:
- Eerste Contentful Paint (FCP)
- Grootste Contentful Paint (LCP)
- DOMContentLoaded-gebeurtenis (DCL)
- Onload-gebeurtenis (L)

Beweeg de muis over de markernamen onderaan het trace om hun tijdstempel te bekijken.
Bekijk aangepaste timings
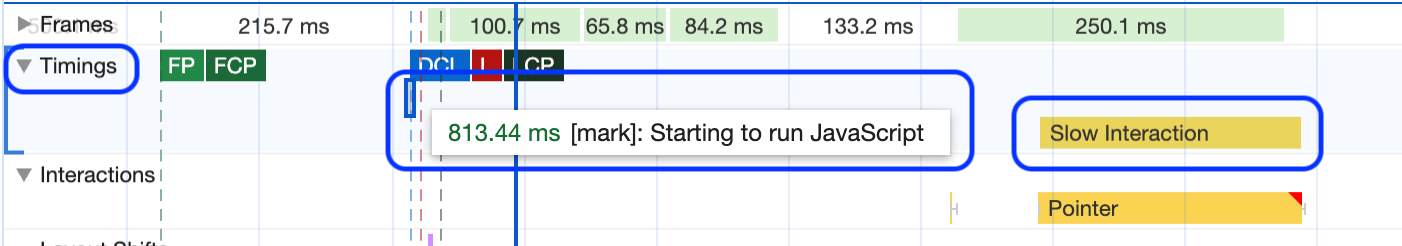
Bekijk op het Timings -spoor uw aangepaste prestatiemarkeringen, zoals:
-
performance.mark()-aanroepen. Hieronder wordt een individuele markering met tooltip weergegeven met een tijd van 813,44 ms, gemarkeerd met Starting to run JavaScript . -
performance.measure()-aanroepen. Hieronder ziet u een gele span, gemarkeerd met Slow Interaction .
Selecteer een marker om meer details te bekijken op het tabblad Samenvatting , inclusief de tijdstempel, totale tijd, eigen tijd en het detail . Voor performance.mark() en performance.measure() aanroepen toont het tabblad ook stacktraces.
Interacties bekijken
Bekijk gebruikersinteracties op het spoor Interacties om mogelijke problemen met de responsiviteit op te sporen.
Om interacties te bekijken:
- Open DevTools bijvoorbeeld op deze demopagina .
- Open het paneel Prestaties en start een opname .
- Klik op een element (koffie) en stop de opname.
- Zoek het Interacties -spoor in de tijdlijn.
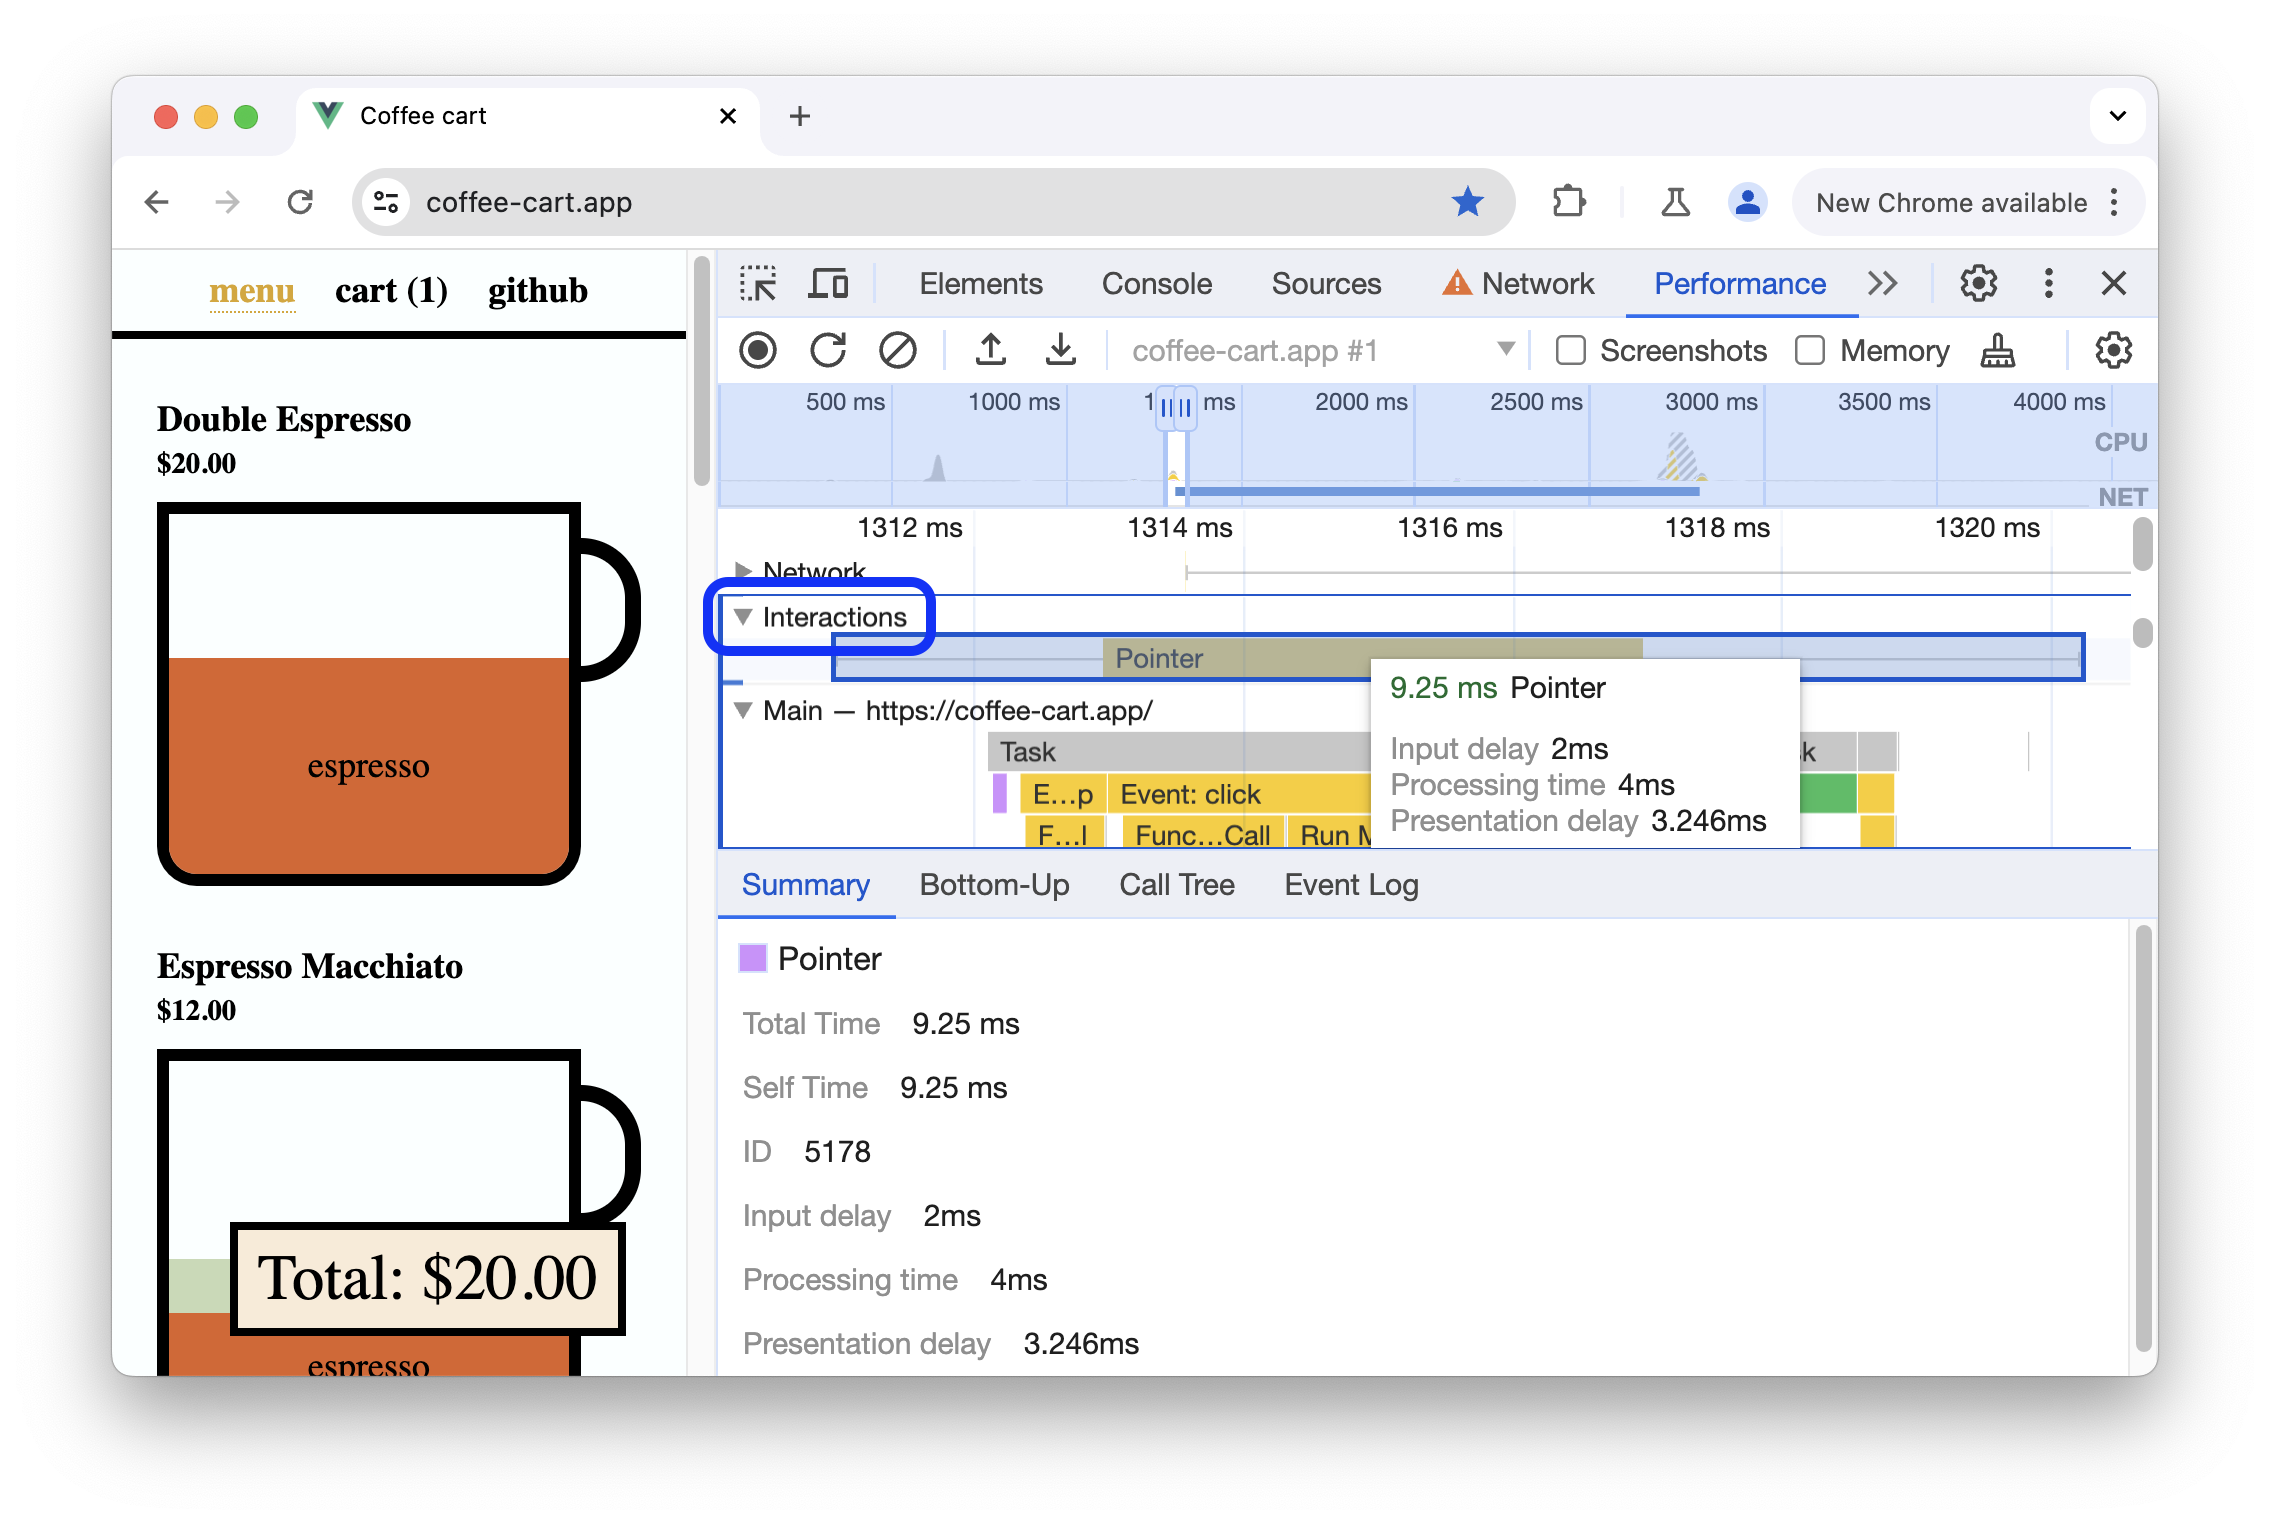
In dit voorbeeld toont het Interactiespoor de Pointer- interactie. Interacties hebben snorharen die invoer- en presentatievertragingen aangeven bij verwerkingstijdgrenzen. Beweeg de muis over de interactie om een tooltip te zien met invoervertraging, verwerkingstijd en presentatievertraging.
In het Interactiespoor worden ook Interactie naar Volgende Verf (INP) -waarschuwingen weergegeven voor interacties die langer duren dan 200 milliseconden, op het tabblad Samenvatting en in een tooltip bij het zweven:
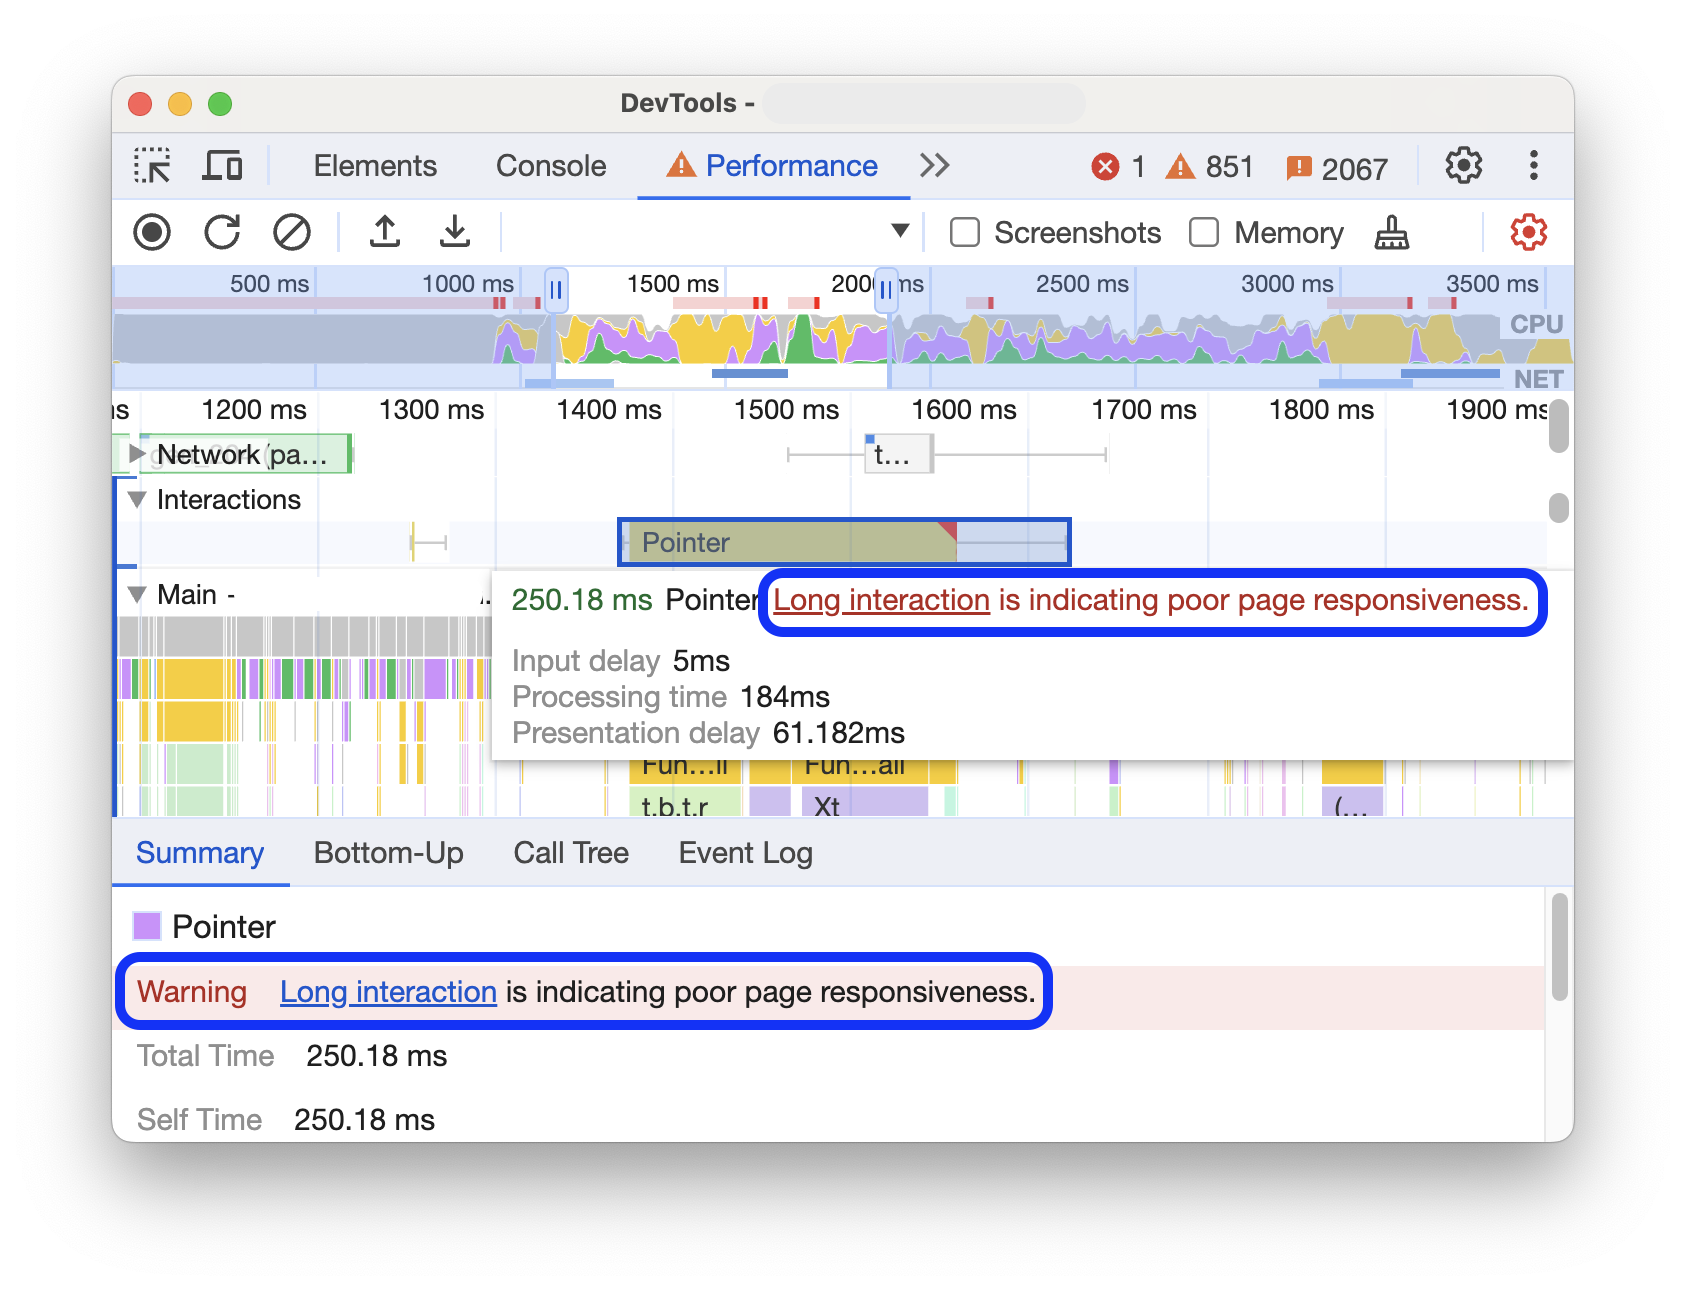
Het Interactiespoor markeert de interacties van 200 milliseconden met een rode driehoek in de rechterbovenhoek.
Weergave lay-outverschuivingen
Bekijk lay-outverschuivingen op het spoor Lay-outverschuivingen . Verschuivingen worden weergegeven als paarse ruiten en zijn gegroepeerd in clusters (paarse lijnen) op basis van hun nabijheid op de tijdlijn.
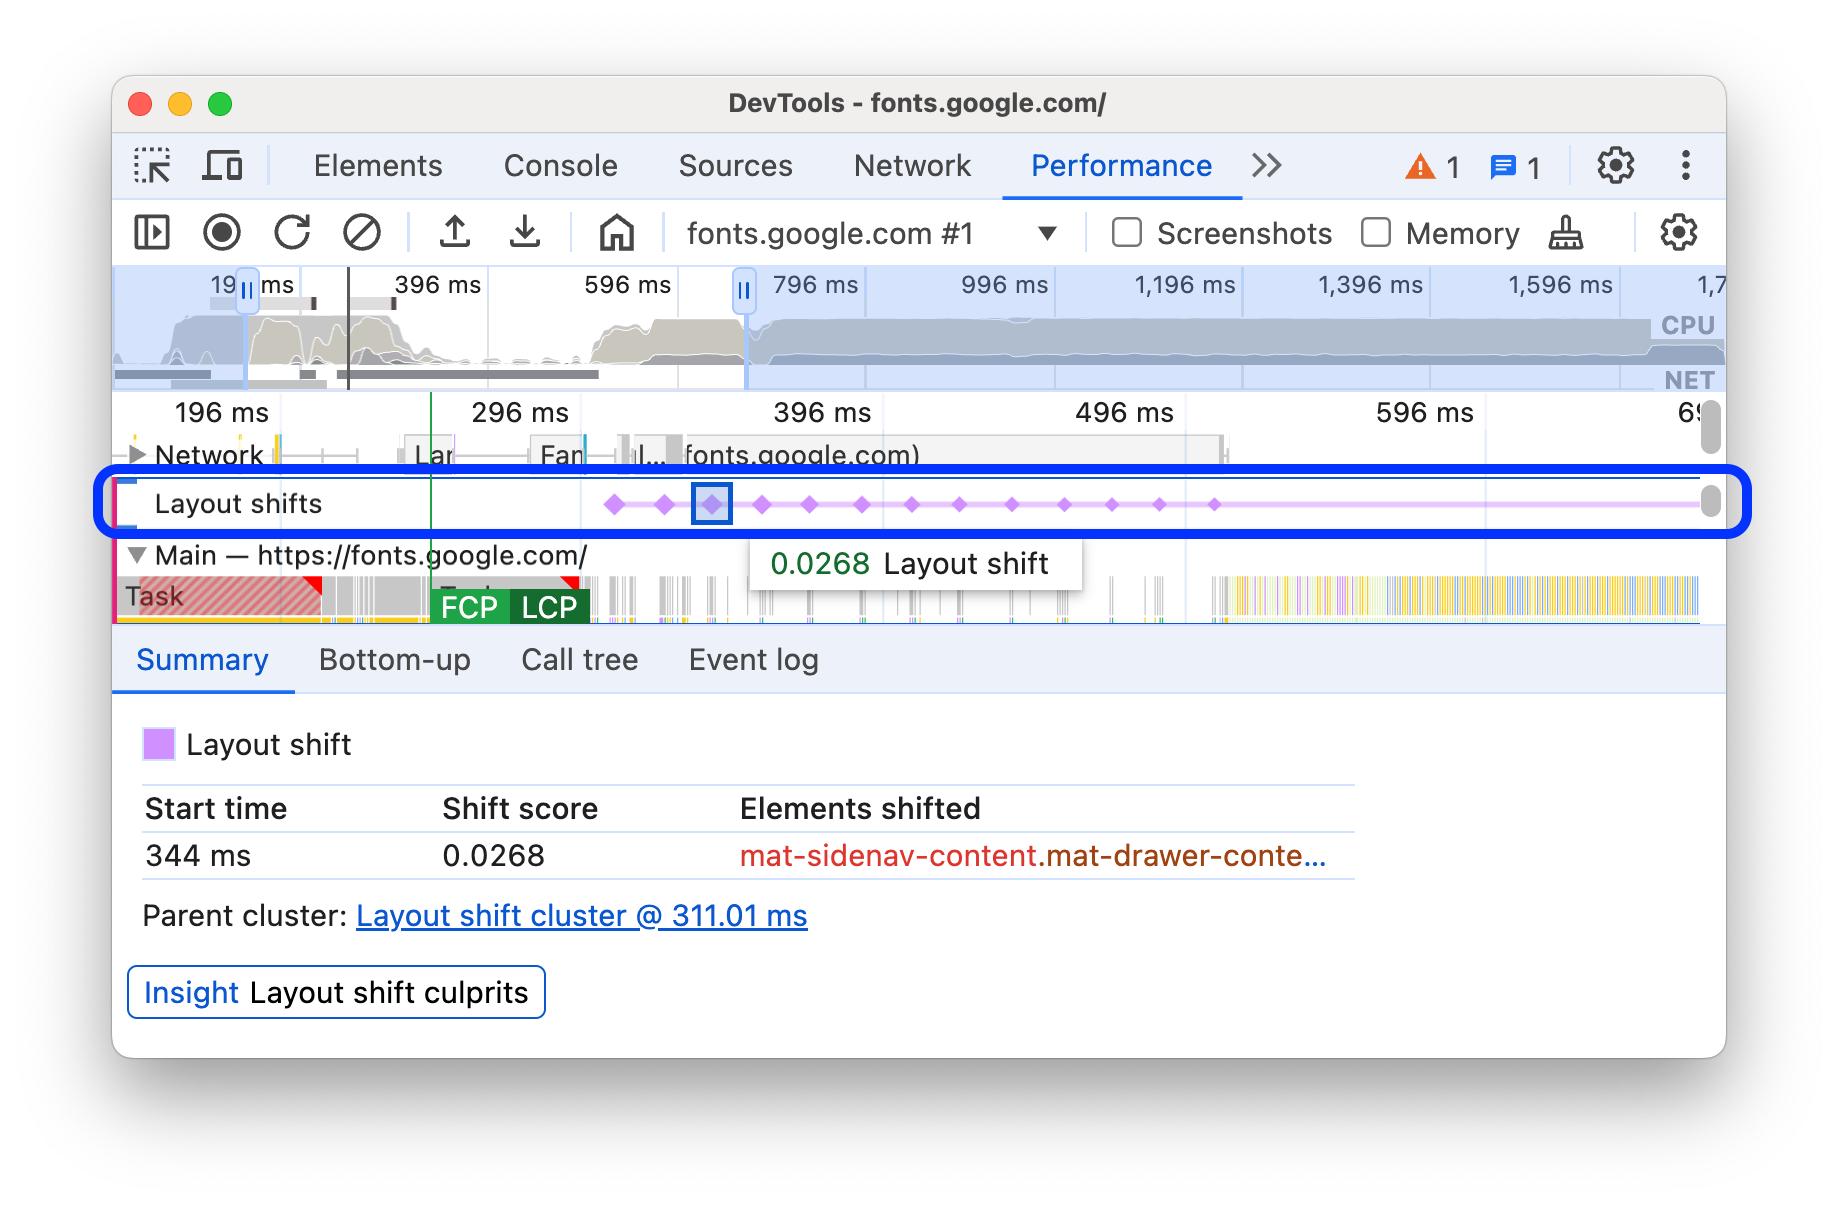
Om een element te markeren dat een lay-outverschuiving in het venster veroorzaakt, beweegt u de muisaanwijzer over de bijbehorende ruit.
Voor meer informatie over een of meer lay-outverschuivingen in het tabblad Samenvatting met timing, scores, elementen en mogelijke oorzaken, klikt u op de overeenkomstige ruit of cluster.
Zie Cumulatieve lay-outverschuiving (CLS) voor meer informatie.
Bekijk animaties
Bekijk animaties op het Animaties- spoor. Animaties worden benoemd met bijbehorende CSS-eigenschappen of elementen, indien aanwezig, bijvoorbeeld transform of my-element . Niet-samengestelde animaties worden gemarkeerd met rode driehoeken in de rechterbovenhoek.
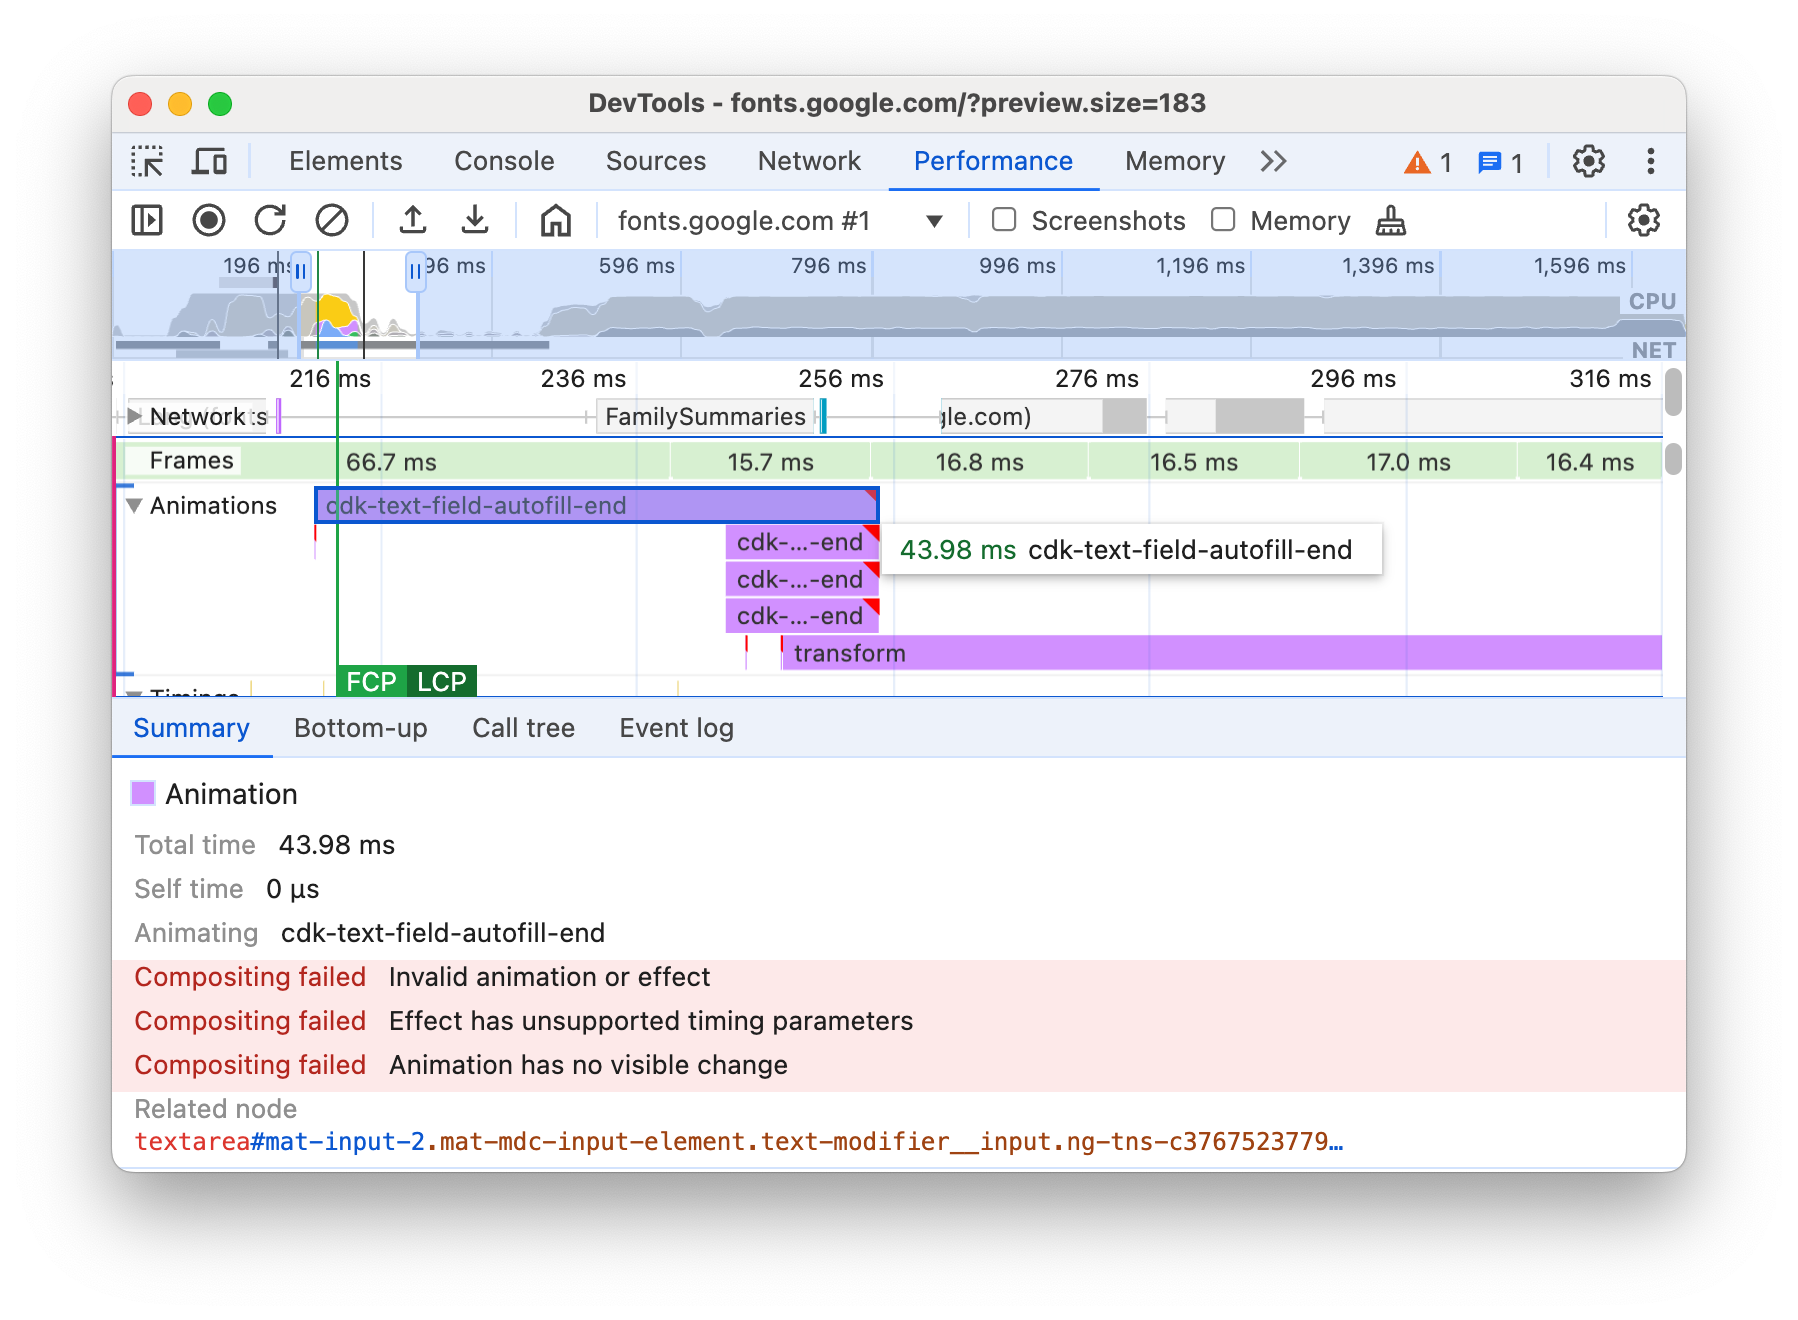
Selecteer een animatie om meer details te bekijken op het tabblad Samenvatting , inclusief redenen voor mislukte composities.
GPU-activiteit bekijken
Bekijk GPU-activiteit in het GPU- gedeelte.

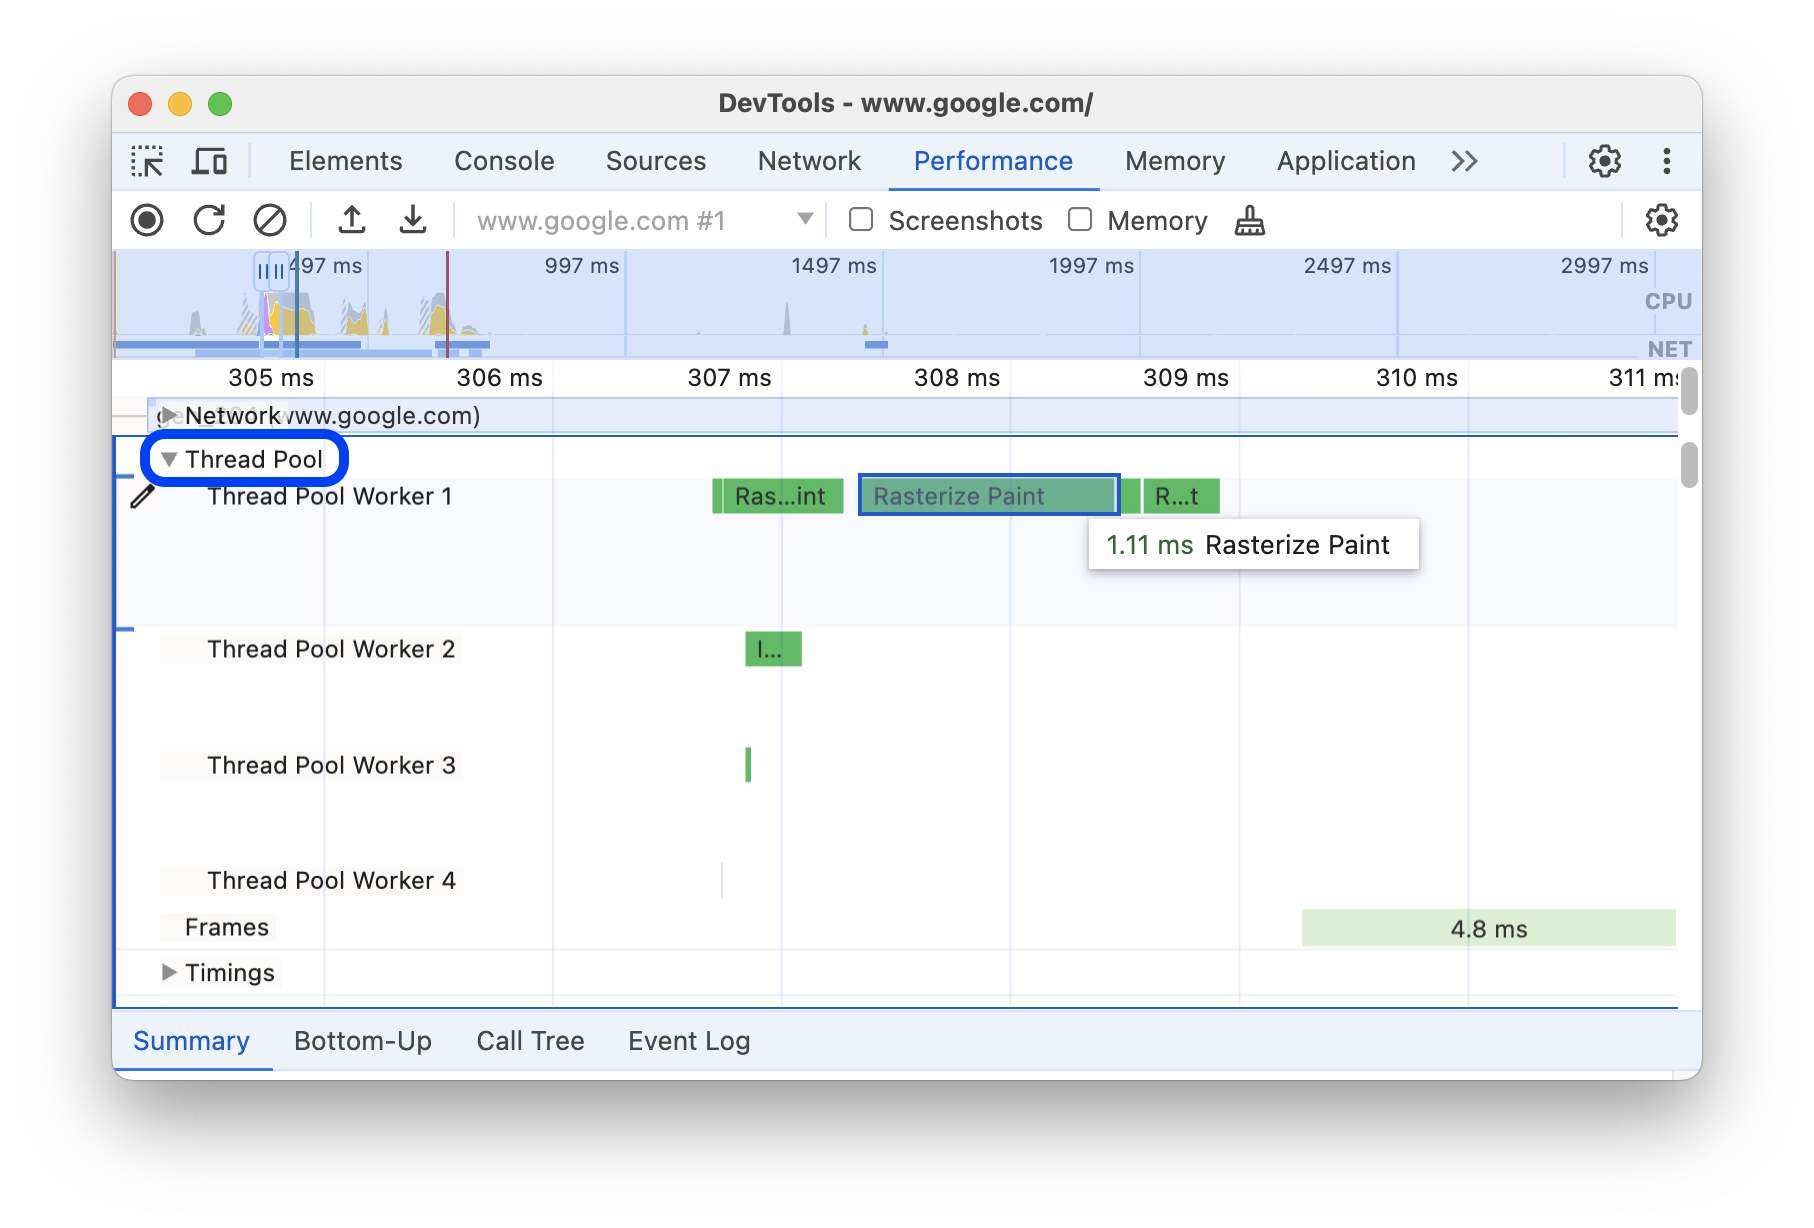
Rasteractiviteit bekijken
Bekijk rasteractiviteit in het gedeelte Thread Pool .
Frames per seconde (FPS) analyseren
DevTools biedt talloze manieren om frames per seconde te analyseren:
- In het gedeelte Frames kunt u zien hoe lang een bepaald frame duurde.
- Gebruik de FPS-meter voor een realtime schatting van de FPS terwijl de pagina wordt afgespeeld. Zie Bekijk frames per seconde in realtime met de FPS-meter .
Het gedeelte Frames
In het gedeelte Frames kunt u precies zien hoe lang een bepaald frame duurde.
Beweeg de muis over een frame om een tooltip met meer informatie erover te bekijken.
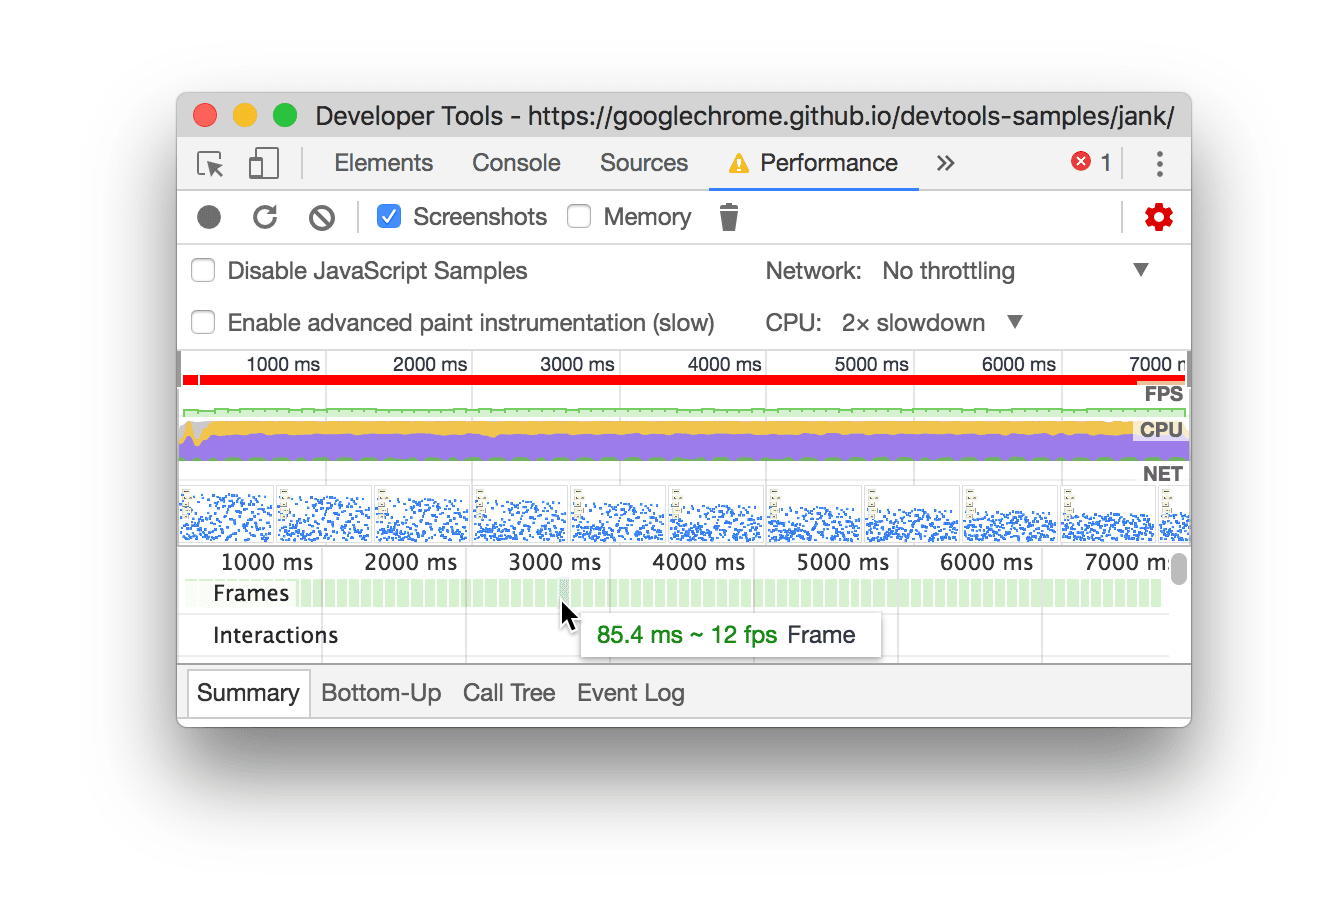
In dit voorbeeld ziet u een tooltip wanneer u de muisaanwijzer over een frame beweegt.
In het gedeelte Frames worden vier typen frames weergegeven:
- Inactief frame (wit) . Geen wijzigingen.
- Kader (groen) . Zoals verwacht en op tijd weergegeven.
- Gedeeltelijk weergegeven frame (geel met een dun, breed streepjespatroon) . Chrome heeft zijn best gedaan om op zijn minst enkele visuele updates op tijd te renderen. Bijvoorbeeld in het geval dat de hoofdthread van het renderproces (canvasanimatie) vertraging oploopt, maar de compositorthread (scrollen) op tijd.
- Frame verwijderd (rood met een dicht, ononderbroken lijnenpatroon) . Chrome kan het frame niet binnen een redelijke tijd weergeven.
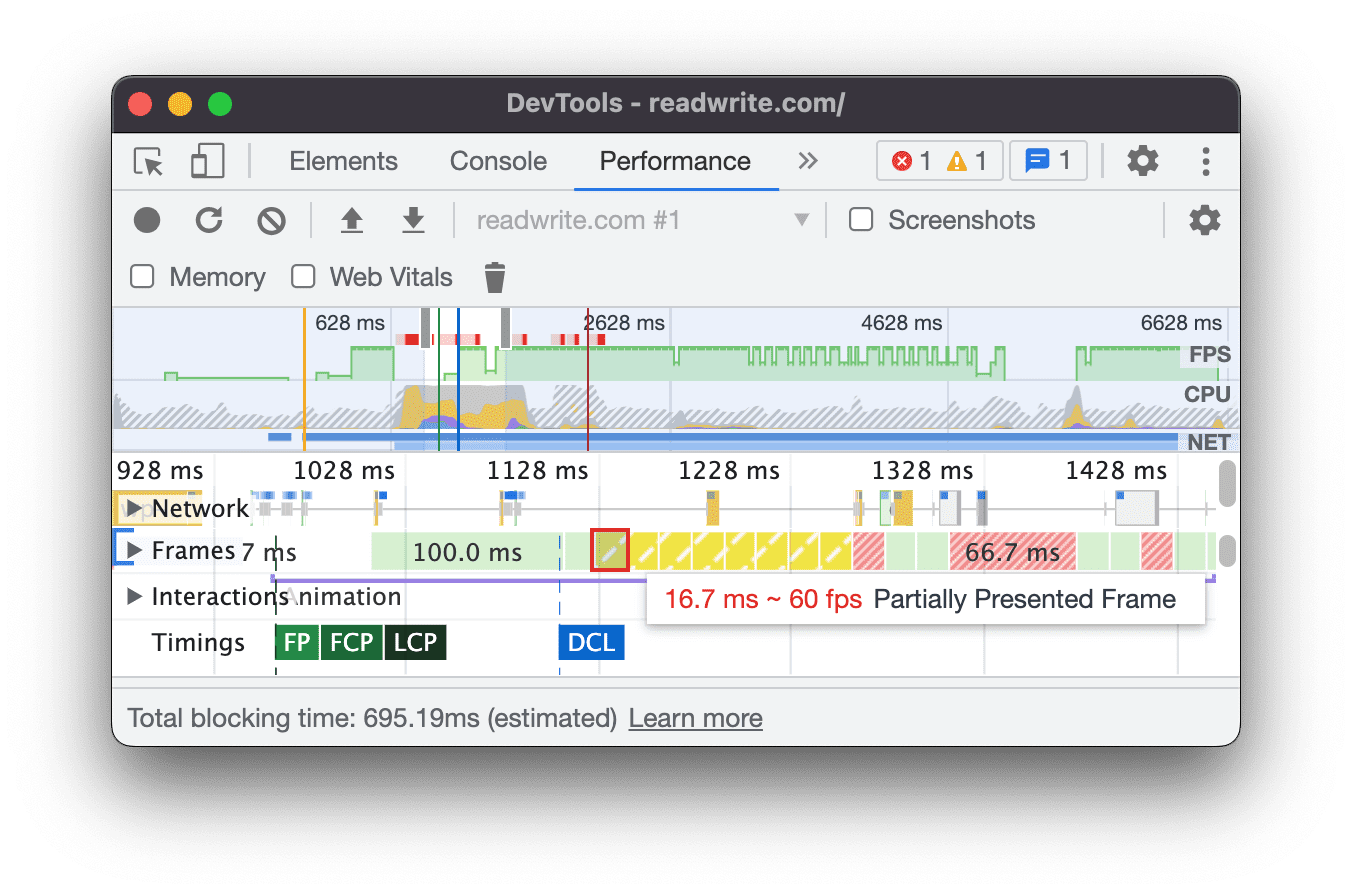
In dit voorbeeld ziet u een tooltip wanneer u de muisaanwijzer op een gedeeltelijk weergegeven frame plaatst.
Klik op een frame om meer informatie over het frame te bekijken op het tabblad Samenvatting . DevTools geeft het geselecteerde frame een blauwe rand.
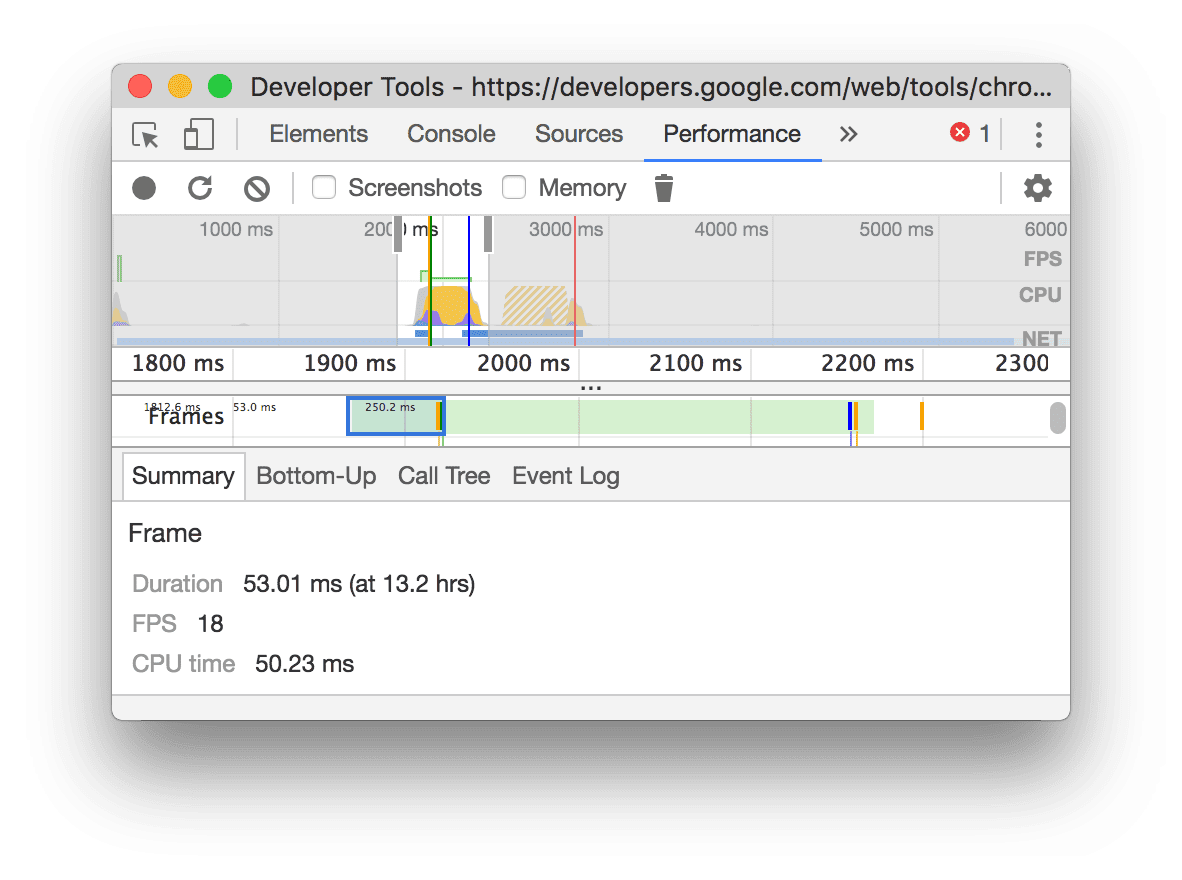
Bekijk netwerkverzoeken
Vouw het gedeelte Netwerk uit om een overzicht te bekijken van de netwerkaanvragen die tijdens de uitvoeringsopname zijn opgetreden.
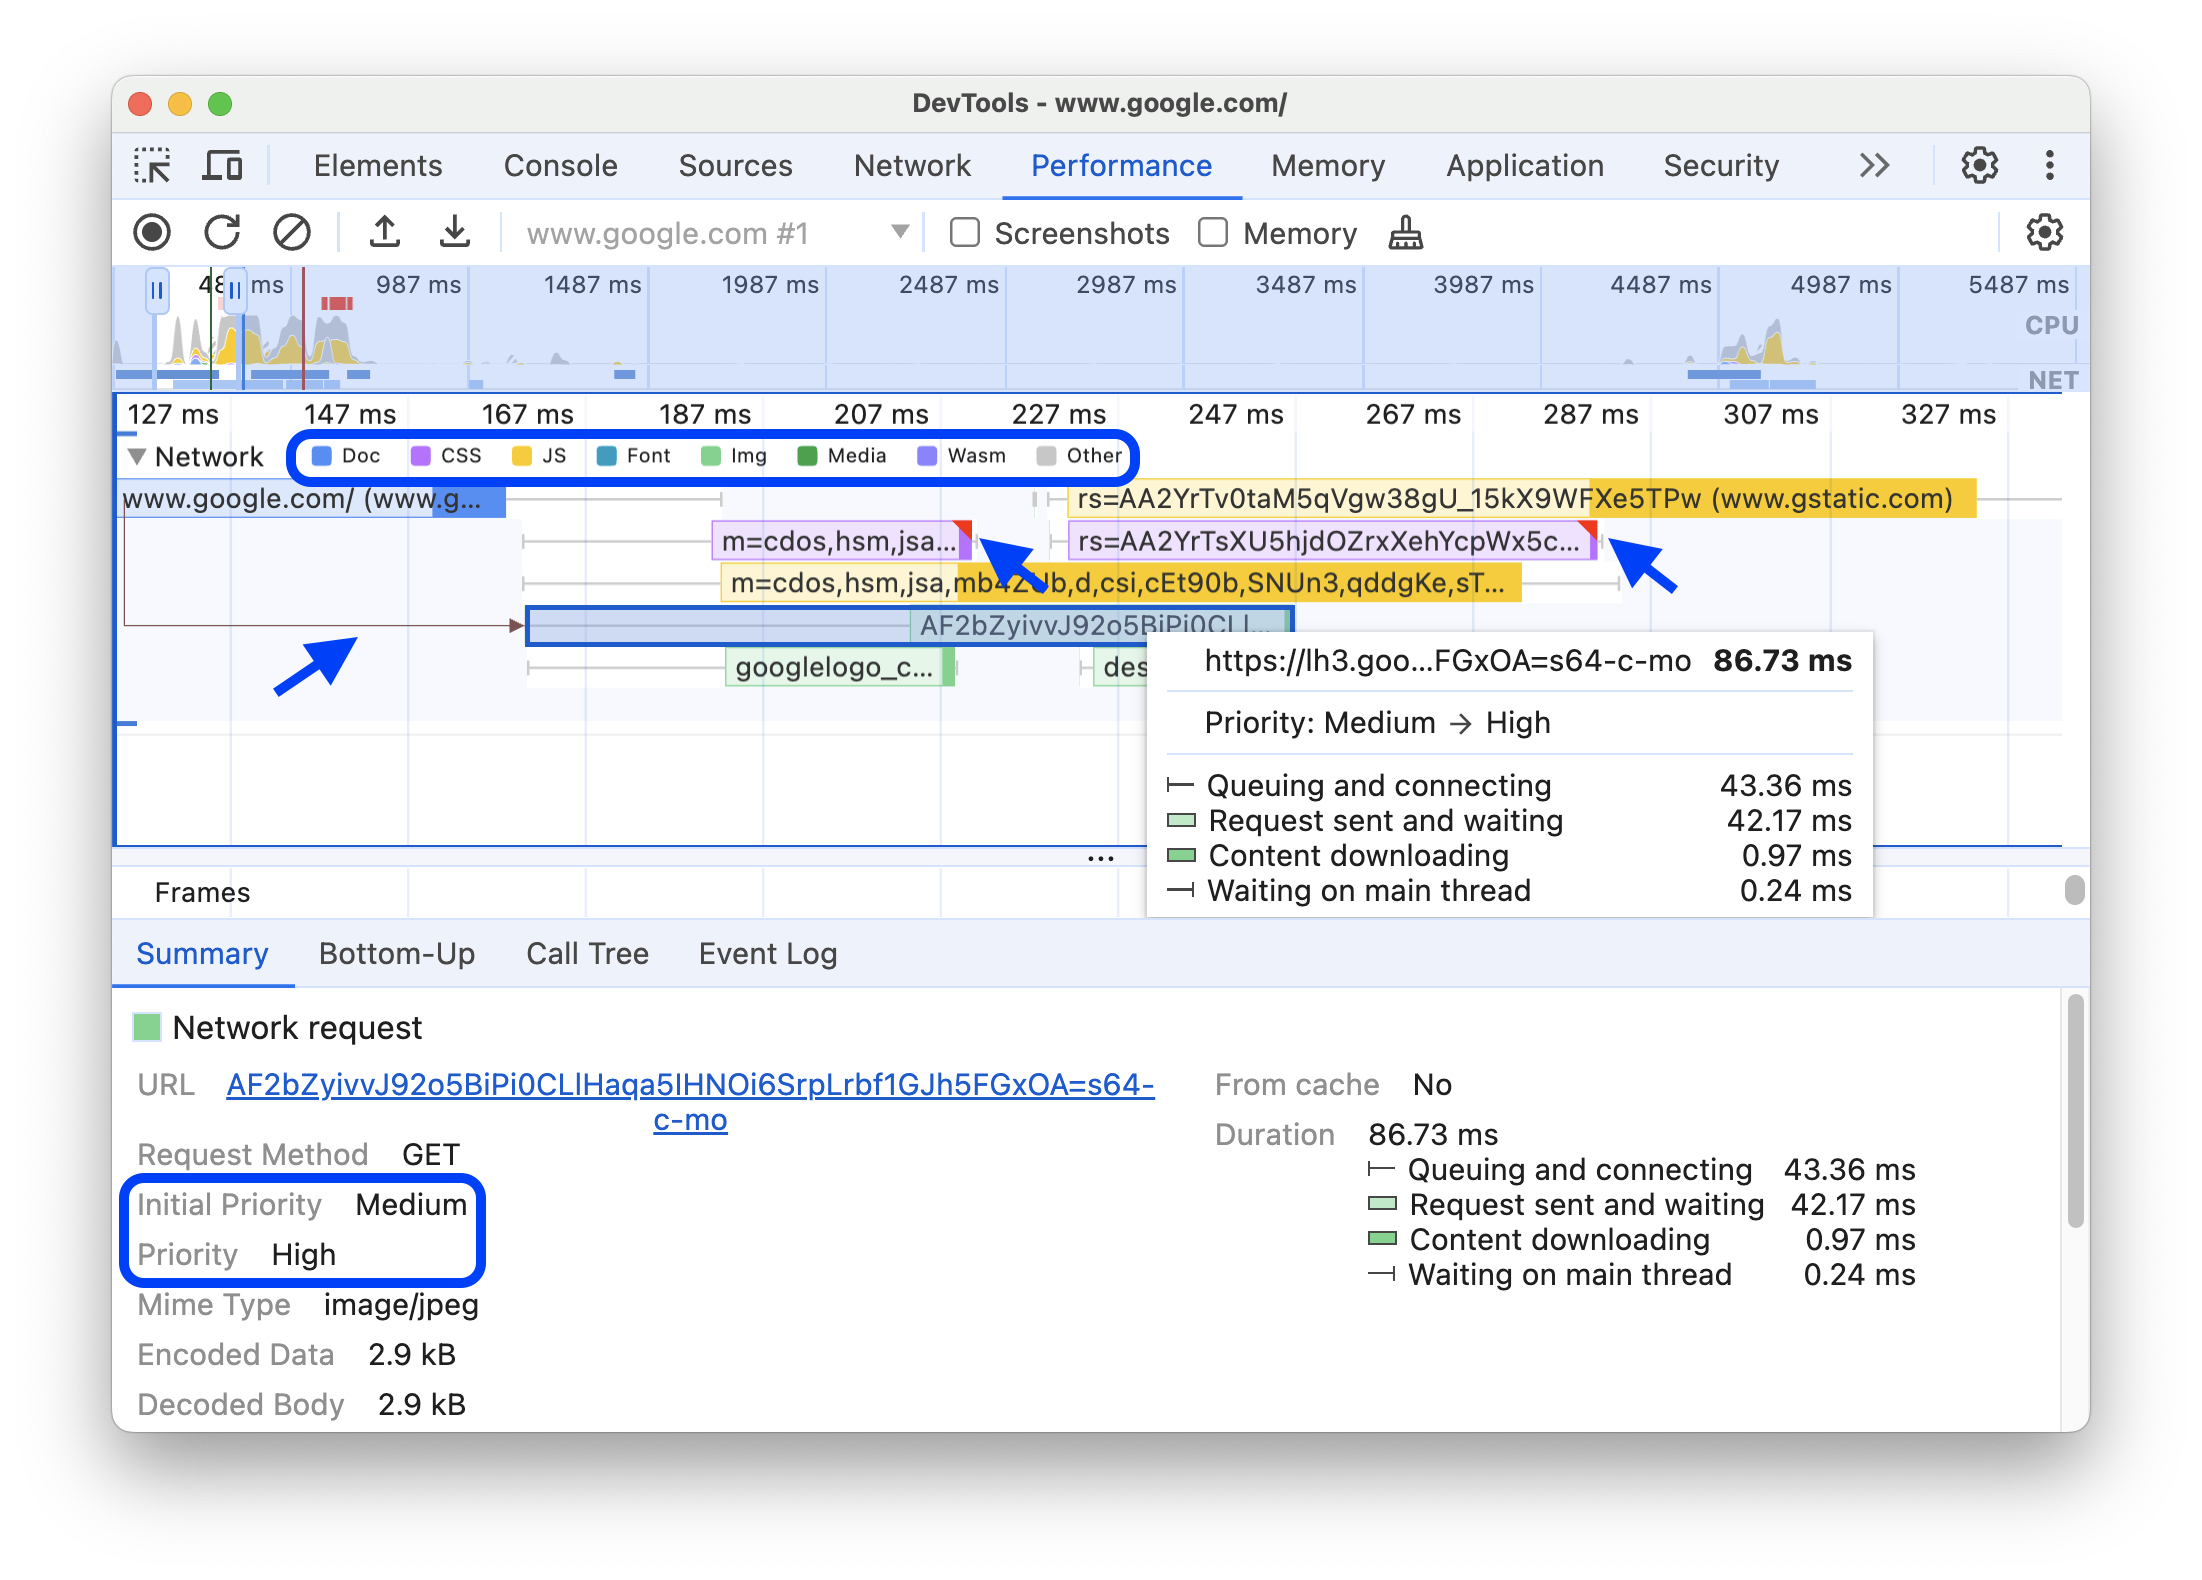
Naast de naam van het netwerkspoor staat een legenda met kleurgecodeerde verzoektypen.
Verzoeken om weergave te blokkeren, worden gemarkeerd met een rode driehoek in de rechterbovenhoek.
Beweeg de muis over een verzoek om een tooltip te zien met:
- URL van de aanvraag en de totale uitvoeringstijd ervan.
- Prioriteit of een verandering van prioriteit, bijvoorbeeld
Medium -> High. - Of het verzoek
Render blockingis of niet. - Een overzicht van de aanvraagtimings, later beschreven.
Wanneer u op een verzoek klikt, tekent het netwerkspoor een pijl van de initiator naar het verzoek.
Daarnaast toont het paneel Prestaties het tabblad Samenvatting met meer informatie over de aanvraag, inclusief maar niet beperkt tot de velden Initiële prioriteit en (Uiteindelijke) prioriteit . Als deze waarden verschillen, is de ophaalprioriteit van de aanvraag tijdens de registratie gewijzigd. Zie Resource laden optimaliseren met de Fetch Priority API voor meer informatie.
Op het tabblad Samenvatting wordt ook een overzicht gegeven van de timing van het verzoek.
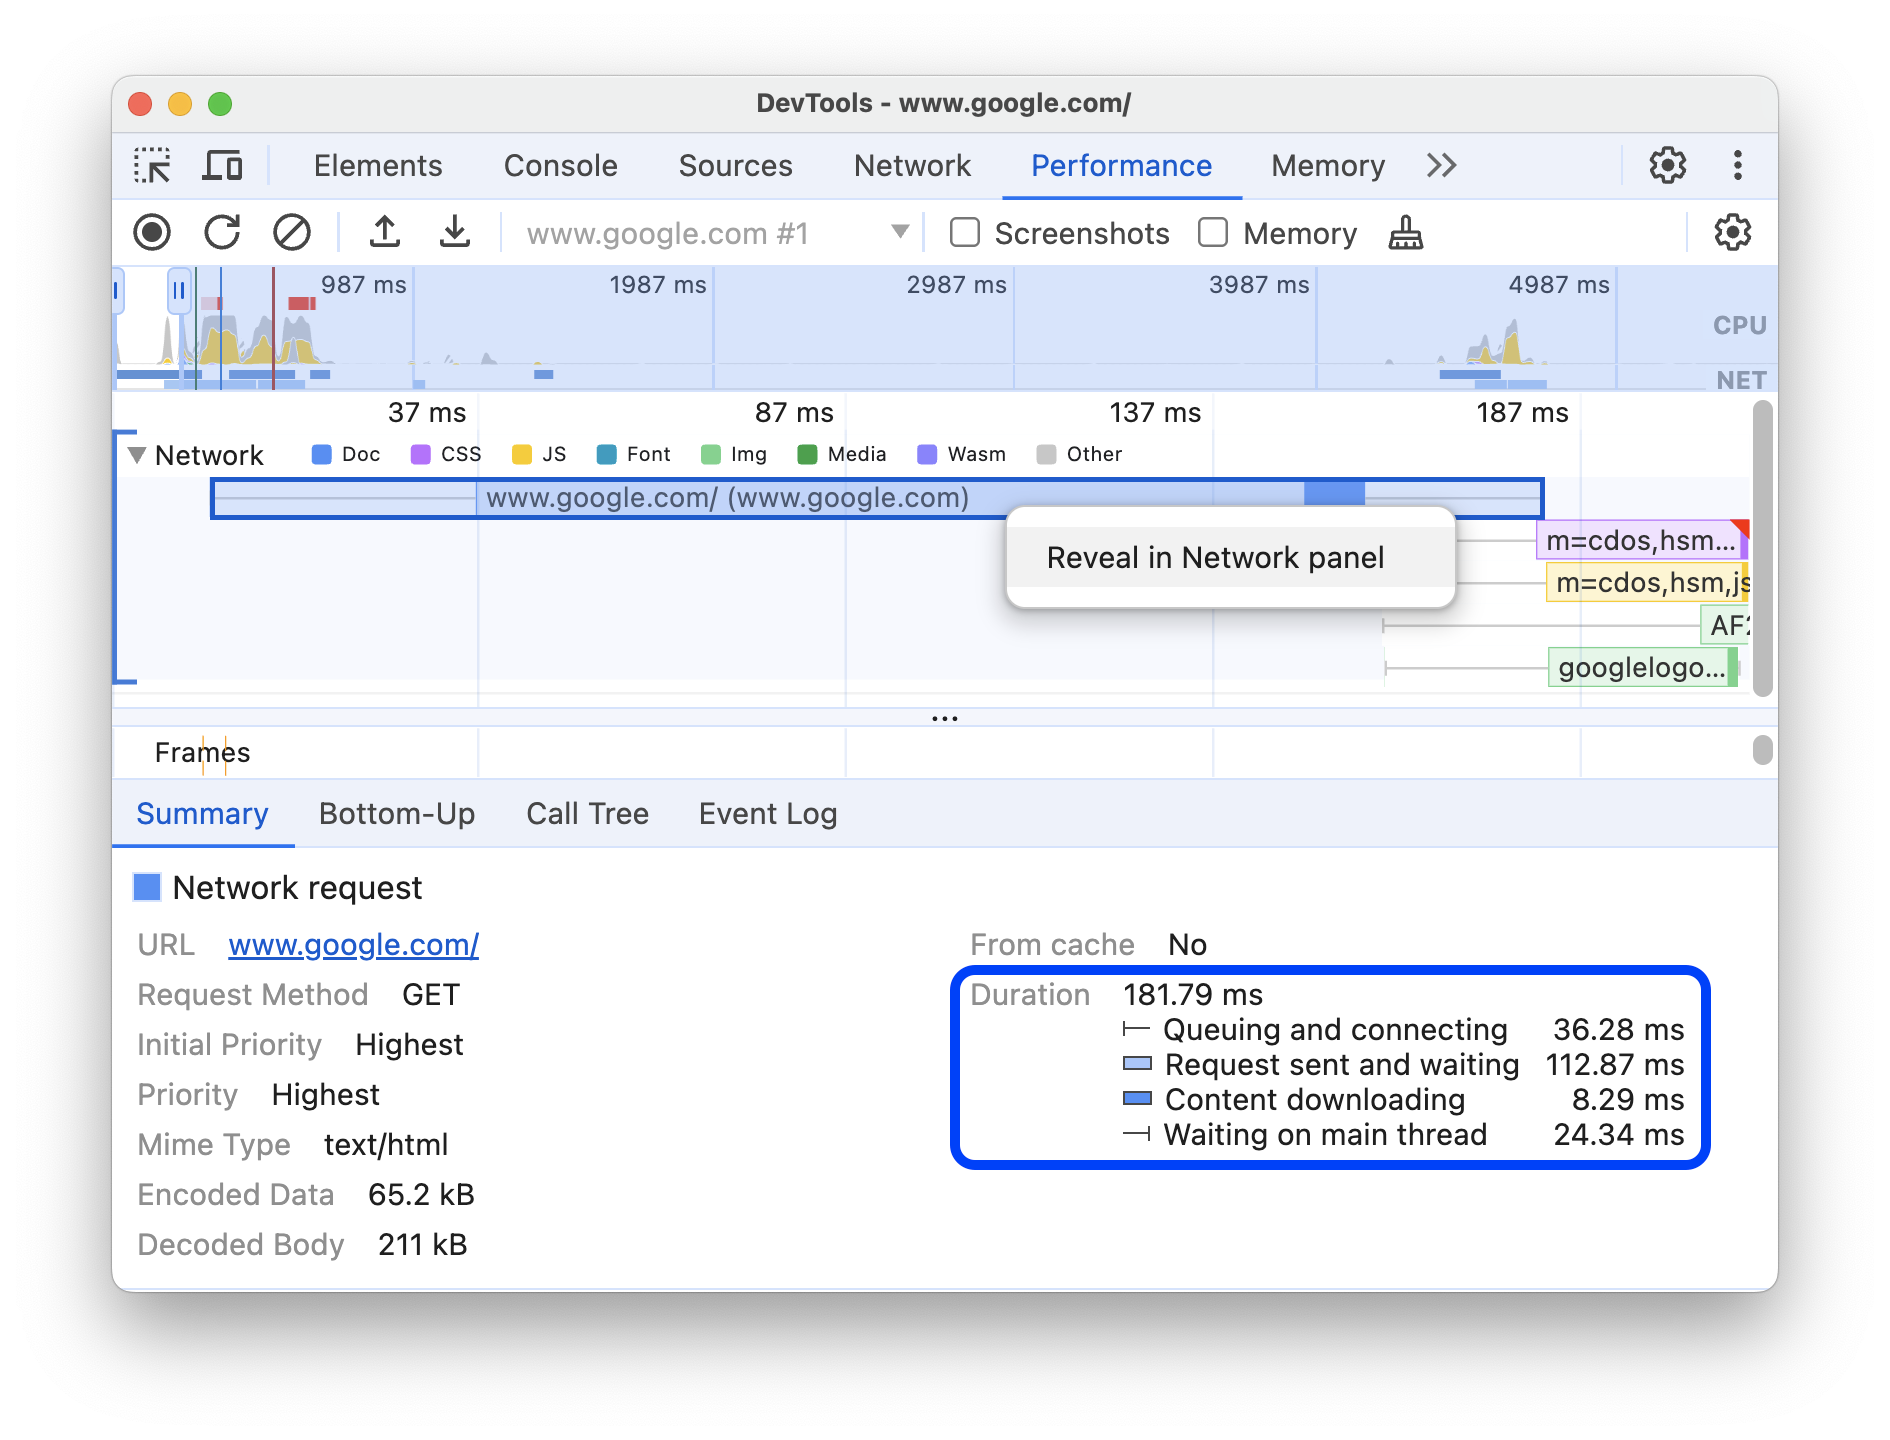
In dit voorbeeld wordt de aanvraag voor www.google.com weergegeven door een lijn aan de linkerkant ( |– ), een balk in het midden met een donker en een licht gedeelte, en een lijn aan de rechterkant ( –| ).
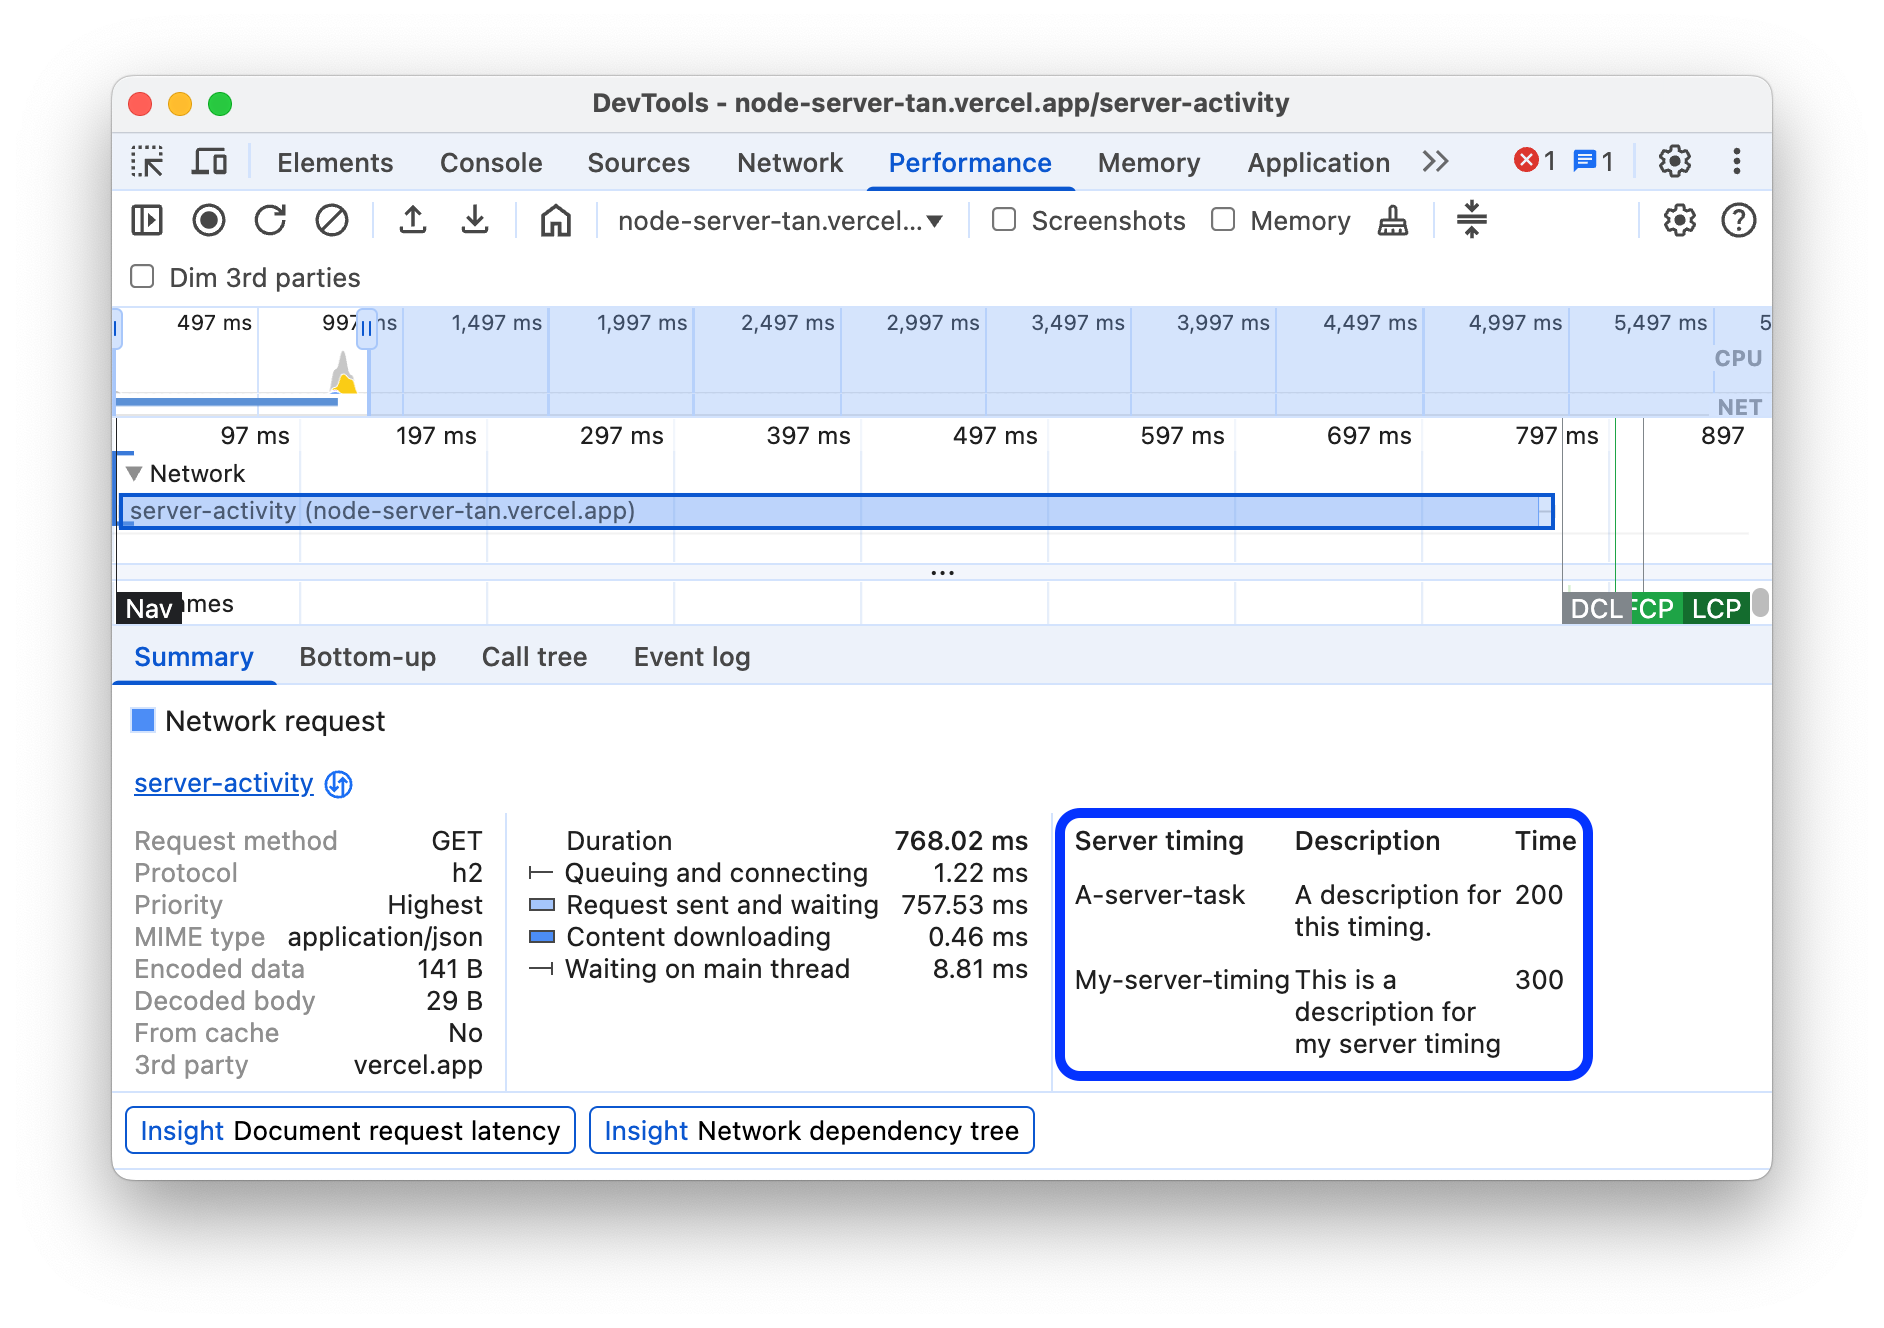
If present, the Summary tab also shows a breakdown of server timings for network requests that implement server-side rendering technologies. For these requests, the Performance panel takes the data from the Server-Timing response header .
You can find another timings breakdown in the Network tab. Right-click the request in the Network track or its URL in the Summary tab and click Reveal in Network panel . DevTools takes you to the Network panel and selects the corresponding request. Open its Timing tab.
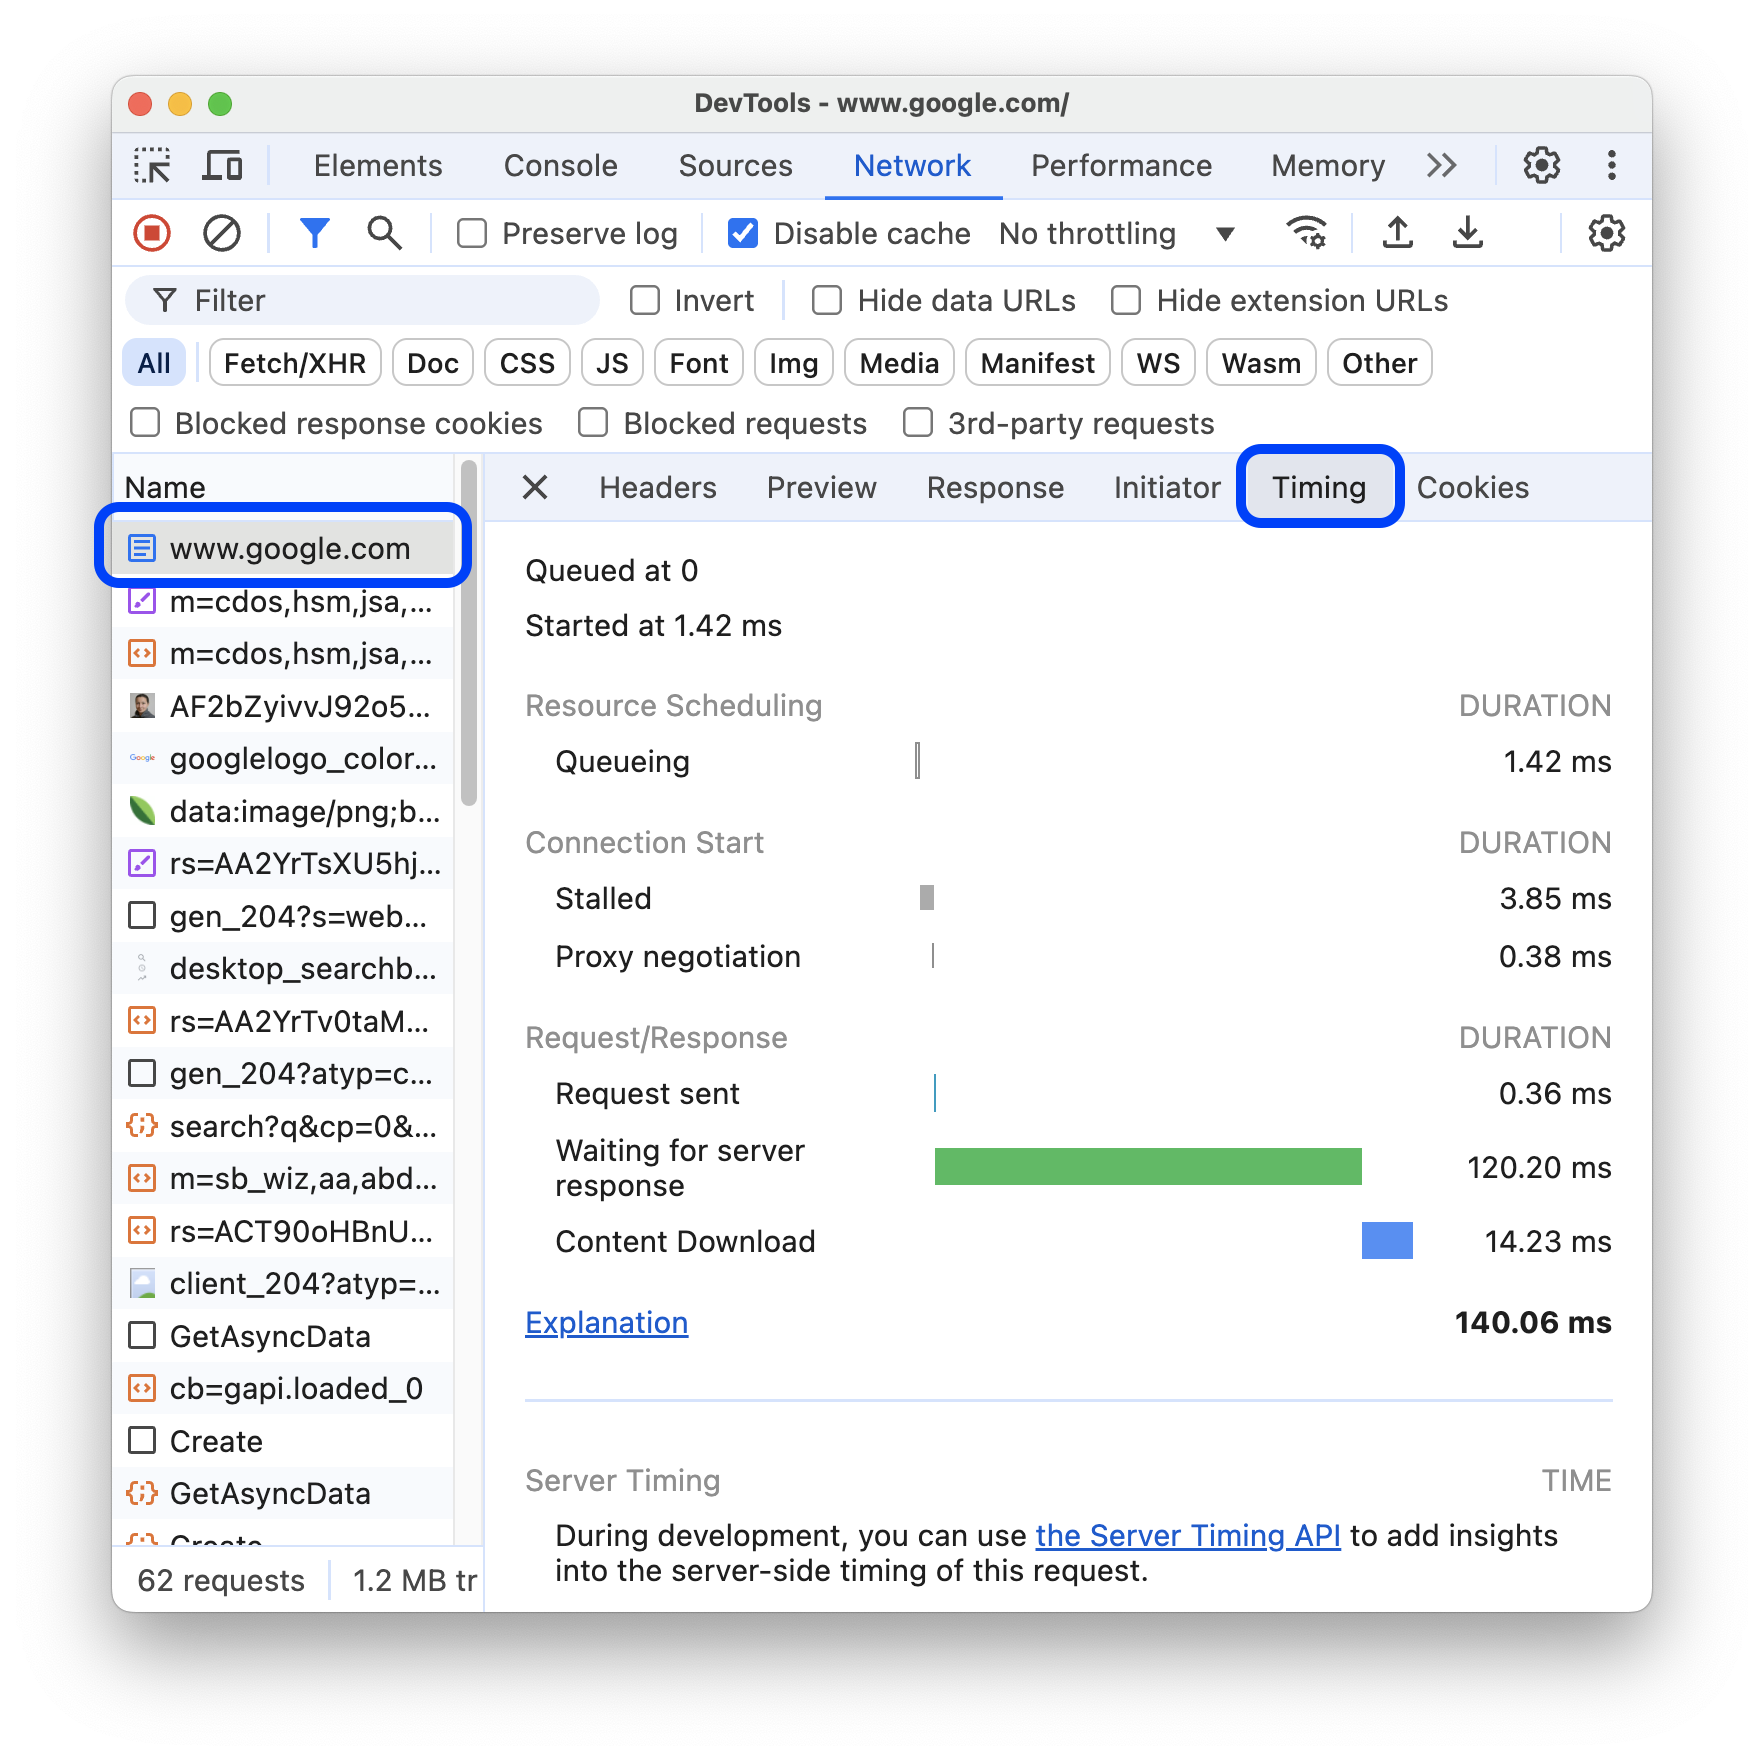
Here's how these two breakdowns map to each other:
- The left line (
|–) is everything up to theConnection startgroup of events, inclusive. In other words, it's everything beforeRequest Sent. - The light portion of the bar is
Request sentandWaiting for server response. - The dark portion of the bar is
Content download. - The right line (
–|) is the time spent waiting for the main thread. The Network > Timing tab doesn't show it.
View memory metrics
Enable the Memory checkbox to view memory metrics from the last recording.

DevTools displays a new Memory chart, above the Summary tab. There's also a new chart below the NET chart, called HEAP . The HEAP chart provides the same information as the JS Heap line in the Memory chart.
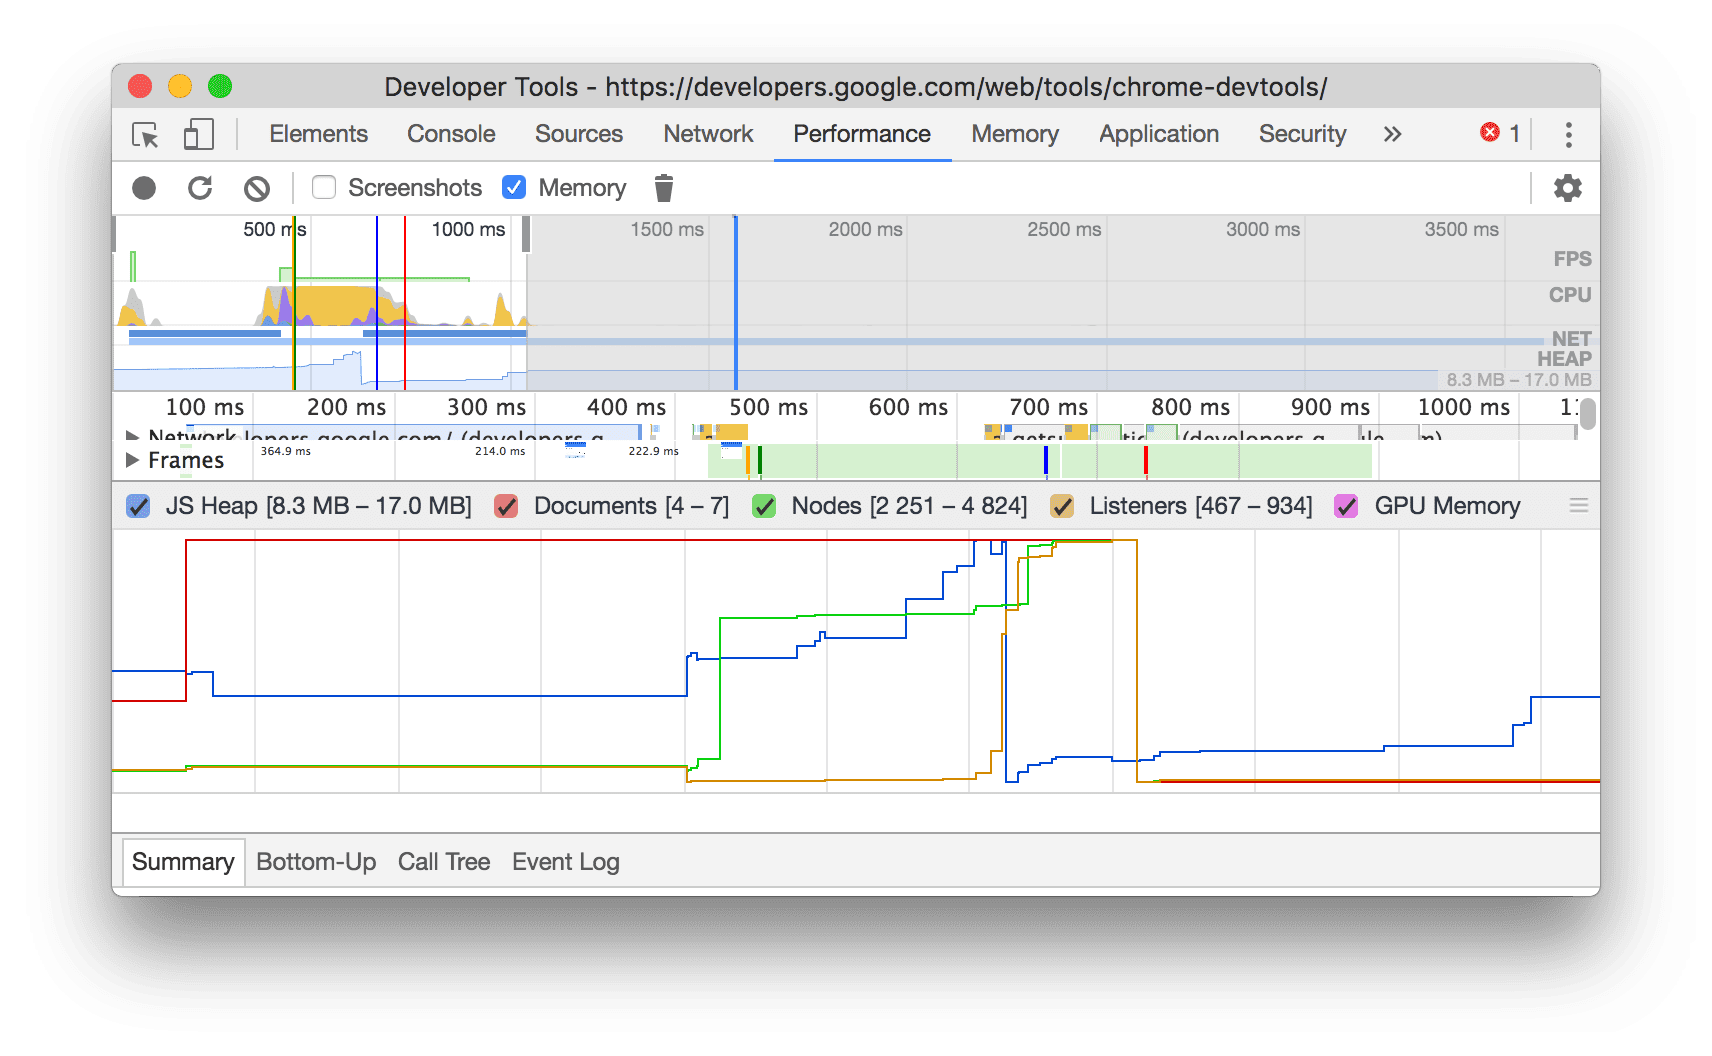
This example shows memory metrics above the Summary tab.
The colored lines on the chart map to the colored checkboxes above the chart. Disable a checkbox to hide that category from the chart.
The chart only displays the region of the recording that is selected. In the earlier example, the Memory chart shows only the memory usage for the start of the recording, up to around the 1000ms mark.
View the duration of a portion of a recording
When analyzing a section like Network or Main , sometimes you need a more precise estimate of how long certain events took. Hold Shift, click and hold, and drag left or right to select a portion of the recording. At the bottom of your selection, DevTools shows how long that portion took.
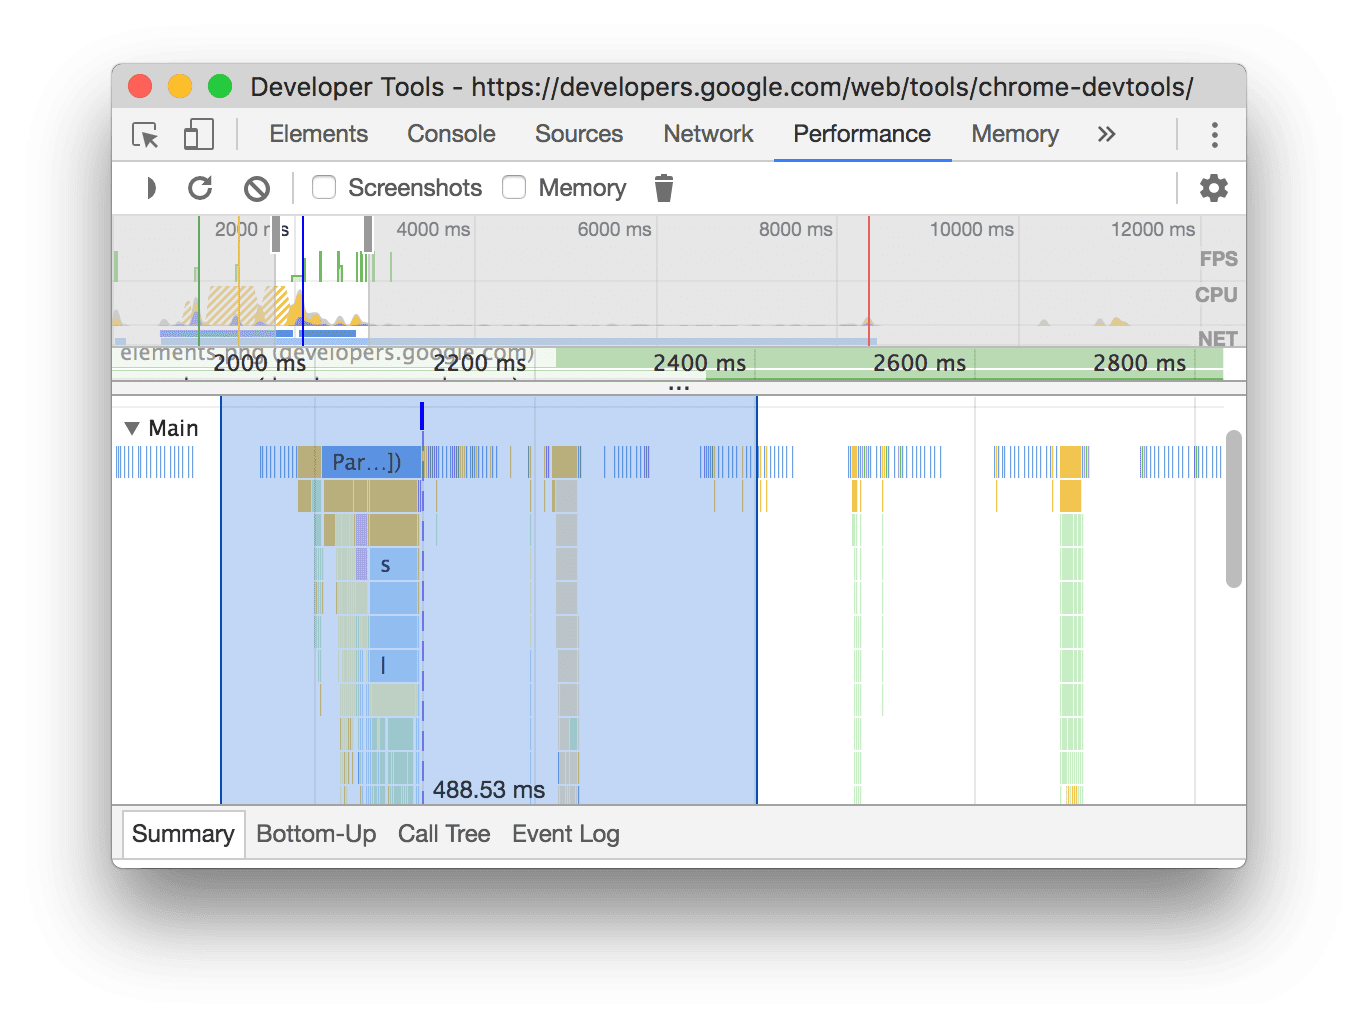
In this example, the 488.53ms timestamp at the bottom of the selected portion indicates how long that portion took.
View a screenshot
See Capture screenshots while recording to learn how to enable screenshots.
Hover over the Timeline overview to view a screenshot of how the page looked during that moment of the recording. The Timeline overview is the section that contains the CPU , FPS , and NET charts.
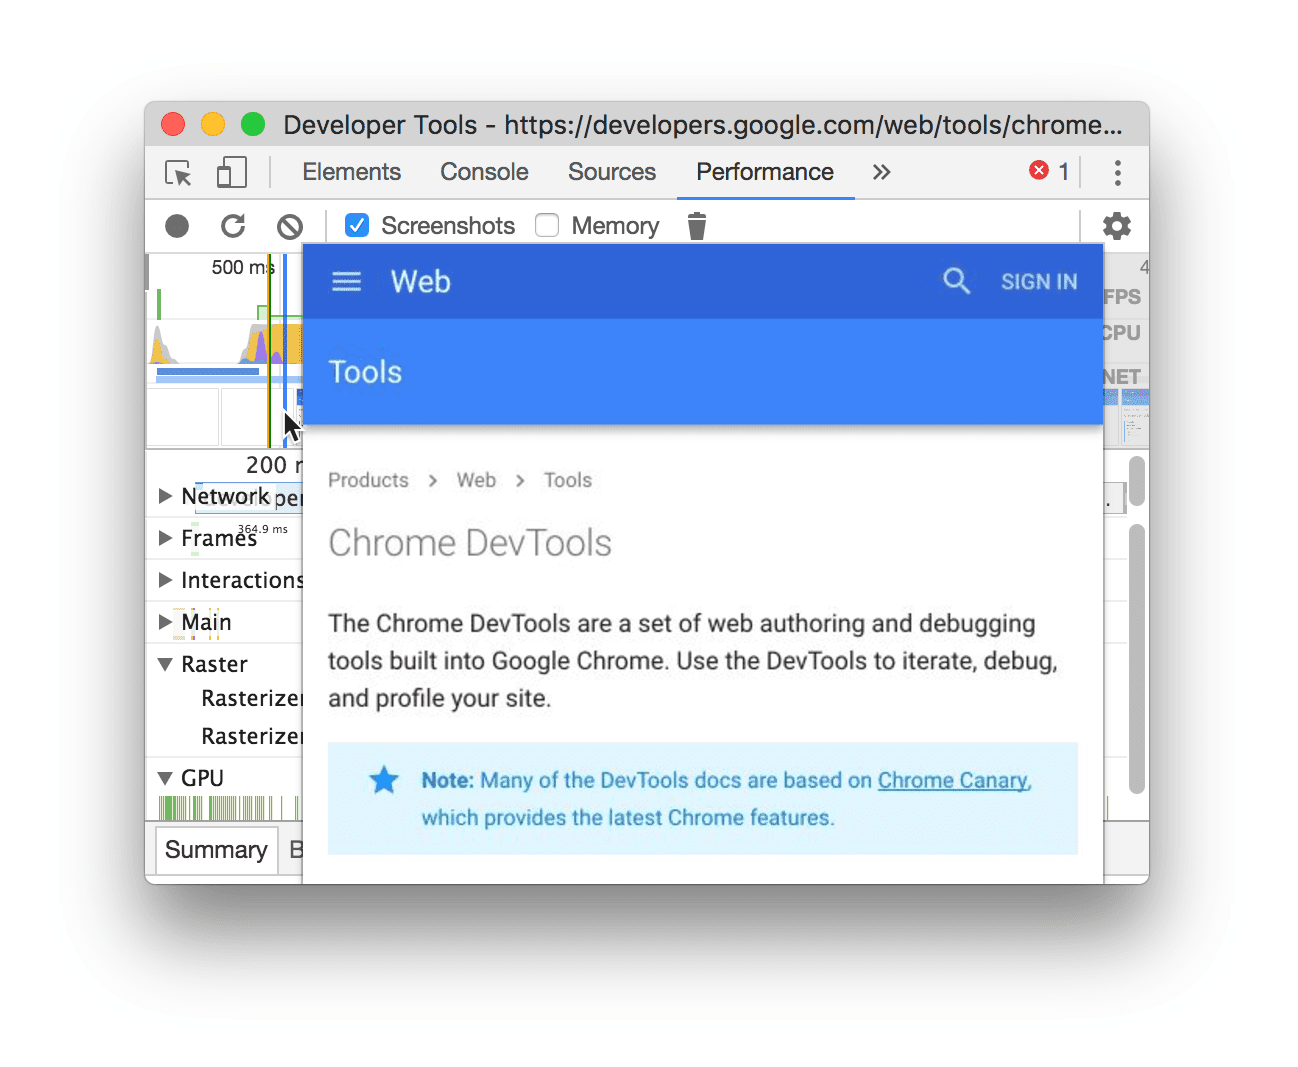
You can also view screenshots by clicking a frame in the Frames section. DevTools displays a small version of the screenshot in the Summary tab.
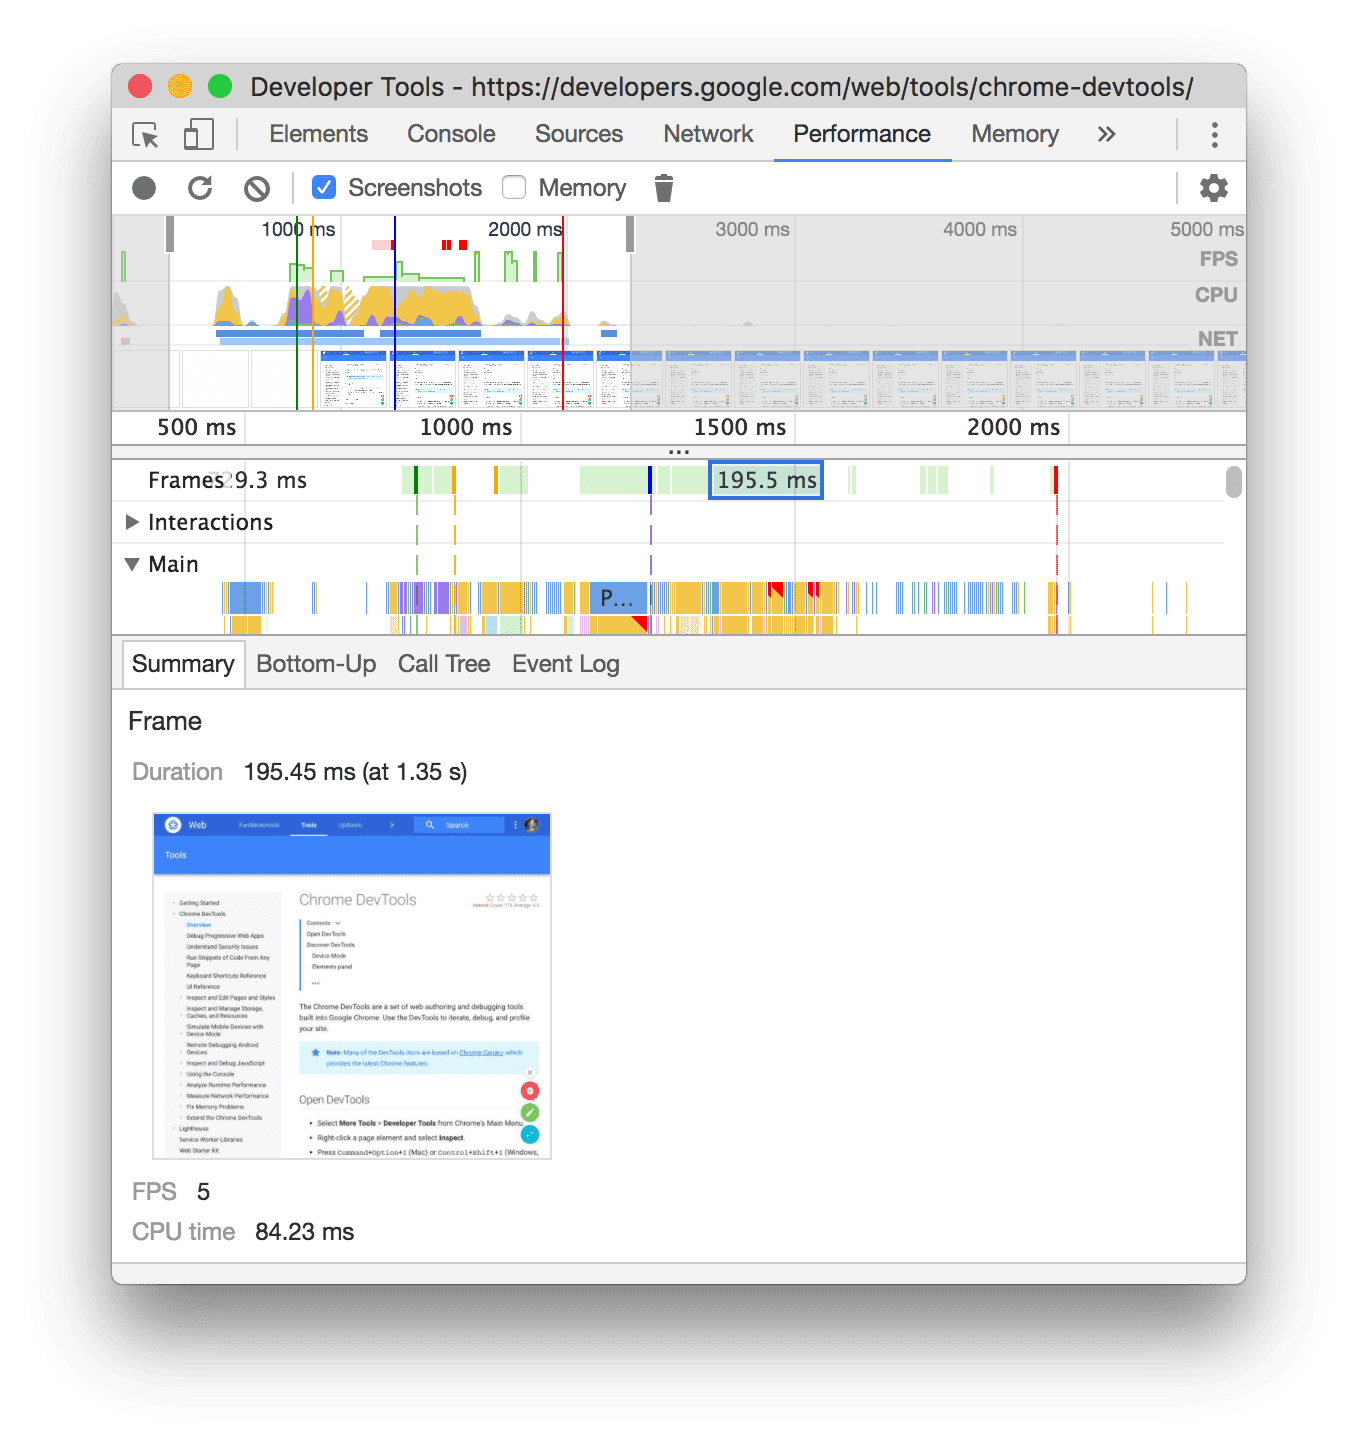
This example shows the screenshot for the 195.5ms frame in the Summary tab when you click it in the Frames section.
Click the thumbnail in the Summary tab to zoom in on the screenshot.
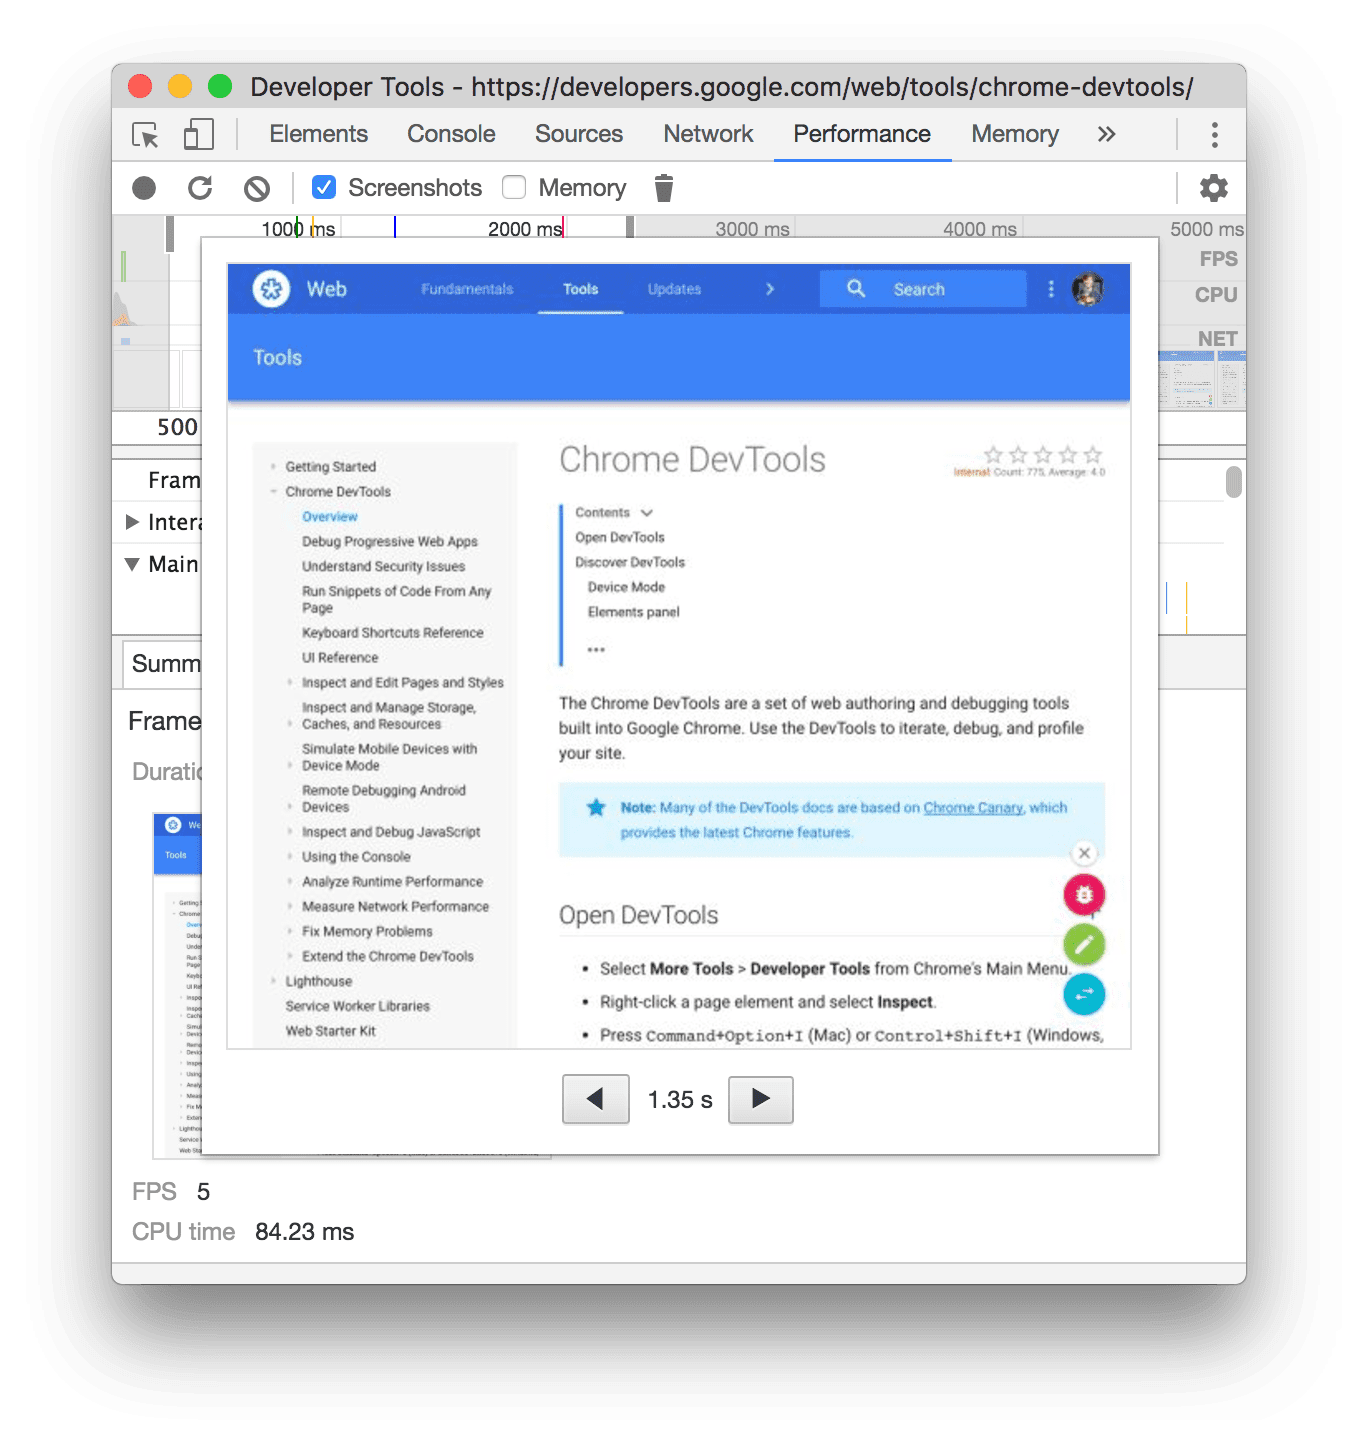
This example shows a zoomed-in screenshot after you click its thumbnail in the Summary tab.
View layers information
To view advanced layers information about a frame:
- Enable advanced paint instrumentation .
- Select a frame in the Frames section. DevTools displays information about its layers in the new Layers tab, next to the Event log tab.
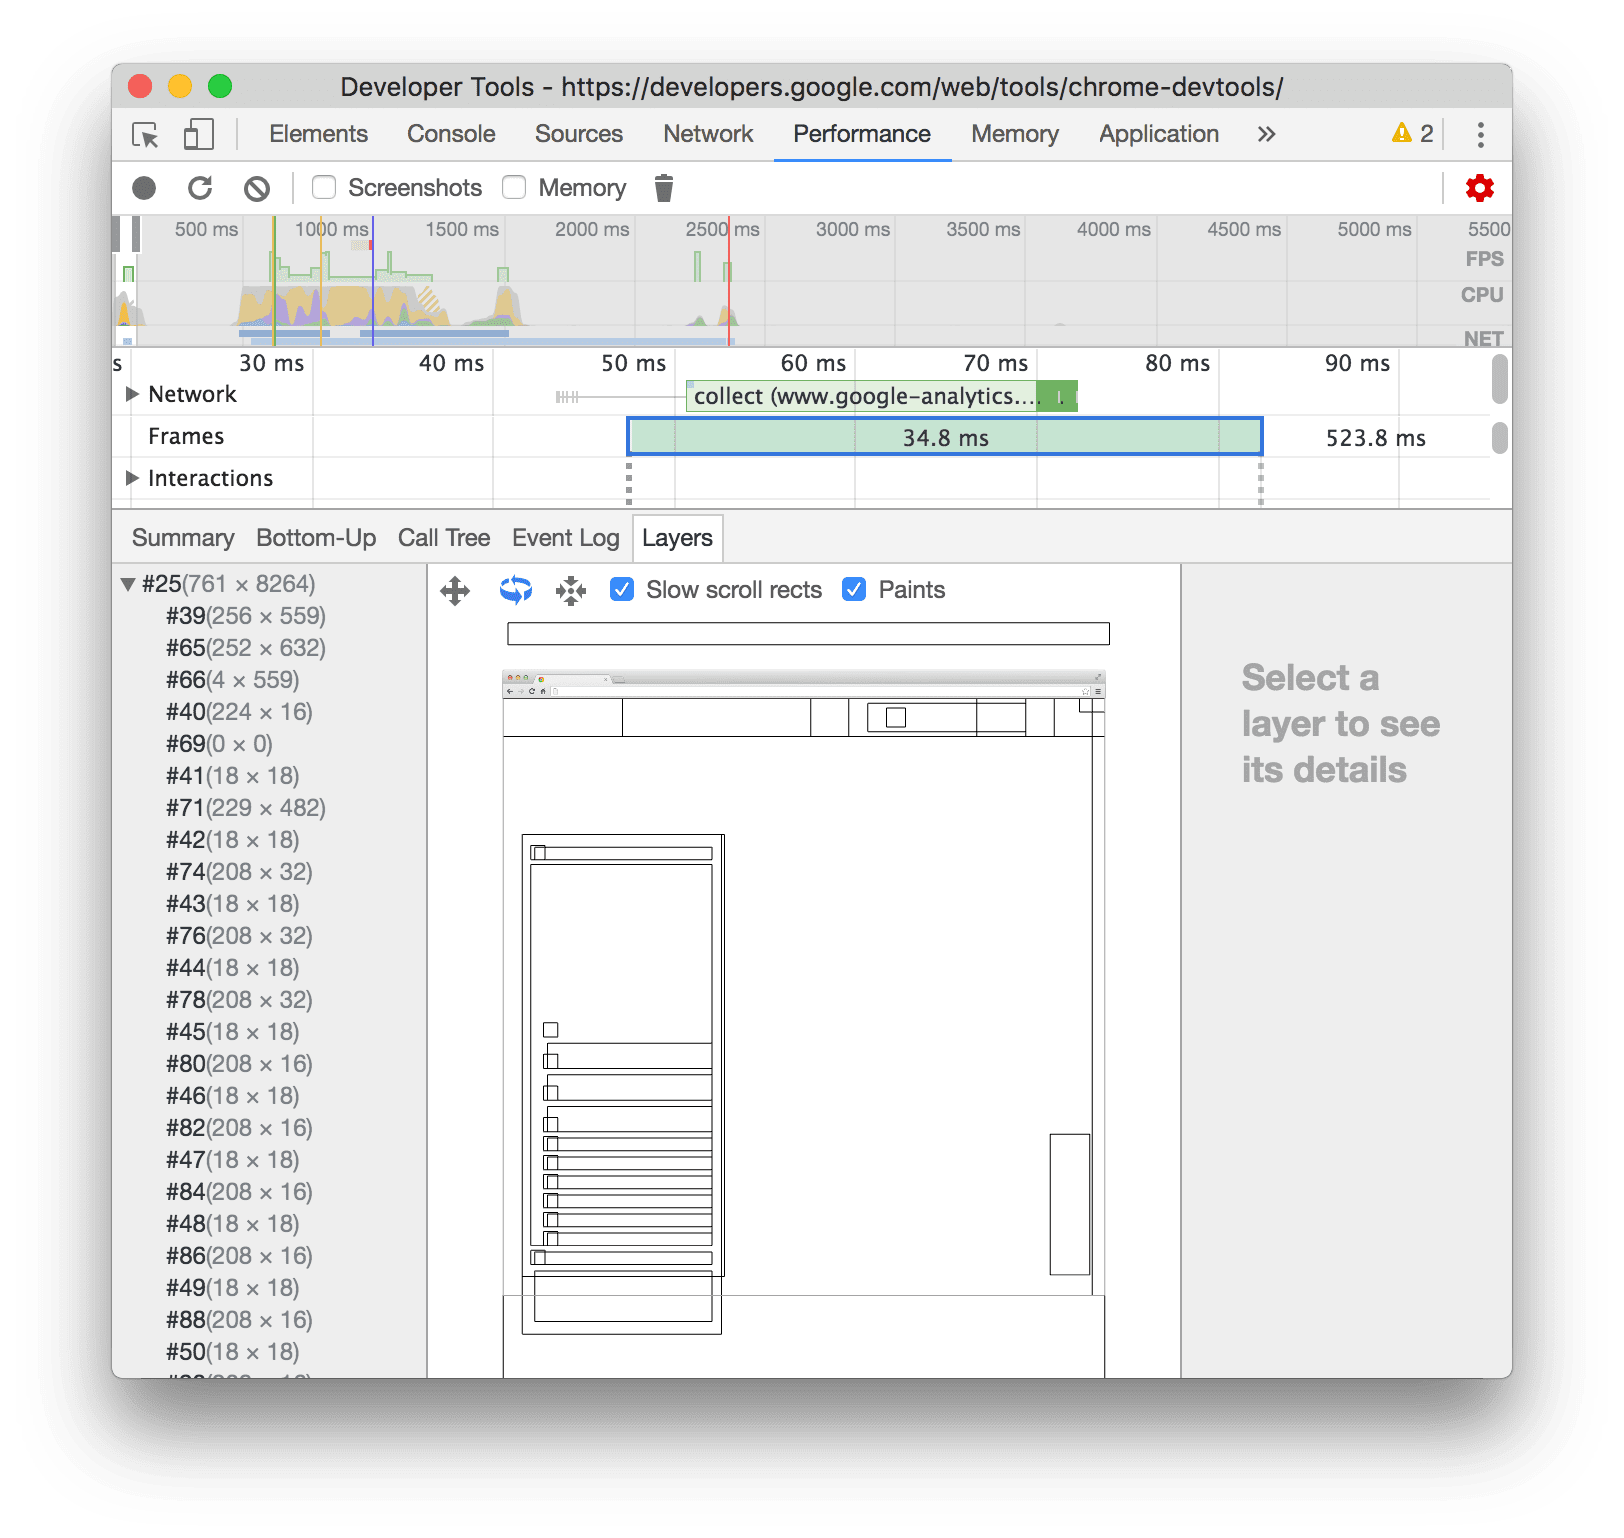
Hover over a layer to highlight it in the diagram.
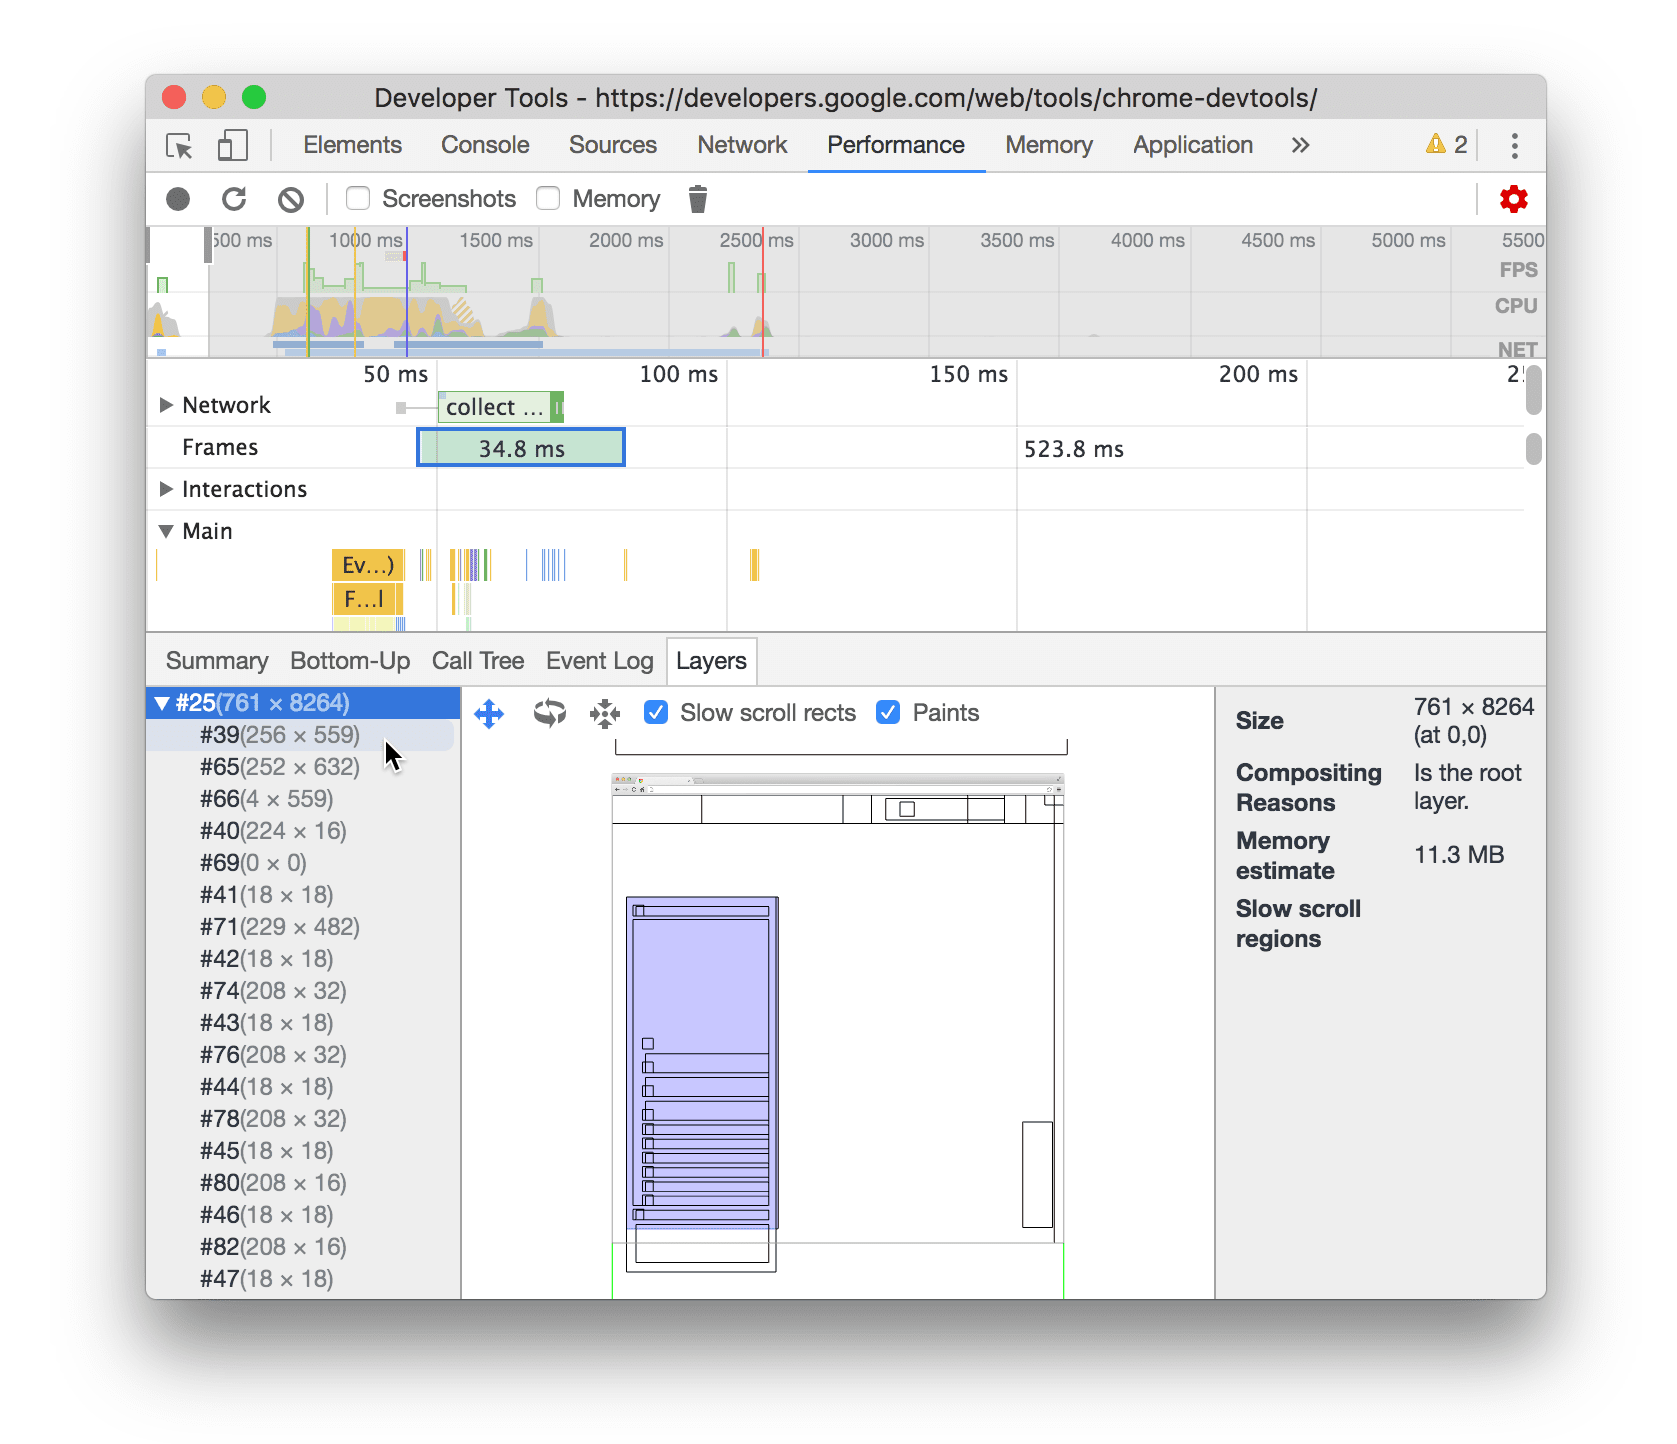
This example shows the layer #39 highlighted as you hover over it.
To move the diagram:
- Click Pan Mode
 to move along the X and Y axes.
 - Click Rotate Mode
 to rotate along the Z axis.
 - Click Reset Transform
 to reset the diagram to its original position.
See layer analysis in action:
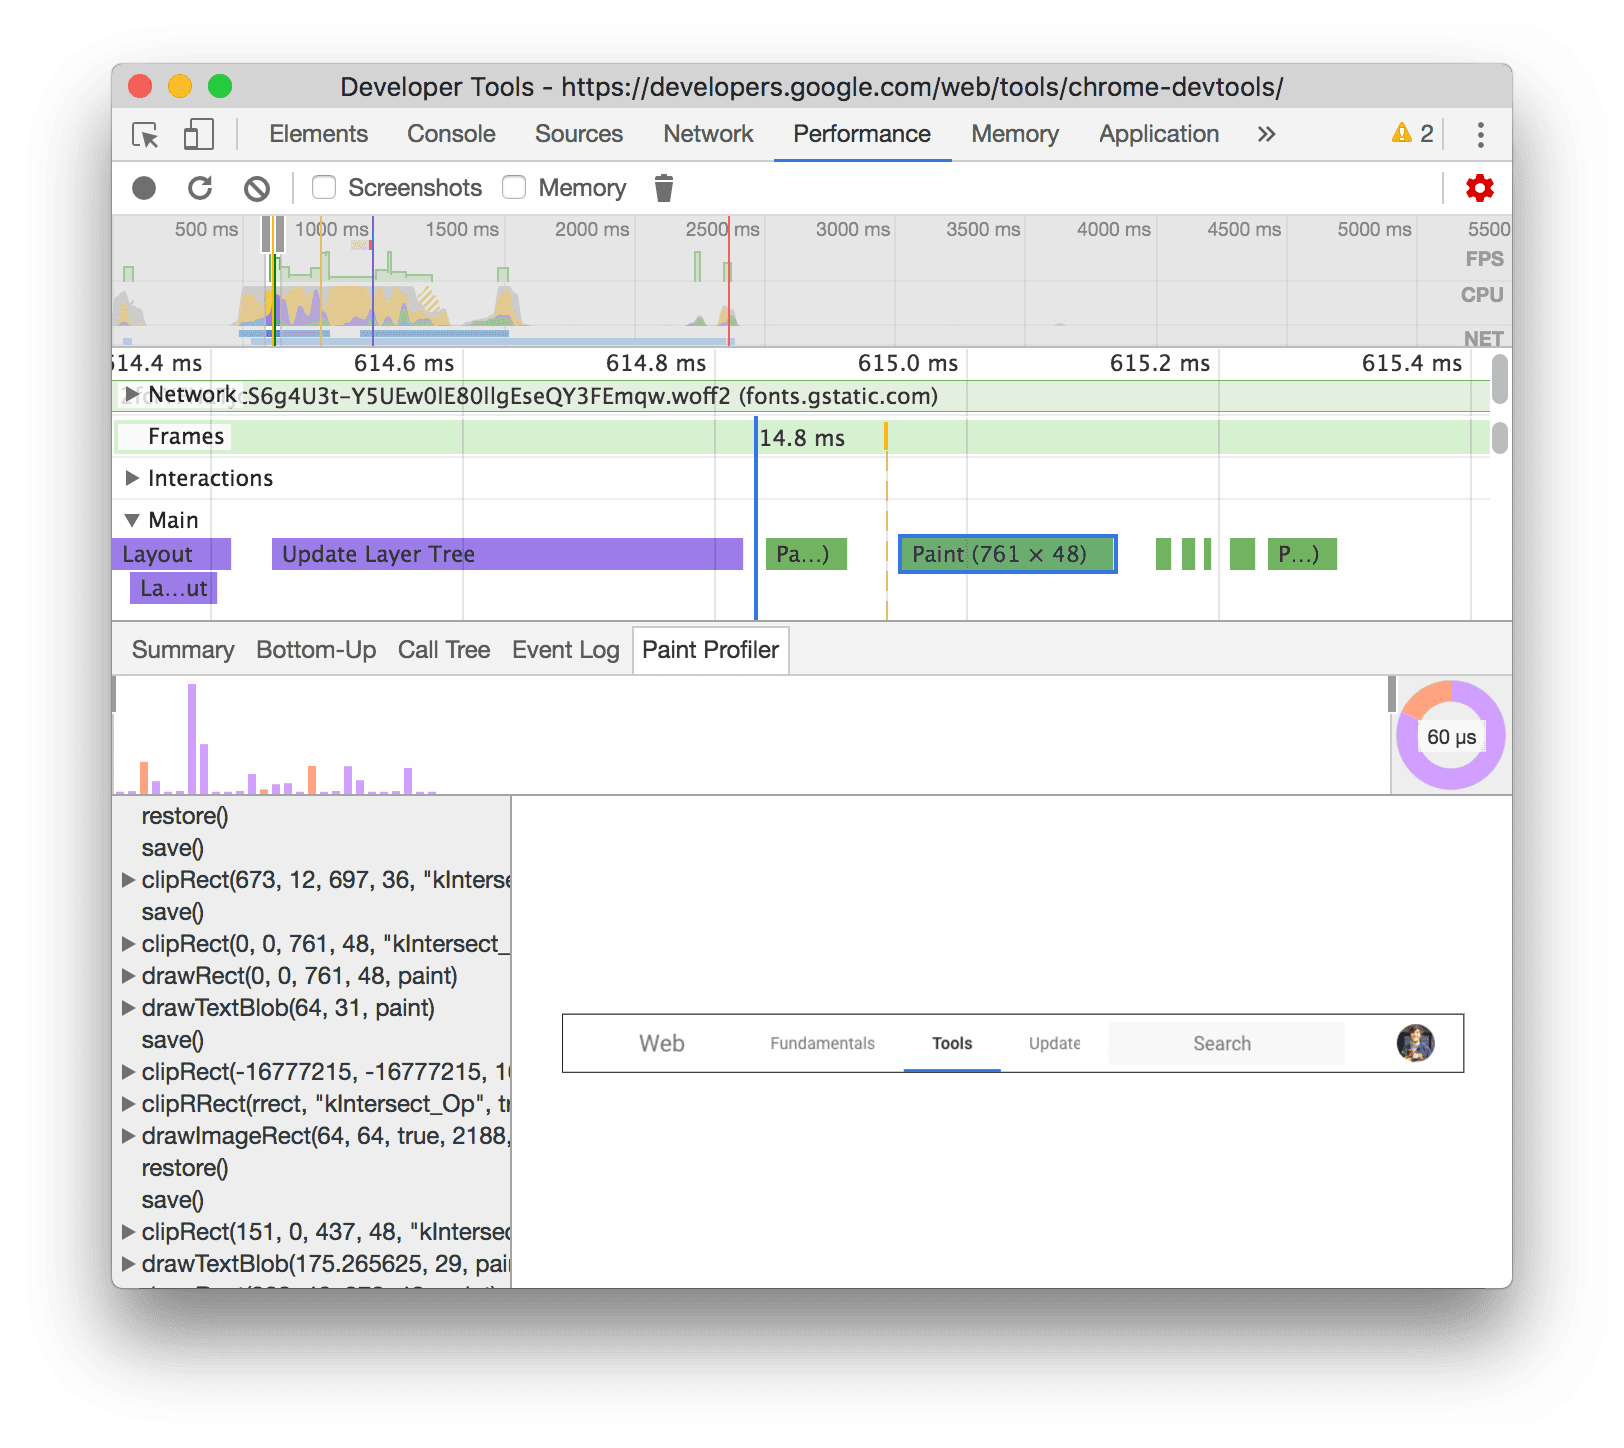
View paint profiler
To view advanced information about a paint event:
- Enable advanced paint instrumentation .
- Select a Paint event in the Main track.
Analyze rendering performance with the Rendering tab
Use the Rendering tab's features to help visualize your page's rendering performance.
View frames per second in real time with the FPS meter
The Frame rendering stats is an overlay that appears in the top-right corner of your viewport. It provides a real time estimate of FPS as the page runs.
See Frame rendering stats .
View painting events in real time with Paint Flashing
Use Paint Flashing to get a real time view of all paint events on the page.
See Paint flashing .
View an overlay of layers with Layer Borders
Use Layer Borders to view an overlay of layer borders and tiles on top of the page.
See Layer borders .
Find scroll performance issues in real time
Use Scrolling Performance Issues to identify elements of the page that have event listeners related to scrolling that may harm the performance of the page. DevTools outlines the potentially-problematic elements in teal.