Use the Performance panel to profile the performance of Node.js and Deno applications.
What's a CPU profile?
A CPU profile is a report that shows how the CPU was used over a period of time. It can show which programs were using the most CPU time, which processes were running, and how much time was spent in each state. With CPU profiles, you can identify performance bottlenecks and optimize CPU resource utilization.
Open DevTools for Node
In the command line, run:
Node.js
node --inspect file-name.jsDeno
deno --inspect file-name.jsConnect to DevTools for Node in one of the following ways:
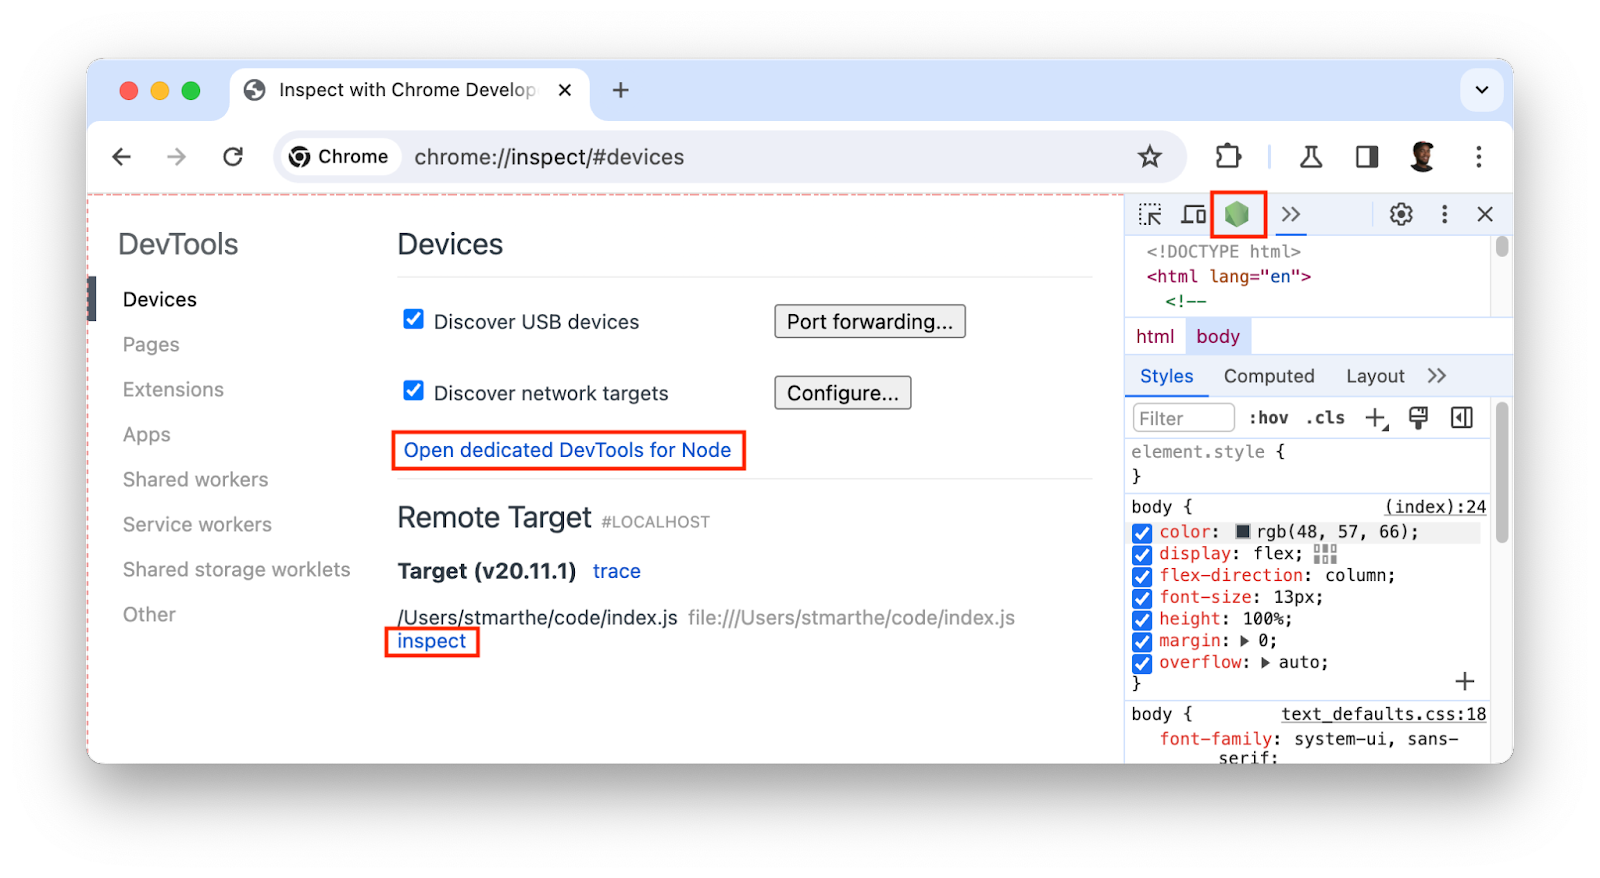
- Open DevTools and click the green Node button in the DevTools action bar at the top.
In the address bar enter
chrome://inspect, then click one of the following:- Open dedicated DevTools for Node under Devices.
- Inspect under the target you want to profile.
Profile the CPU
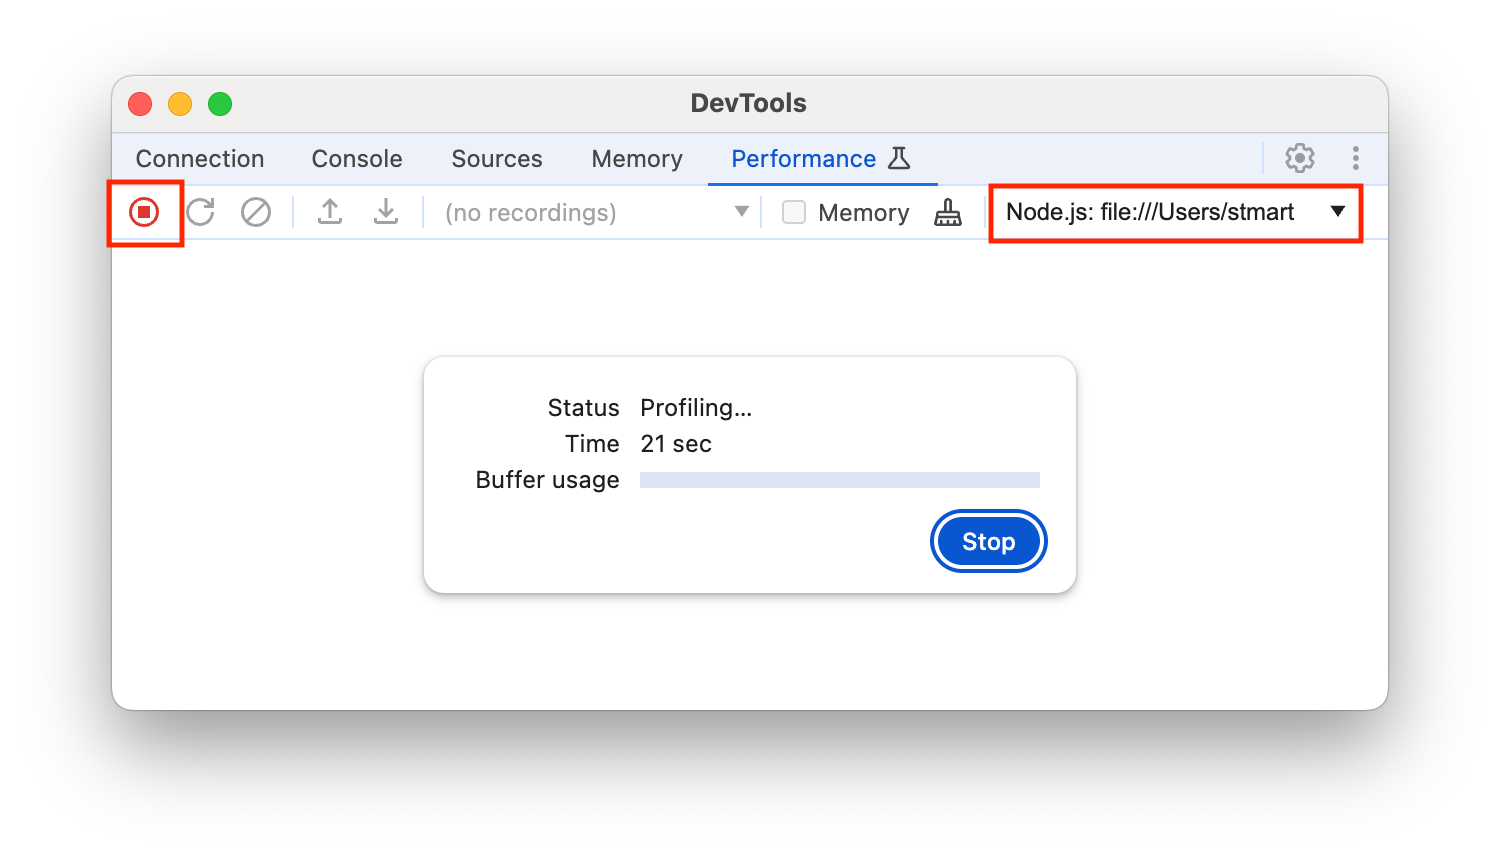
To profile the CPU, open the Performance panel and click the Record button two times to start and end profiling.
Analyze profiling results
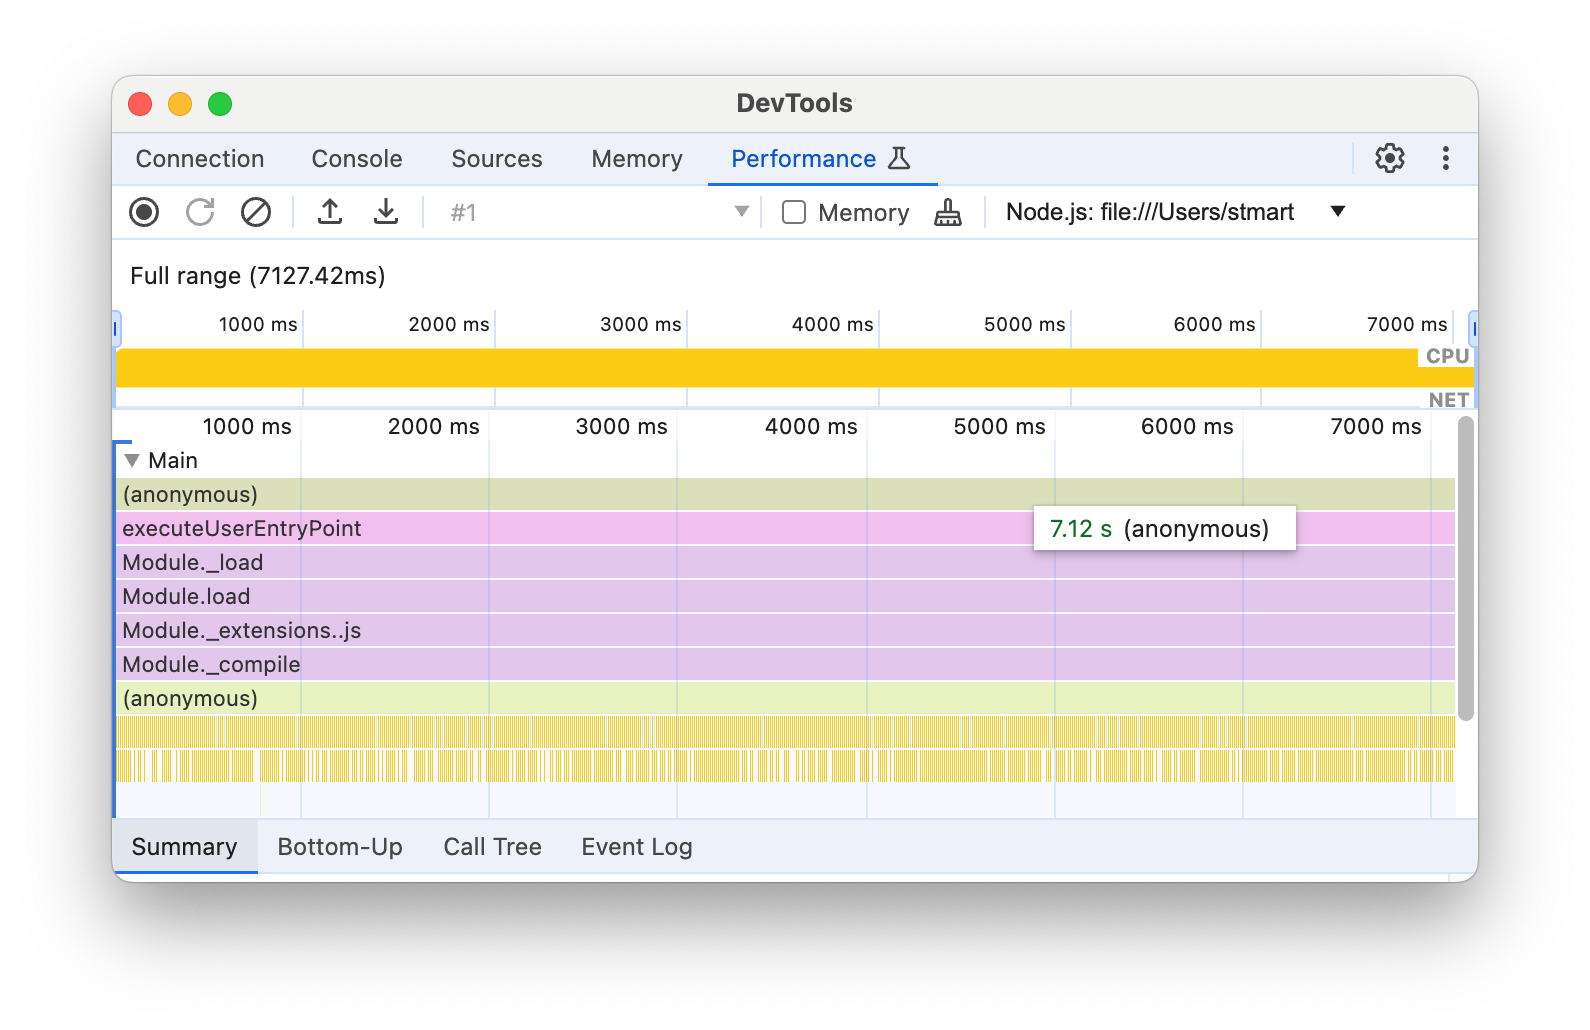
After you stop the recording, the Performance panel organizes and displays data about the recording in a "profile". Use the following tabs to analyze the profiling data:
Timeline overview. Located at the top under the activity bar. Shows CPU and NET activity charts on a timeline. Use it to identify performance bottlenecks.
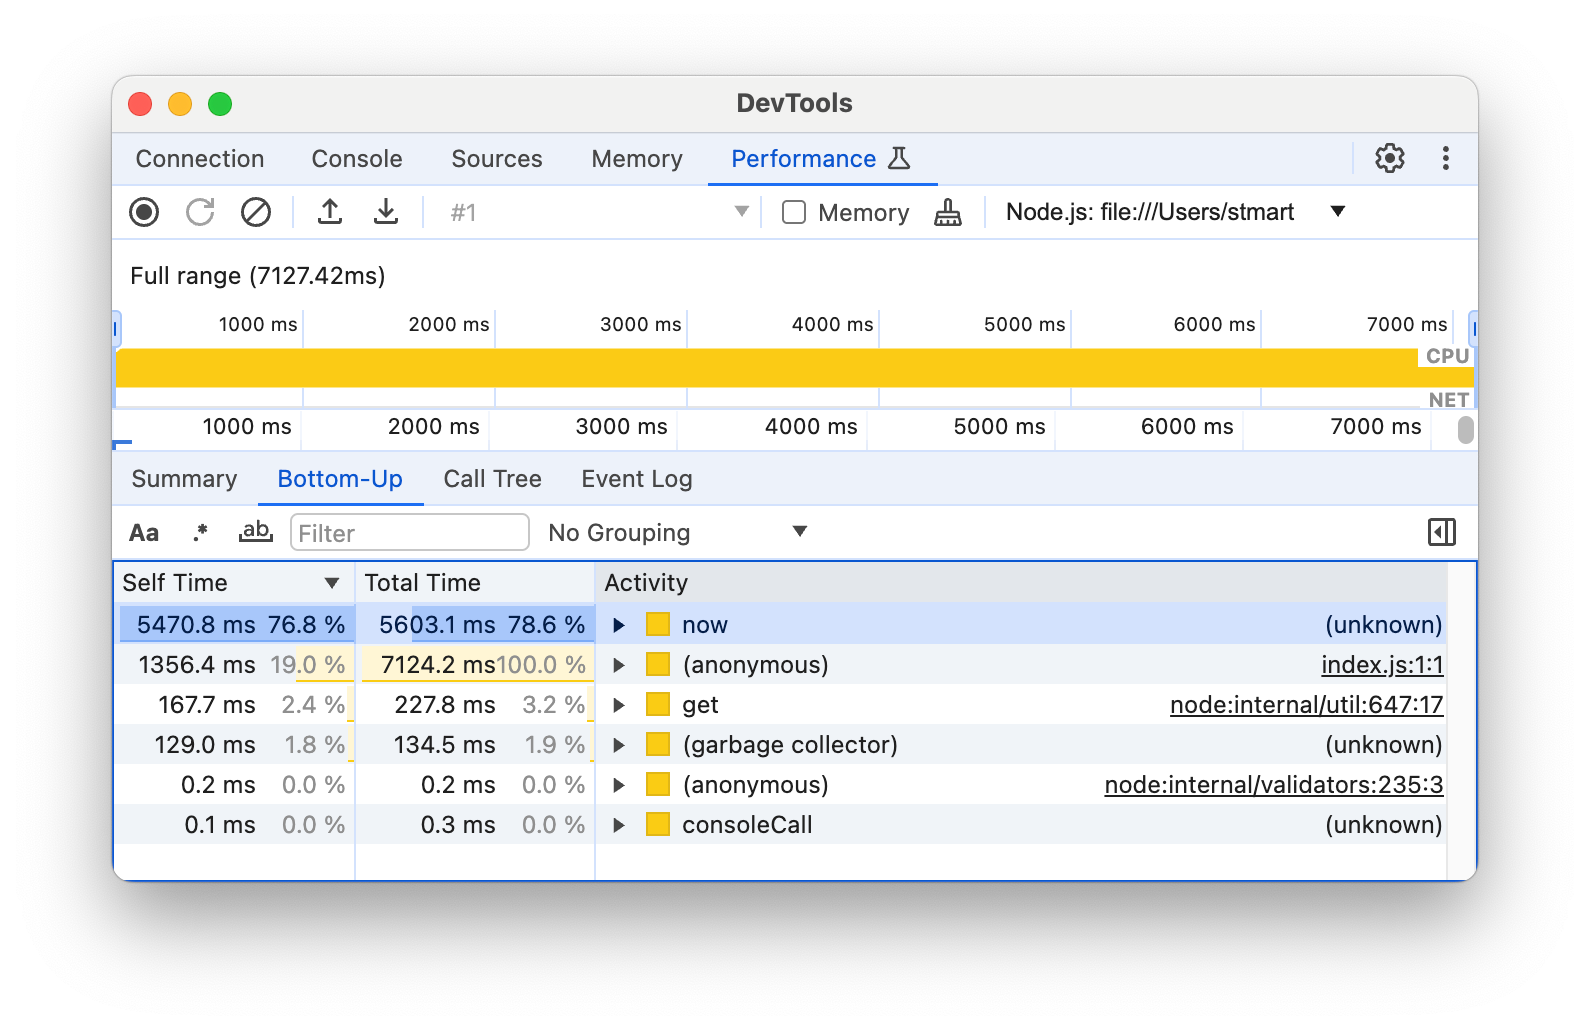
Bottom-Up: Use this tab to inspect a selected portion of the recording and see aggregated time spent on individual activities.
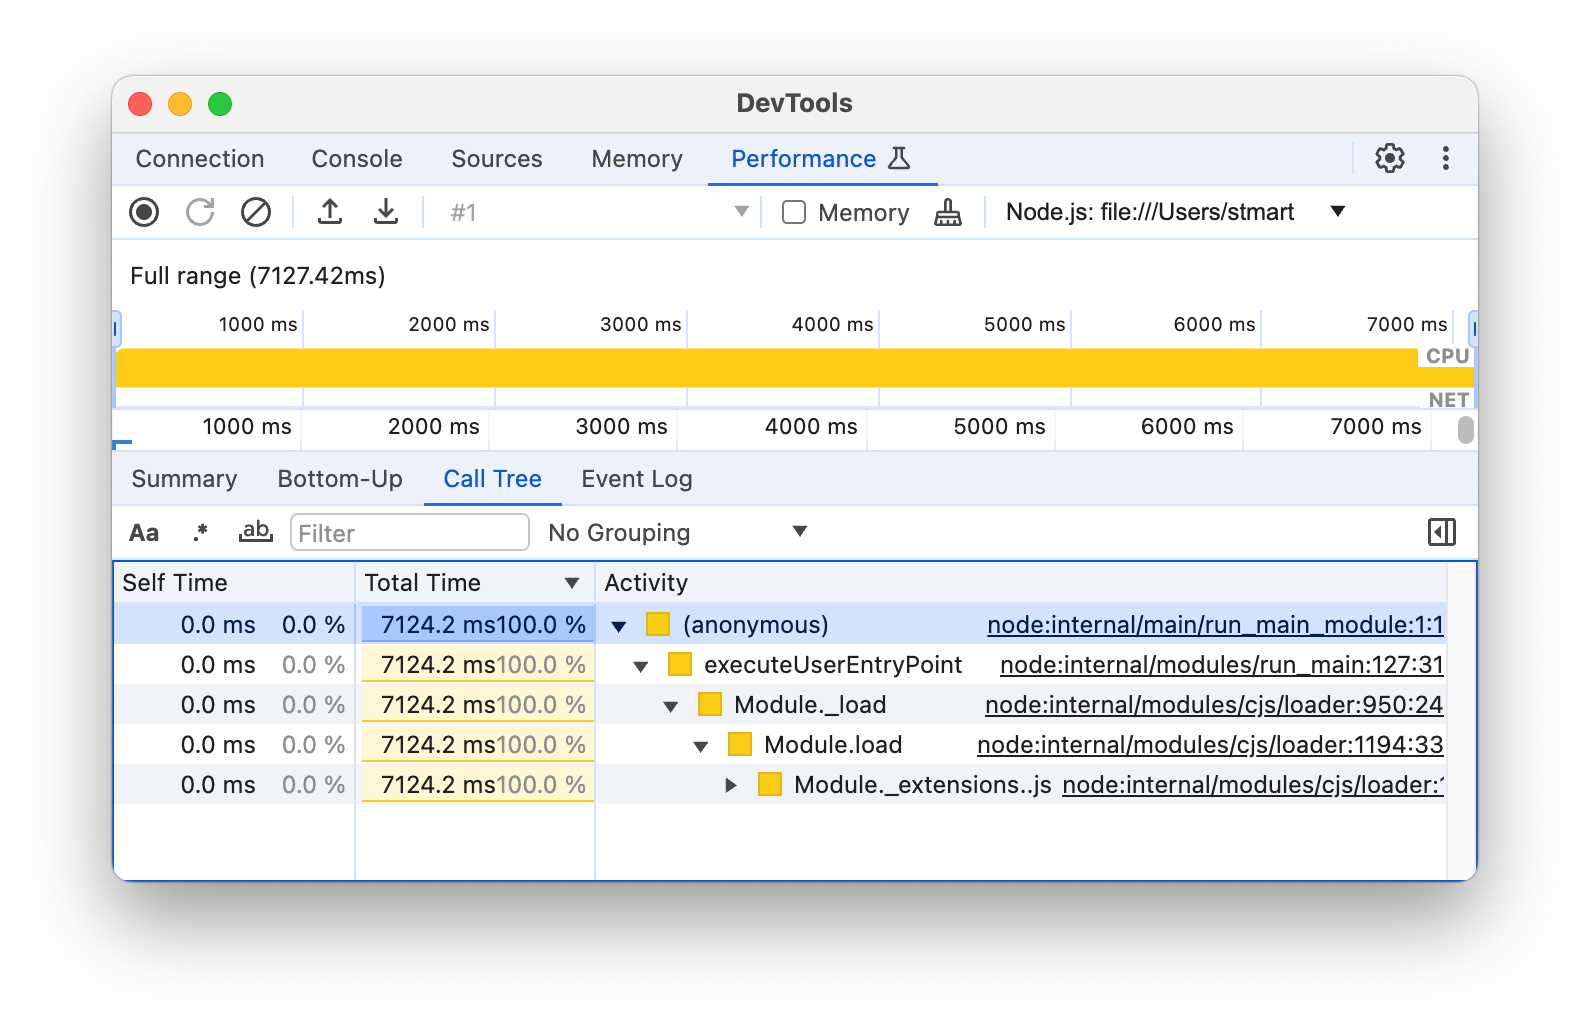
Call Tree: This tab displays the root activities of a selected portion of the recording. Root activities also have their call stacks nested. Use this tab to identify which activity is causing the most work.
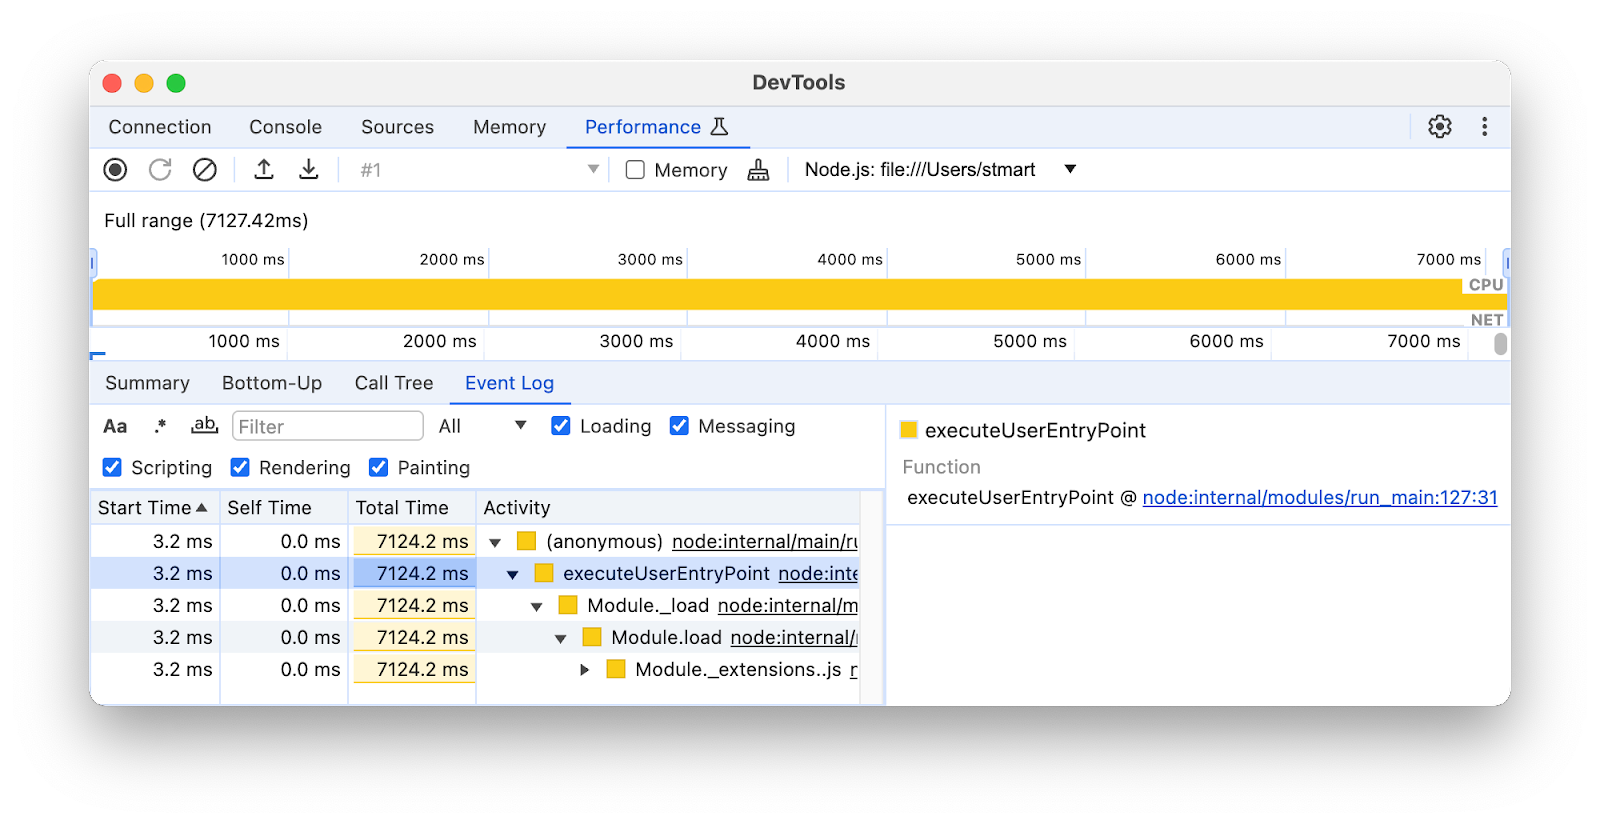
Event Log: This tab lists activities from a selected portion of the recording in the order that they occurred.
Profile with the console.profile() command
DevTools lets you profile JavaScript CPU performance with the console.profile() command. You can add this command to your code and then run the file, or copy and paste your code into the Console. The Performance panel will show you the results.
To use this command, follow these steps:
Enclose your code with
console.profile()andconsole.profileEnd(), for example:console.profile( profile ${i} ); // Code to be profiled doSomething(); console.profileEnd();Run your code in one of two ways:
If you're using the Console, open DevTools for Node, paste your code to the Console, and press Enter.
In the command line, run:
Node.js
node --inspect file-name.jsDeno
deno --inspect file-name.jsThen open DevTools for Node.
Once the profile is completed, the result will be shown in the Performance panel automatically.


