


總覽
除了瀏覽器內建指標,您是否想進一步深入瞭解應用程式效能?您現在可以透過「成效」面板,將自己的成效資料直接匯入時間軸。無論您是需要將內部程序視覺化的架構作者、追蹤程式碼影響的程式庫開發人員,還是使用自訂檢測設備建構複雜應用程式,效能可擴充 API 都提供工具,讓您能真正全面瞭解幕後發生的一切。
只要插入自訂評估和事件,即可在熟悉的「成效」面板中建立客製化視覺化資料。您可以查看架構的元件生命週期事件和標準瀏覽器效能指標,或是追蹤自訂轉譯引擎的執行流程,以便與瀏覽器的轉譯管道完美同步。
這個 API 提供兩種方法來達成這項目標:
1. console.timeStamp API (針對 DevTools 擴充)
這個 API 提供高效能方法,可用於檢測應用程式,並將計時資料專門顯示在 DevTools 的「Performance」面板中。這項工具旨在盡量減少執行階段的額外負擔,因此非常適合用於檢測熱門路徑和正式版版本。不會在瀏覽器的內部效能時間軸中新增項目。
2. User Timings API (使用 performance.mark 和 performance.measure)
這個 API 會運用現有的 User Timings API。這項工具也會在瀏覽器的內部效能時間表中新增項目,方便進一步分析並整合其他效能工具。
主要優點
這兩個 API 都提供以下功能:
- 自訂追蹤:新增專屬追蹤和追蹤群組,代表程式碼的獨特效能面向。
- 項目:在這些軌跡中填入項目,清楚標示重要事件或特定作業的時間長度。
- 自訂顏色:使用顏色標示,一目瞭然地區分不同類型的事件或評估。
根據需求選擇適當的 API:
console.timeStampAPI:- 檢測工具對效能的影響是主要考量因素,尤其是在正式版版本中。
- 您需要快速且有效率的方式來標記時間長度或事件,而不需要額外中繼資料。
- 您只需要在「成效」面板中顯示資料。
User Timings API (
performance.mark、performance.measure):- 當您需要為每個項目儲存額外資料,且已使用 User Timings API 時,請使用此方法。
- 您必須將豐富資料 (工具提示、詳細屬性) 與成效項目建立關聯。
- 你想加入視覺標記,醒目顯示特定片段。
- 您需要的資料不僅要在 DevTools 中提供,也要在瀏覽器的內部效能時間軸中提供,以便進行更廣泛的分析或使用其他工具。
- 您已熟悉或使用 User Timings API。
使用 console.timeStamp 插入資料
擴充 console.timeStamp API,可在「Performance」面板中建立自訂時間戳記項目,且不增加太多額外負擔,特別是在 DevTools 未記錄追蹤記錄時。
console.timeStamp(label: string, start?: string|number, end?: string|number, trackName?: string, trackGroup?: string, color?: DevToolsColor);
label:時間標記的標籤。
start(選用):如果定義為字串:先前記錄的時間戳記名稱 (使用
console.timeStamp(timeStampName))。如果定義為數字:以毫秒為單位的時間戳記,相對於 Performance.timeOrigin (例如,使用
performance.now()擷取),代表計時項目的開始時間。如果未定義,系統會使用目前的時間做為開始時間。
end:如果定義為字串:先前記錄的時間戳記名稱。
如果定義為數字:以 Performance.timeOrigin 為基準的時間戳記 (以毫秒為單位),例如透過
performance.now()取得,代表計時項目的結束時間。如果未定義,系統會使用目前時間做為結束時間。
trackName:自訂軌道的名稱。
trackGroup:曲目群組的名稱。
color:項目的顏色。
使用 User Timings API 插入資料
如要插入自訂資料,請在 performance.mark 和 performance.measure 方法的 detail 屬性中加入 devtools 物件。這個 devtools 物件的結構會決定資料在「成效」面板中的顯示方式。
使用
performance.mark在時間軸上記錄即時事件或時間戳記。您可以標示特定作業的開始或結束時間,或是任何沒有時間長度的重要事件。在detail屬性中加入devtools物件後,「Performance」面板會在「Timings」軌跡中顯示自訂標記。使用
performance.measure測量工作或程序的時間長度。在detail屬性中加入devtools物件後,「成效」面板會在自訂軌跡的時間軸中顯示自訂評估項目。如果您使用performance.mark做為參考點來建立performance.measure,就不需要在performance.mark呼叫中加入devtools物件。
devtools 個物件
這些類型會定義不同擴充功能的 devtools 物件結構:
type DevToolsColor =
  "primary" | "primary-light" | "primary-dark" |
  "secondary" | "secondary-light" | "secondary-dark" |
  "tertiary" | "tertiary-light" | "tertiary-dark" |
  "error";

interface ExtensionTrackEntryPayload {
  dataType?: "track-entry"; // Defaults to "track-entry"
  color?: DevToolsColor;    // Defaults to "primary"
  track: string;            // Required: Name of the custom track
  trackGroup?: string;      // Optional: Group for organizing tracks
  properties?: [string, string][]; // Key-value pairs for detailed view
  tooltipText?: string;     // Short description for tooltip
}

interface ExtensionMarkerPayload {
  dataType: "marker";       // Required: Identifies as a marker
  color?: DevToolsColor;    // Defaults to "primary"
  properties?: [string, string][]; // Key-value pairs for detailed view
  tooltipText?: string;     // Short description for tooltip
}
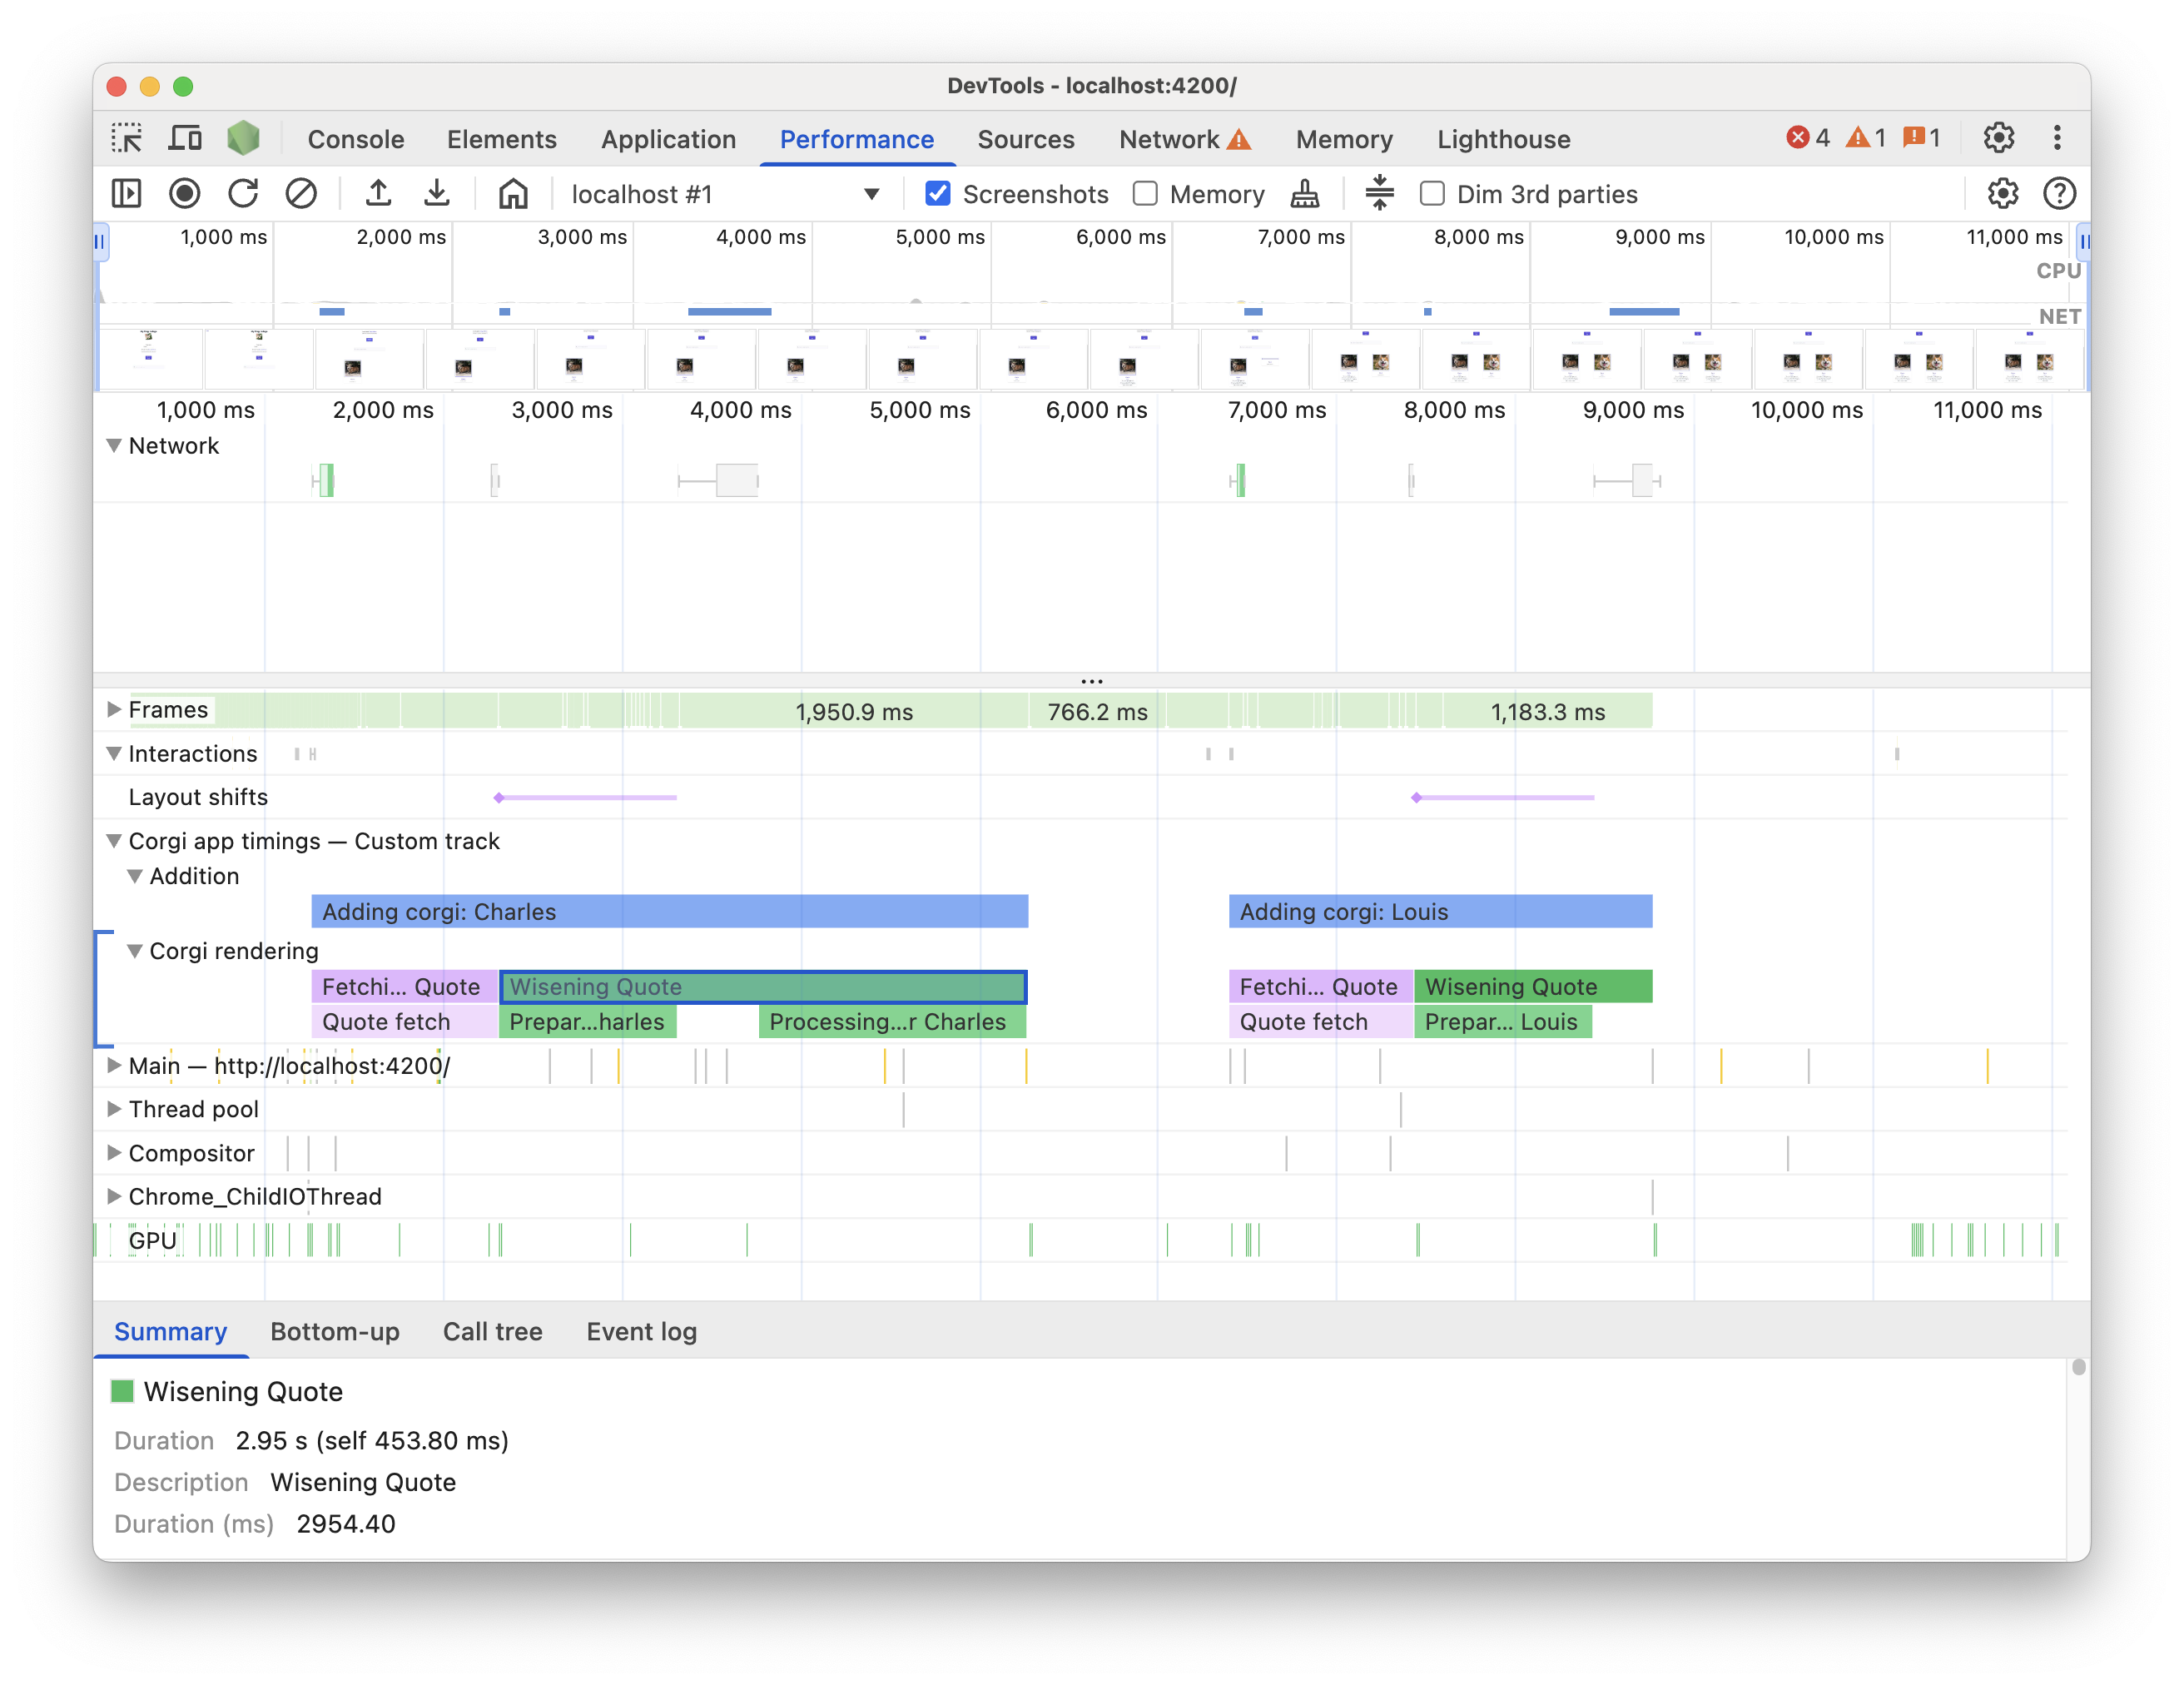
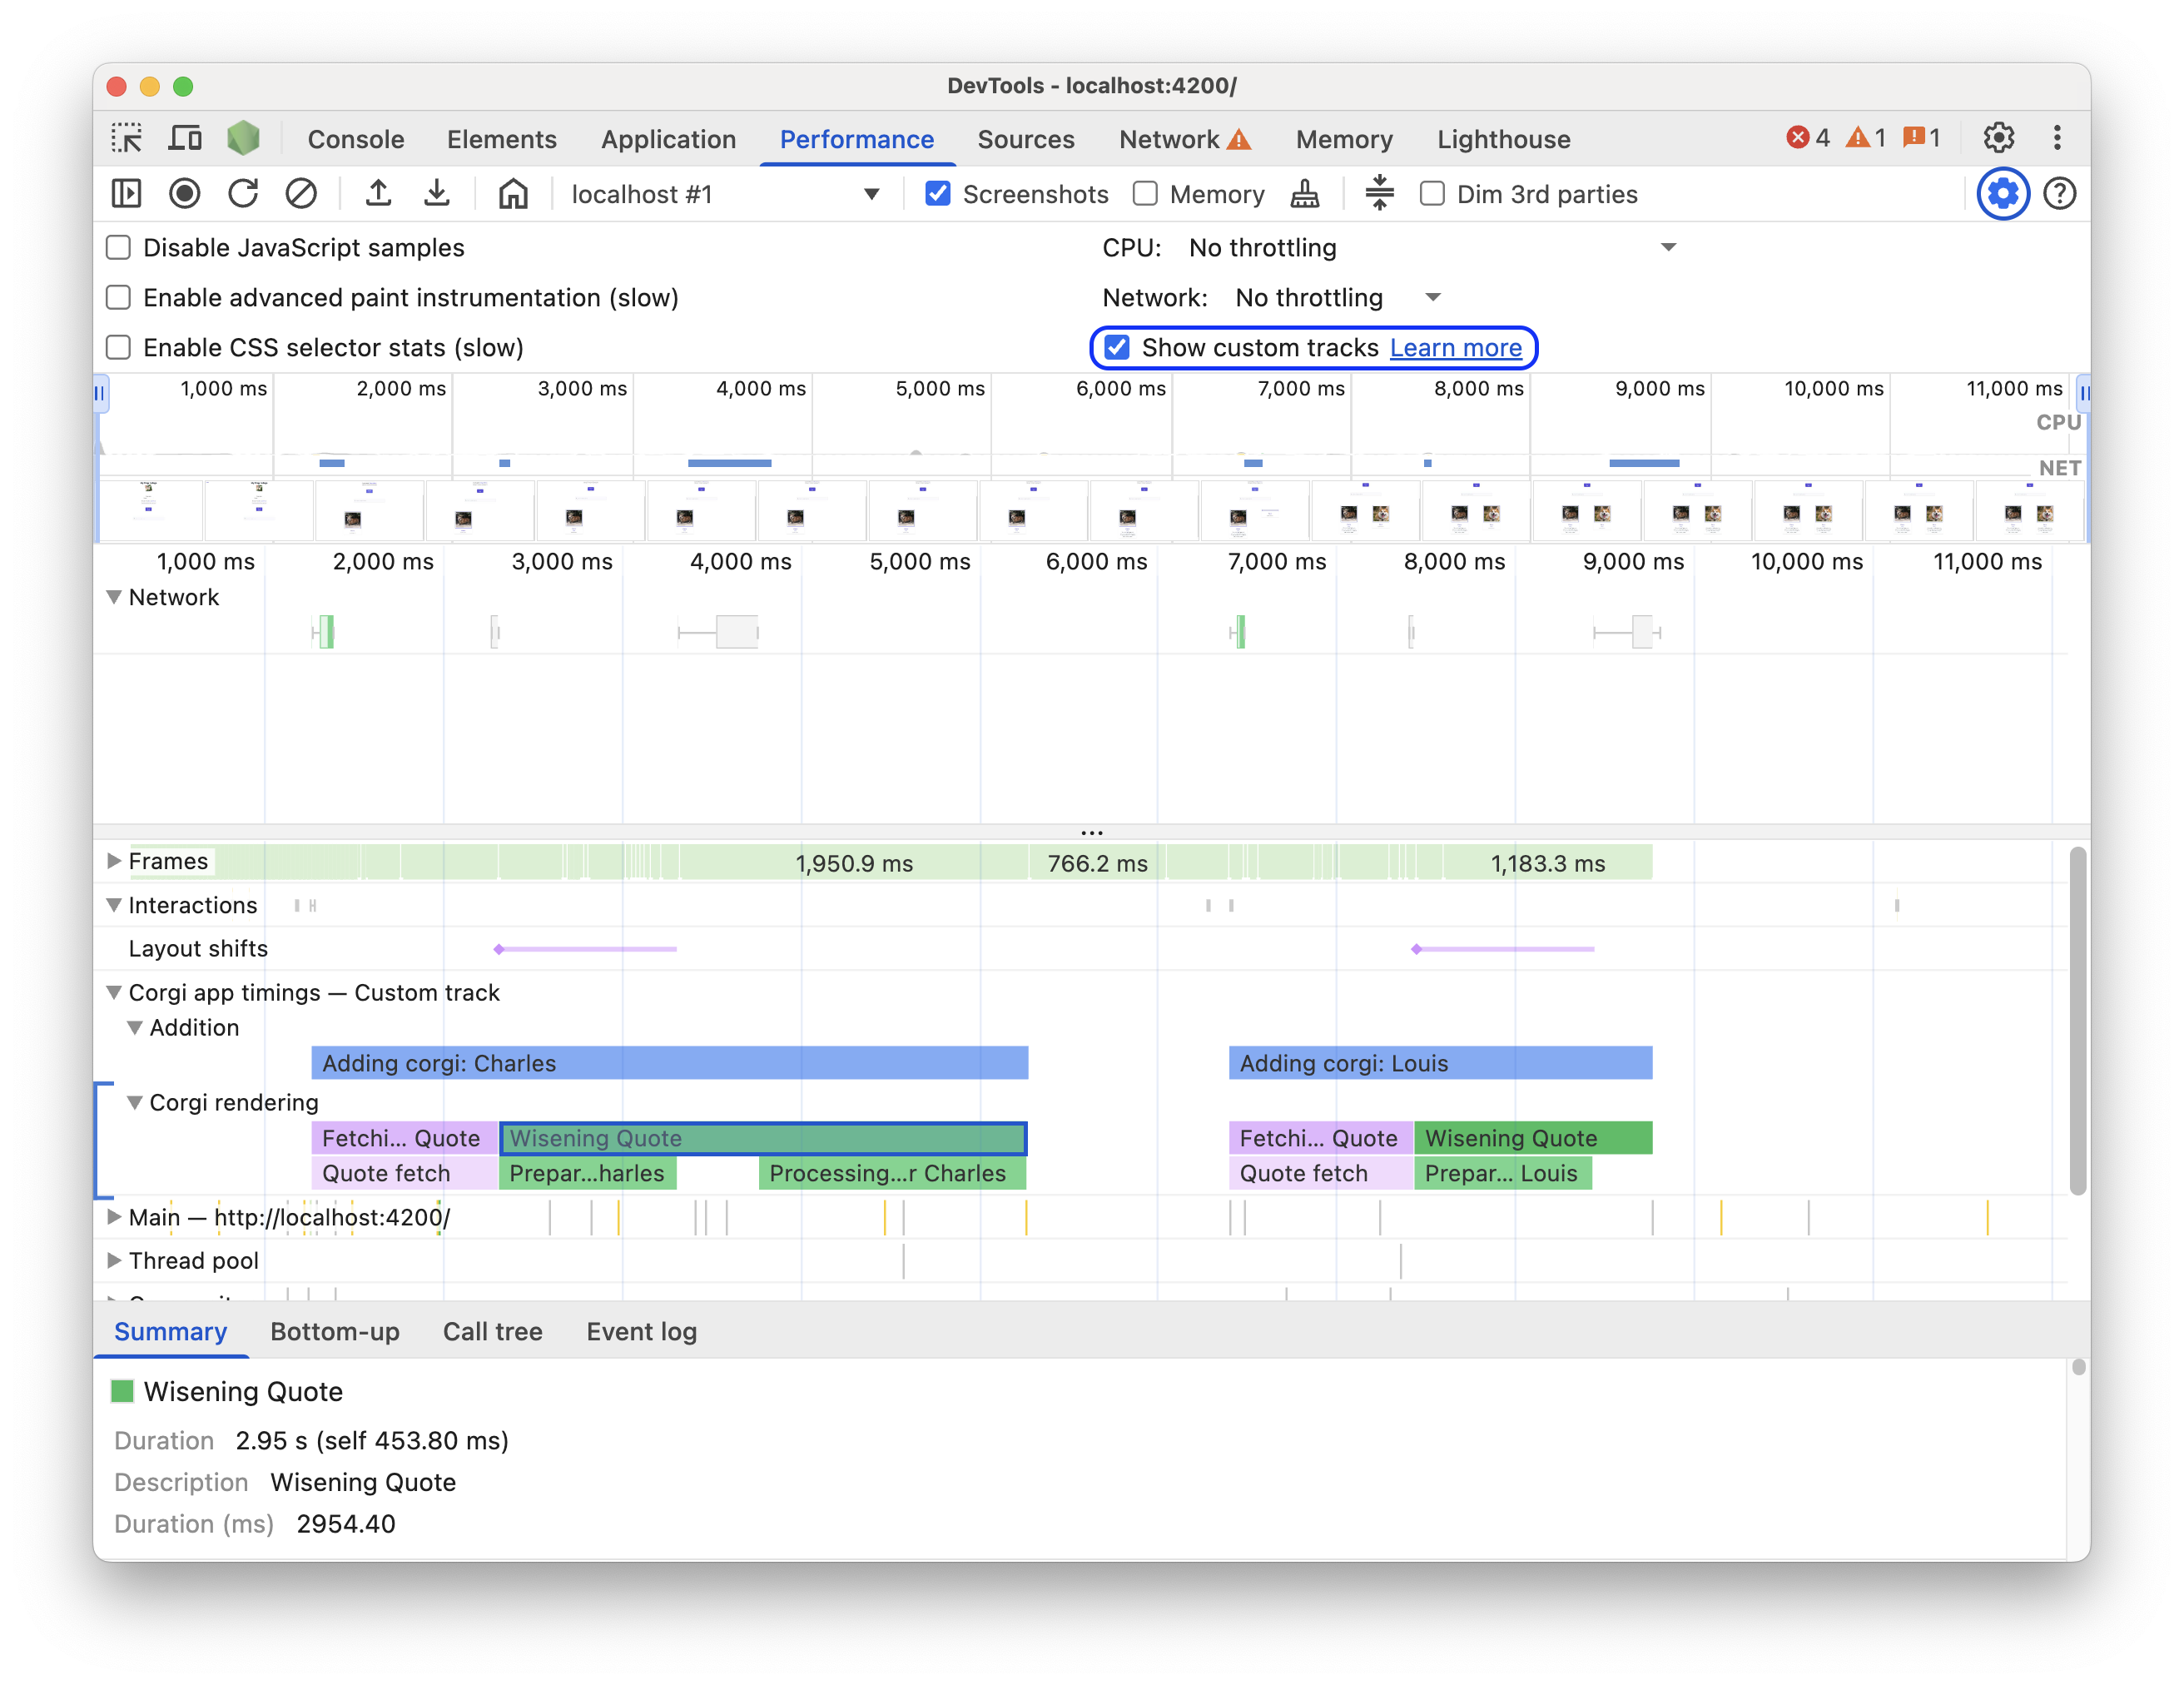
在時間軸上查看資料
如要在時間軸上查看自訂資料,請在「Performance」面板中確認已開啟以下設定:「Capture settings」 >「check_box」「Show custom tracks」。
歡迎前往這個示範頁面試用。開始錄製效能,按一下示範頁面上的「Add new Corgi」,然後停止錄製。您會在追蹤記錄中看到自訂軌跡,其中包含事件,並在「摘要」分頁中顯示自訂工具提示和詳細資料。
程式碼範例
以下列舉幾個範例,說明如何使用 API 透過各項可用機制,將您自己的資料新增至「成效」面板。
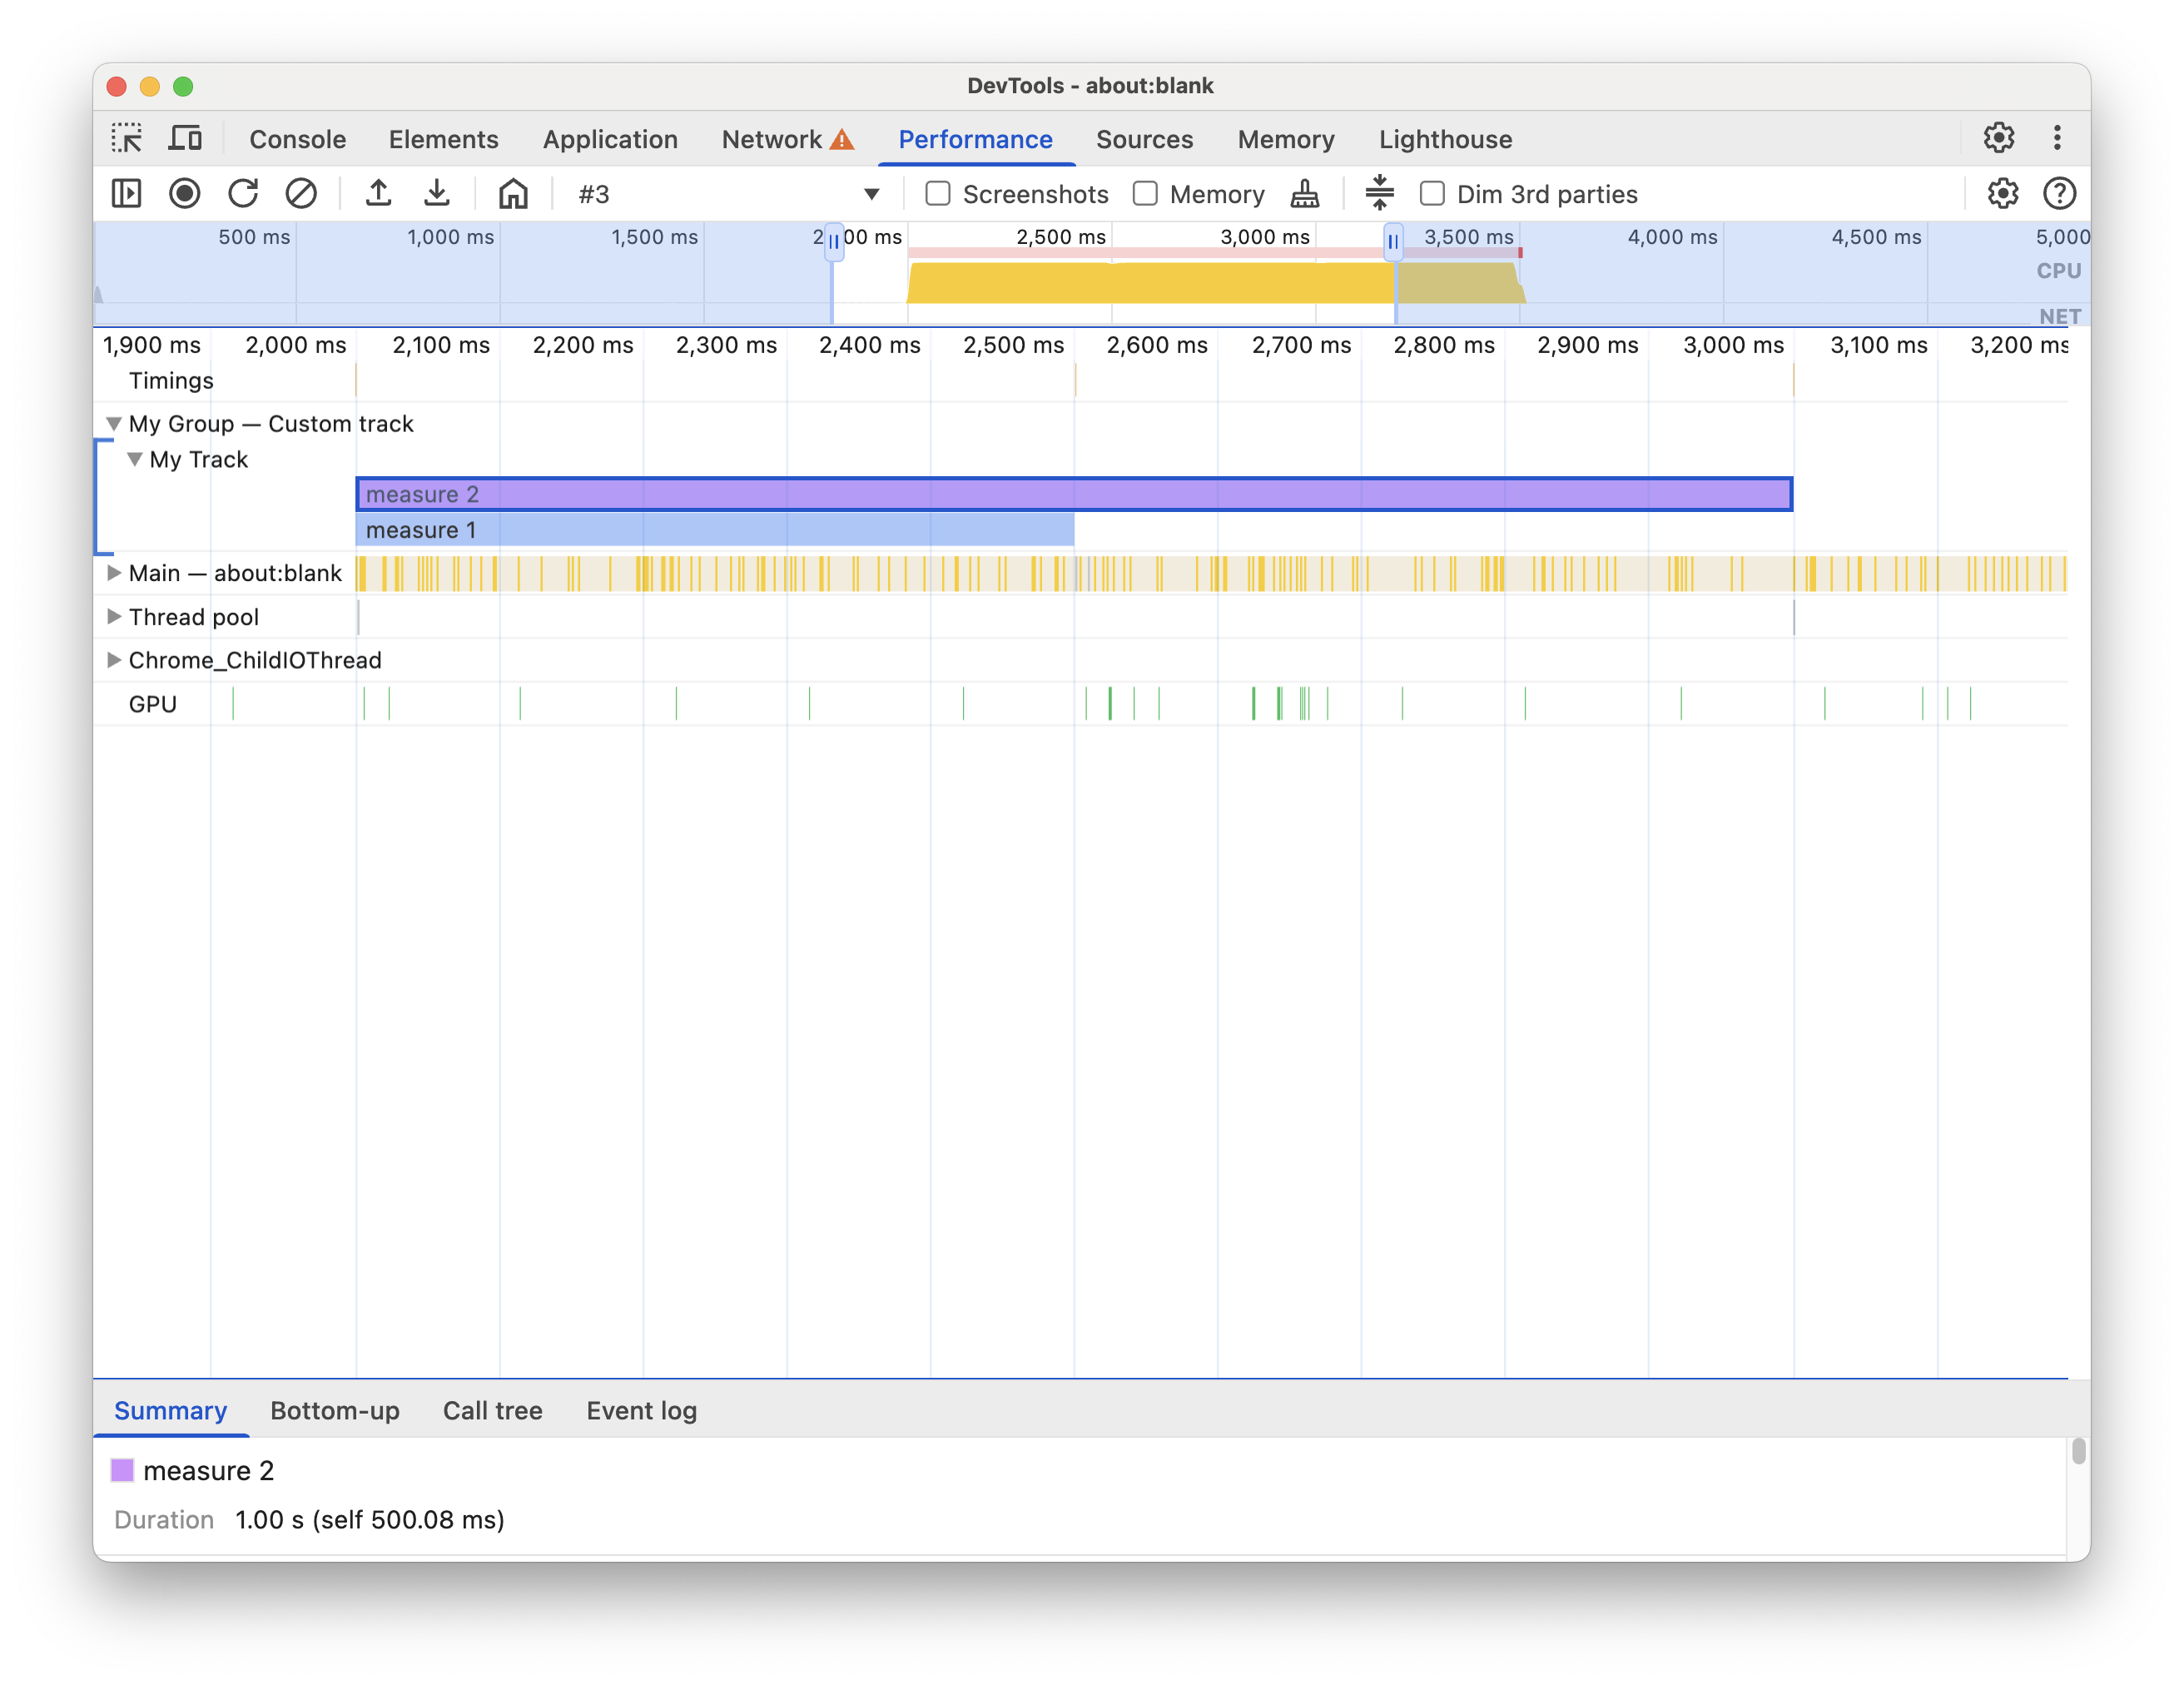
console.timeStamp API 範例:
// Take a start timestamp
const start = performance.now();

// Measure duration from start to now
console.timeStamp("measure 1", start, undefined, "My Track", "My Group", "primary-light");

// Take an end timestamp
const end = performance.now();

// Measure duration from start to end
console.timeStamp("measure 2", start, end, "My Track", "My Group", "secondary-dark");
這會在成效時間軸中產生下列自訂追蹤項目:
User Timings API 範例:
在後續章節中,您可以參考程式碼範例,瞭解如何在效能時間軸中新增下列項目:
自訂曲目和項目
建立自訂追蹤,並填入項目,以便在自訂追蹤中以圖表呈現成效資料。例如:
// Mark used to represent the start of the image processing task
// The start time is defaulted to now
const imageProcessinTimeStart = performance.now();

// ... later in your code

// Track entry representing the completion of image processing
// with additional details and a tooltip
// The start time is a marker from earlier
// The end time is defaulted to now
performance.measure("Image Processing Complete", {
  start: imageProcessinTimeStart,
  detail: {
    devtools: {
      dataType: "track-entry",
      track: "Image Processing Tasks",
      trackGroup: "My Tracks", // Group related tracks together
      color: "tertiary-dark",
      properties: [
        ["Filter Type", "Gaussian Blur"],
        ["Resize Dimensions", "500x300"]
      ],
      tooltipText: "Image processed successfully"
    }
  }
});
這會在成效時間軸中產生下列自訂追蹤項目,以及相關工具提示文字和屬性:

標記
使用跨越所有音軌的自訂標記,在時間軸上視覺化突顯特定興趣點。例如:
// Marker indicating when the processed image was uploaded
performance.mark("Image Upload", {
  detail: {
    devtools: {
      dataType: "marker",
      color: "secondary",
      properties: [
        ["Image Size", "2.5MB"],
        ["Upload Destination", "Cloud Storage"]
      ],
      tooltipText: "Processed image uploaded"
    }
  }
});
這會在「Timings」軌道中產生下列標記,以及相關的工具提示文字和屬性:
