Keep your client-side code readable and debuggable even after you've combined, minified or compiled it. Use source maps to map your source code to your compiled code in the Sources panel.
Get started with preprocessors
Source maps from preprocessors cause DevTools to load your original files in addition to your minified ones.
Chrome will actually run your minified code but the Sources panel will show you the code you author. You can set breakpoints and step through code in source files and all the errors, logs, and breakpoints will automatically map.
This gives you the appearance of debugging the code as you wrote it, as opposed to code that is served by your development server and executed by the browser.
To use source maps in the Sources panel:
- Use only the preprocessors that can produce source maps.
- Verify that your web server can serve source maps.
Use a supported preprocessor
Common preprocessors used in combination with source maps include but aren't limited to:
- Transpilers: Babel
- Compilers: TypeScript and Dart
- Minifiers: terser
- Bundlers and development servers: Webpack, Vite, esbuild, and Parcel
For an extended list, see Source maps: Languages, tools, and other info.
Enable source maps in Settings
In Settings > Preferences > Sources, make sure to check
JavaScript source maps.
Check if source maps loaded successfully
See Developer Resources: View and load source maps manually.
Debugging with source maps
With source maps ready and enabled, you can do the following:
- Open your website's sources in the Sources panel.
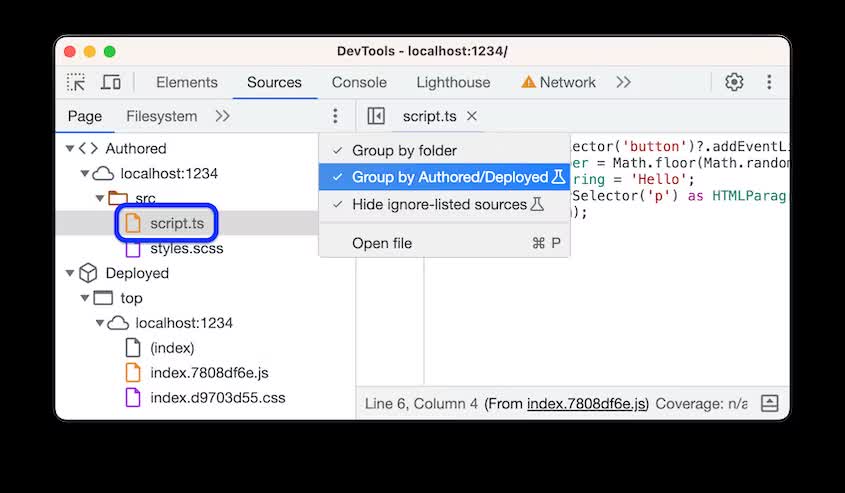
To focus only on the code you author, group authored and deployed files in the file tree. Then expand the
Authored section and open your original source file in the Editor.
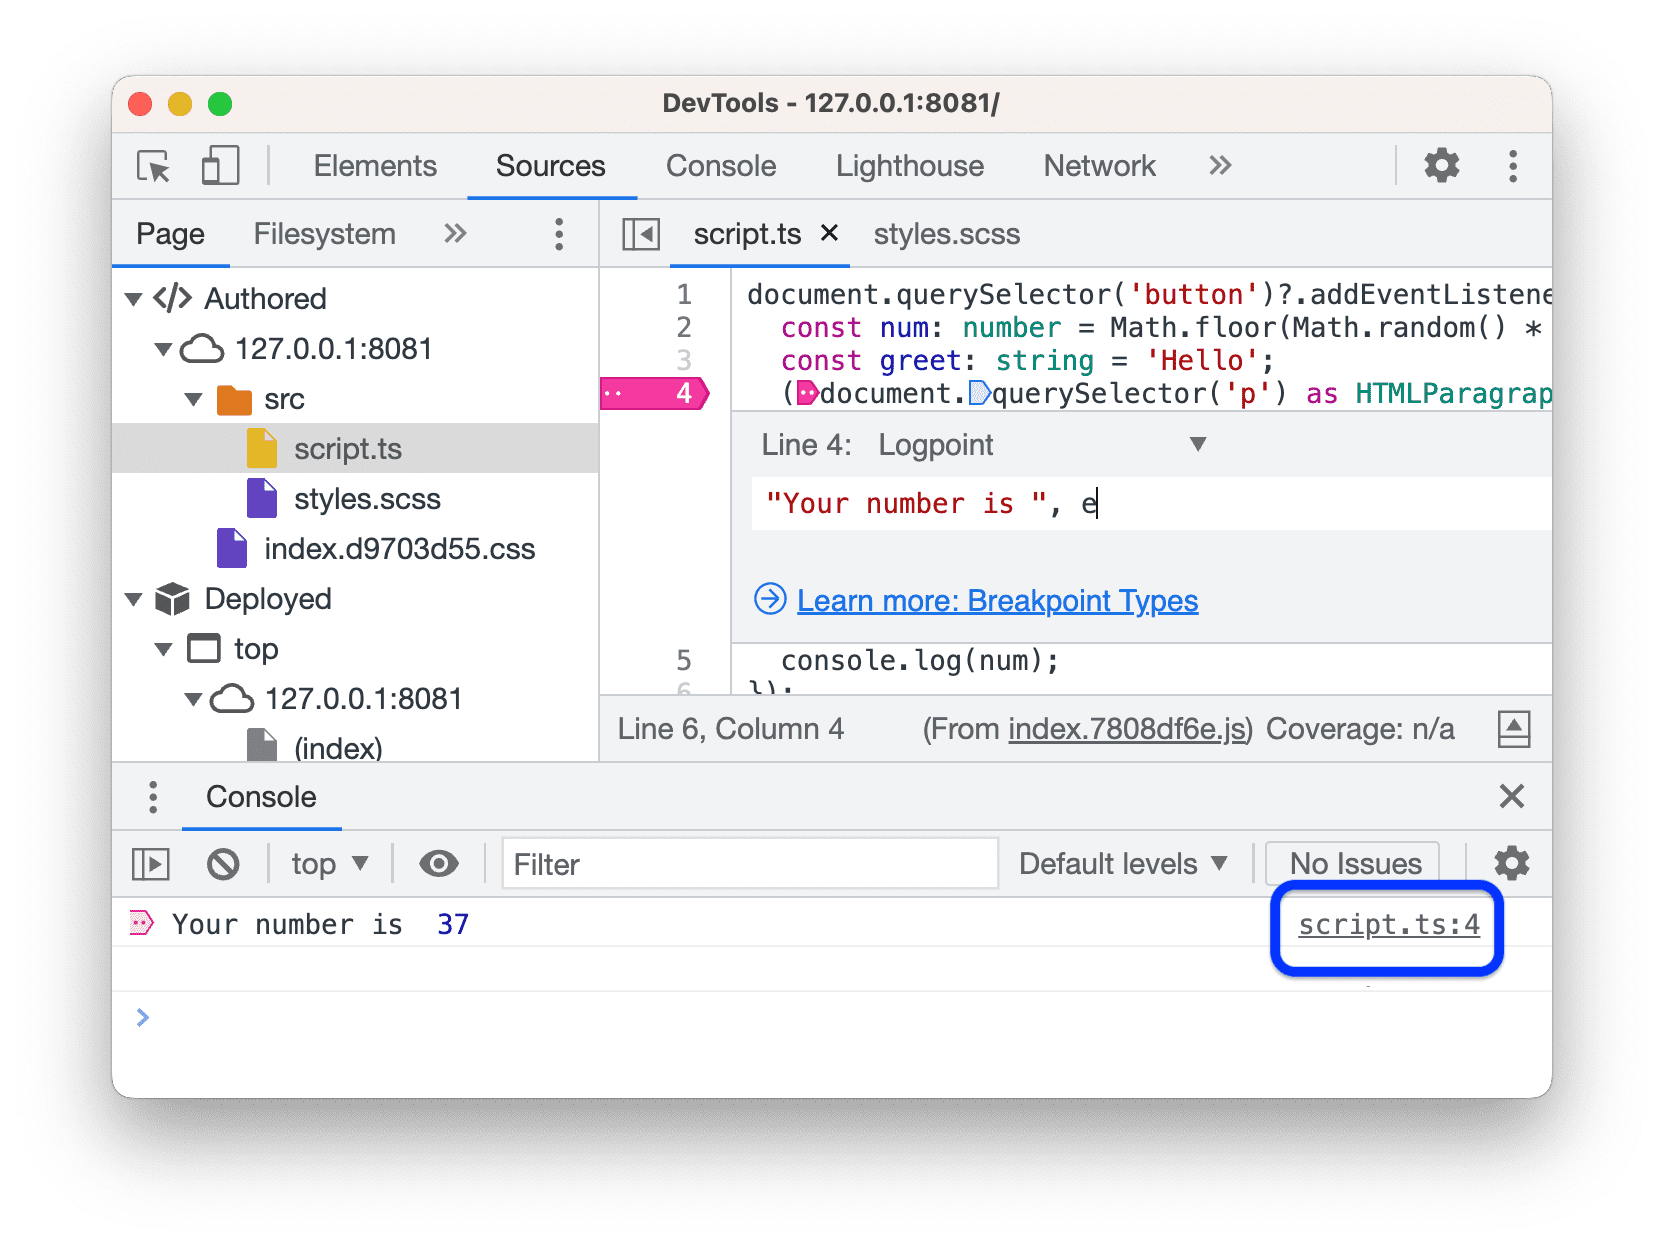
Set a breakpoint as you normally would. For example, a logpoint. Then run the code.
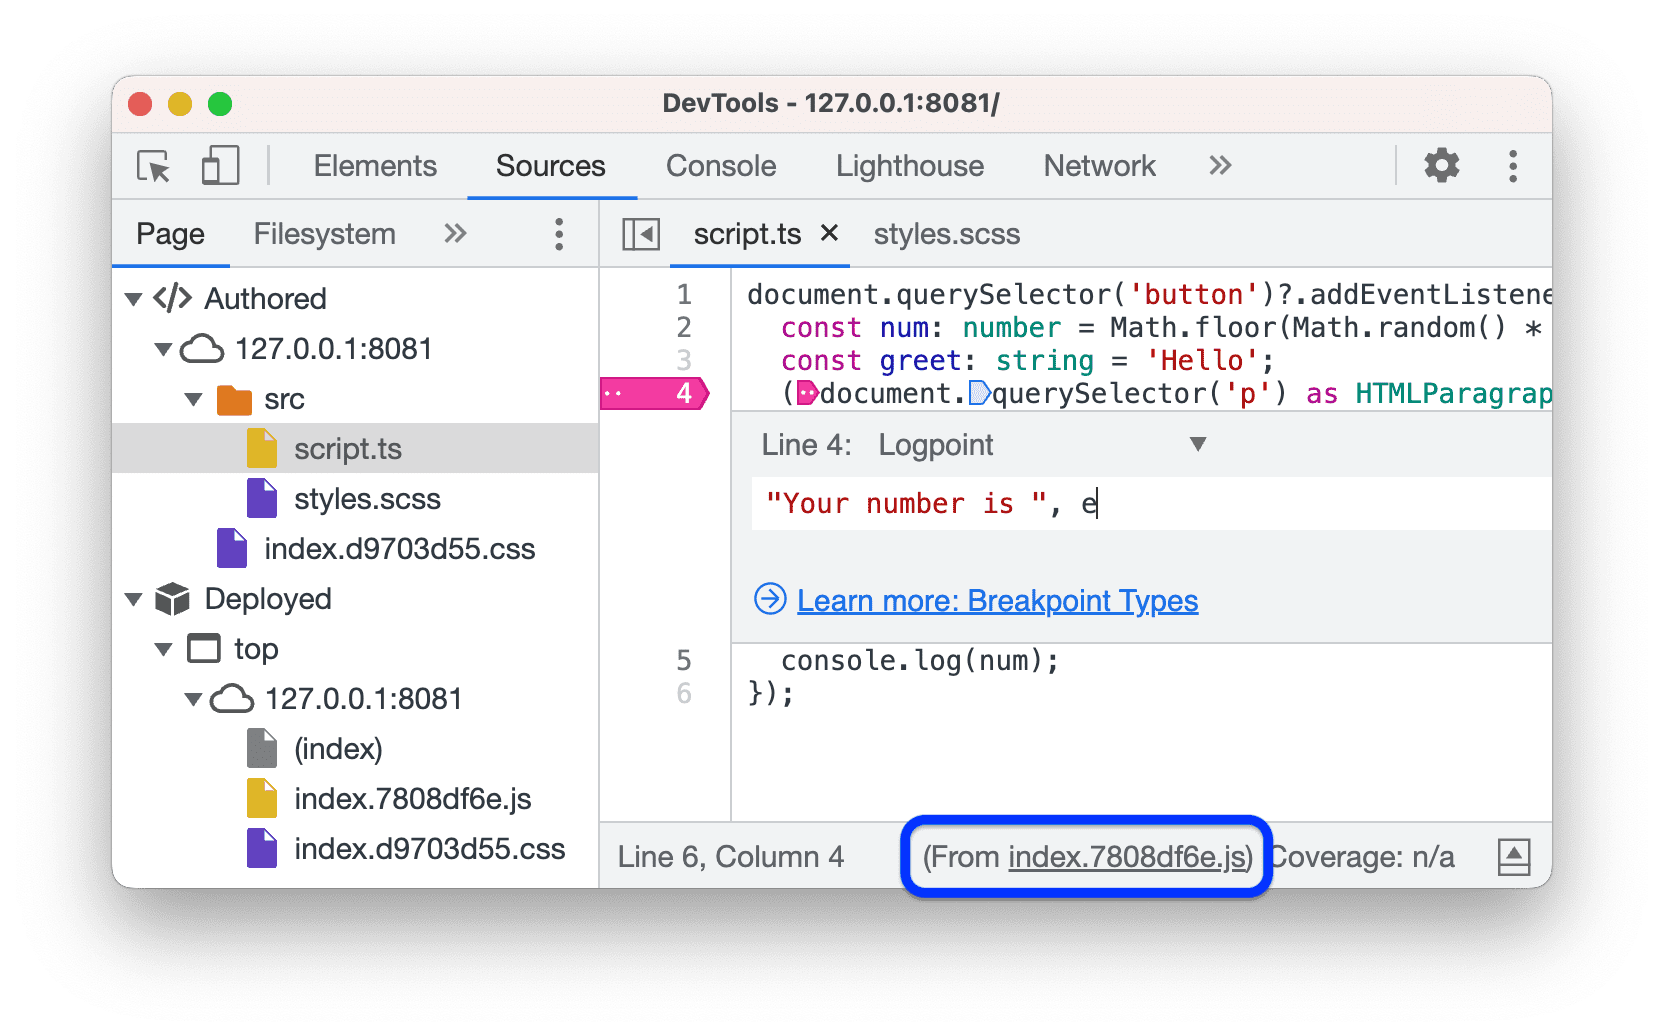
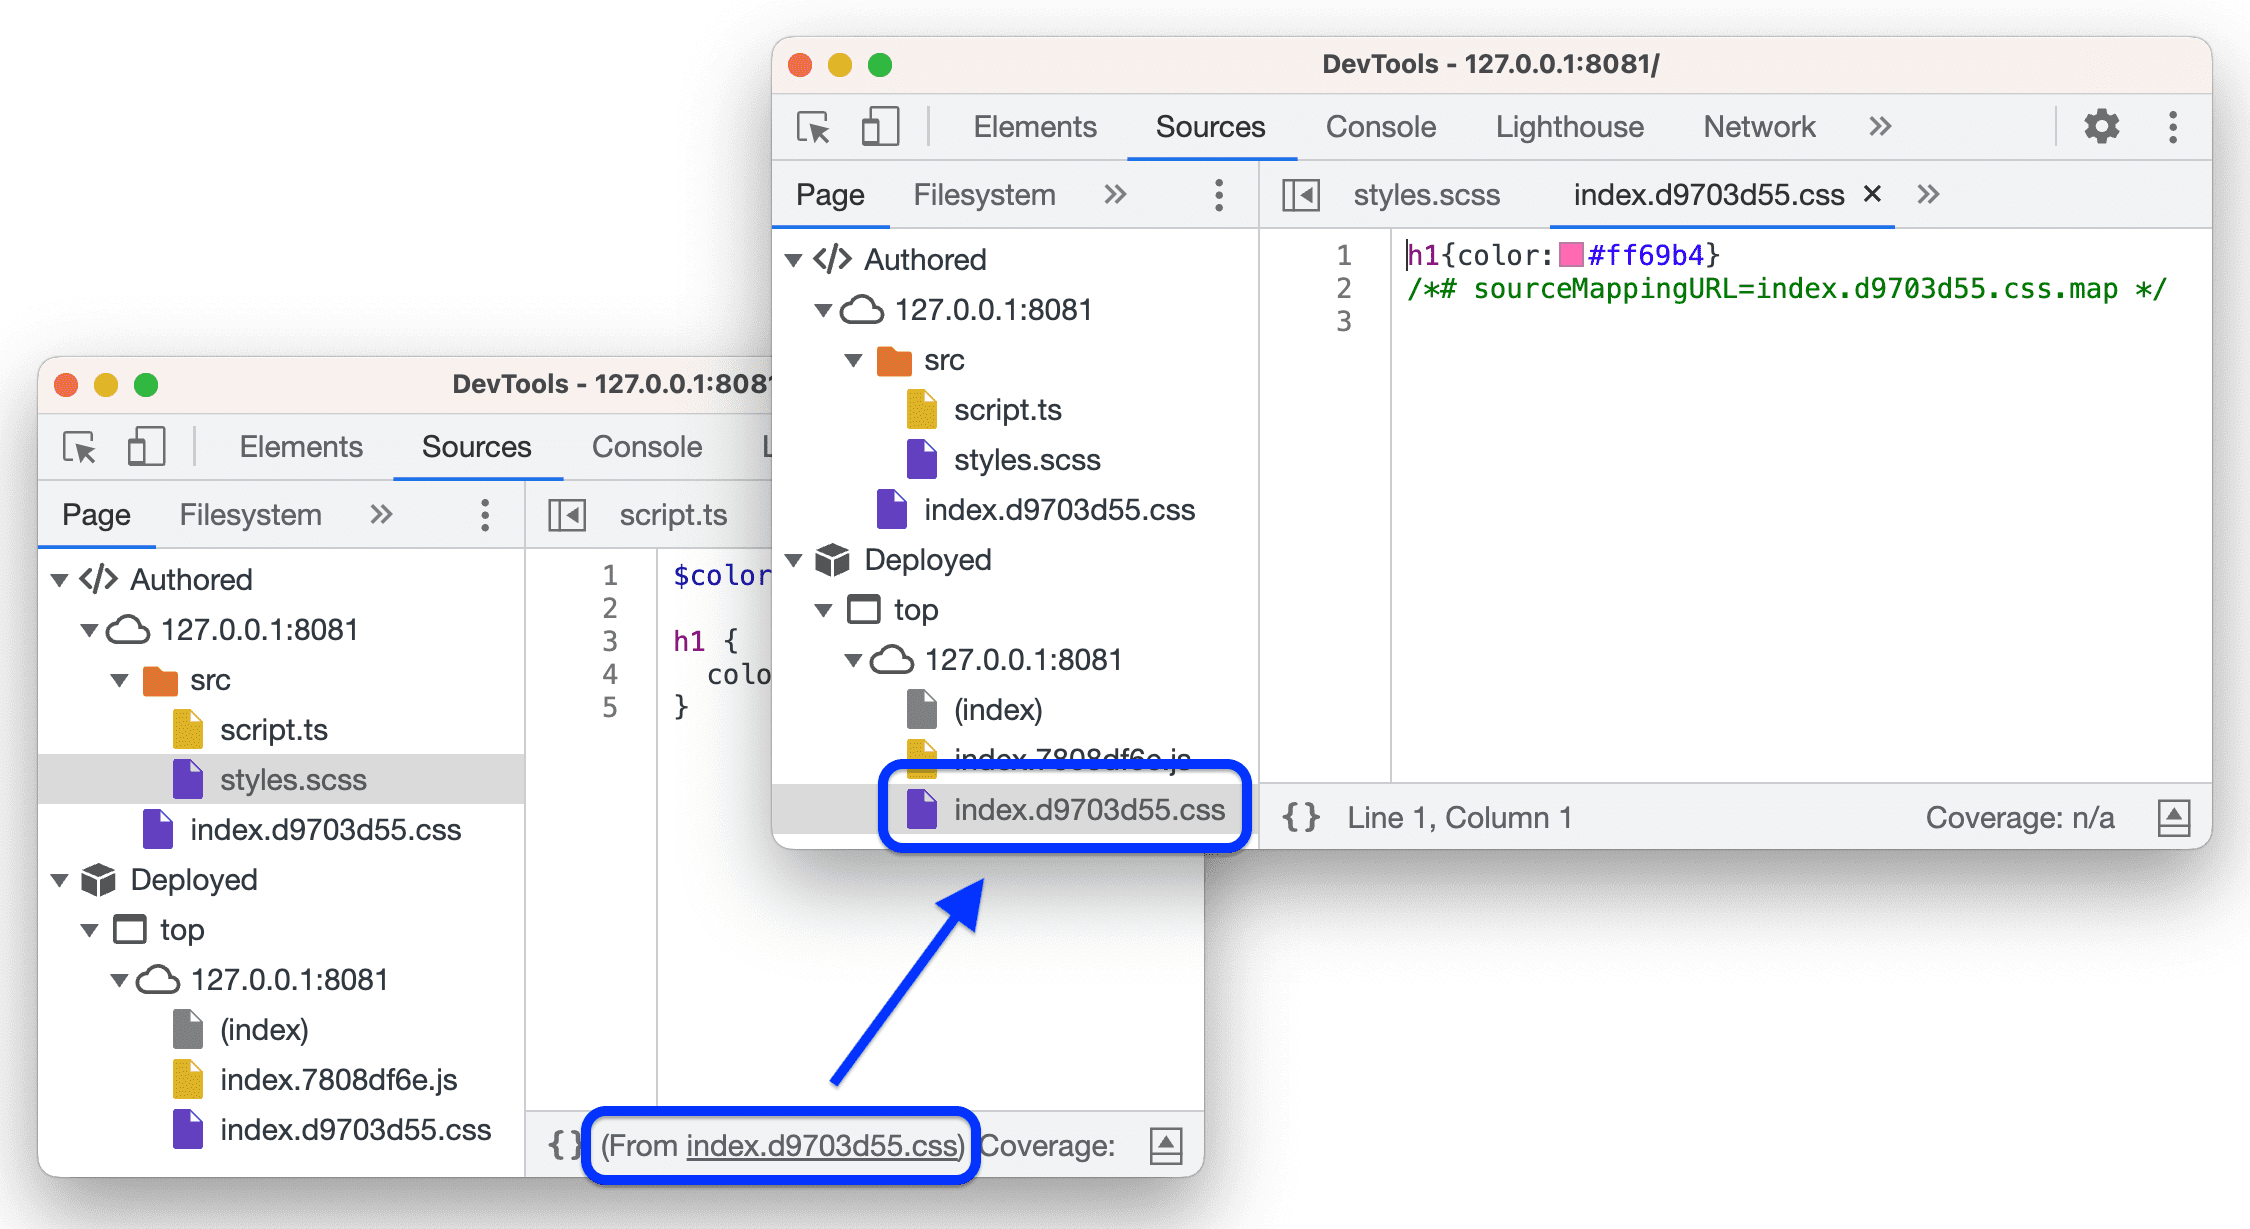
Notice that the Editor puts a link to the deployed file in the status bar at the bottom. Similarly, it does so for deployed CSS files.
Open the Console drawer. In this example, next to the logpoint's message, the Console shows a link to the original file, not the deployed one.
Change the breakpoint type to a regular one and run the code again. The execution pauses this time.
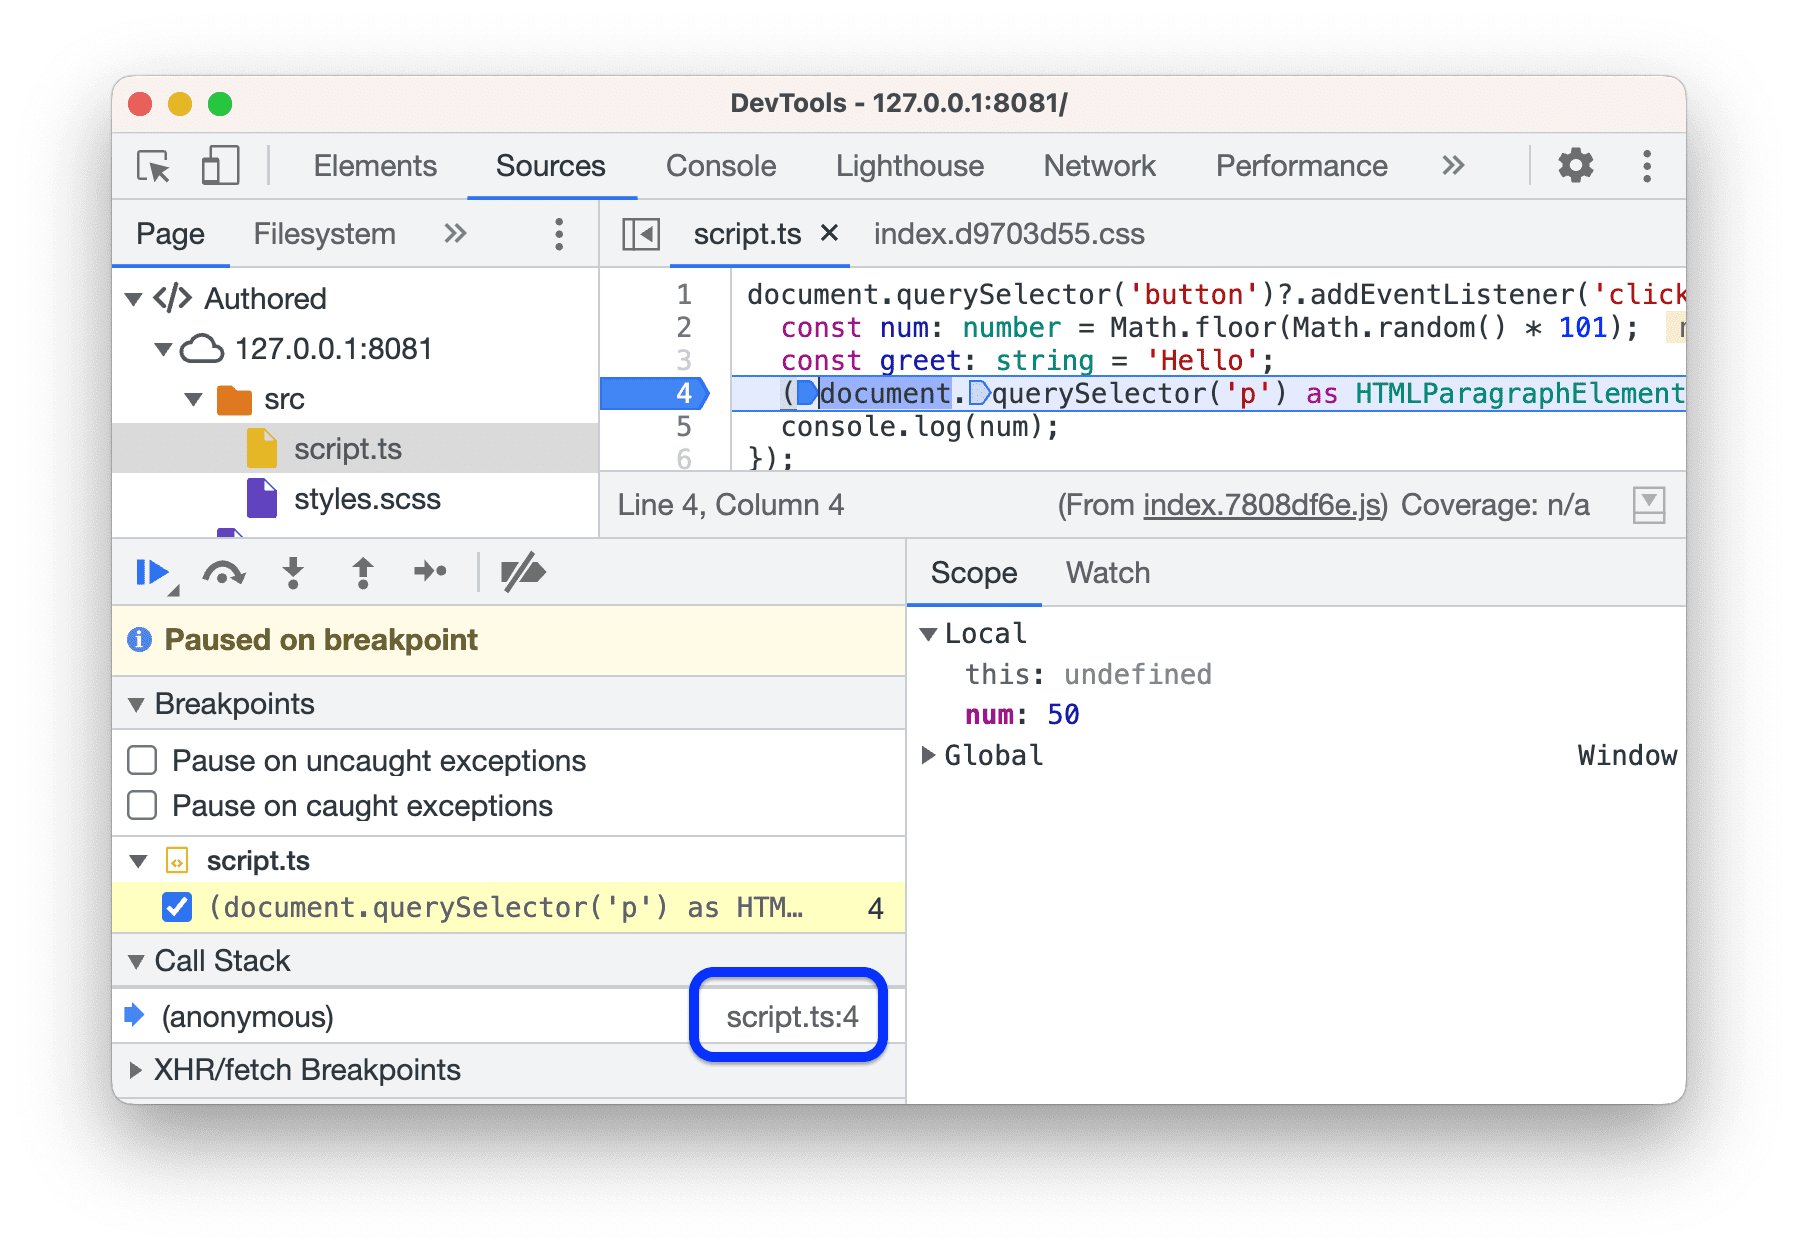
Notice that the Call Stack pane shows the name of the original file and not the deployed one.
In the status bar at the bottom of the Editor, click the link to the deployed file. The Sources panel takes you to the corresponding file.
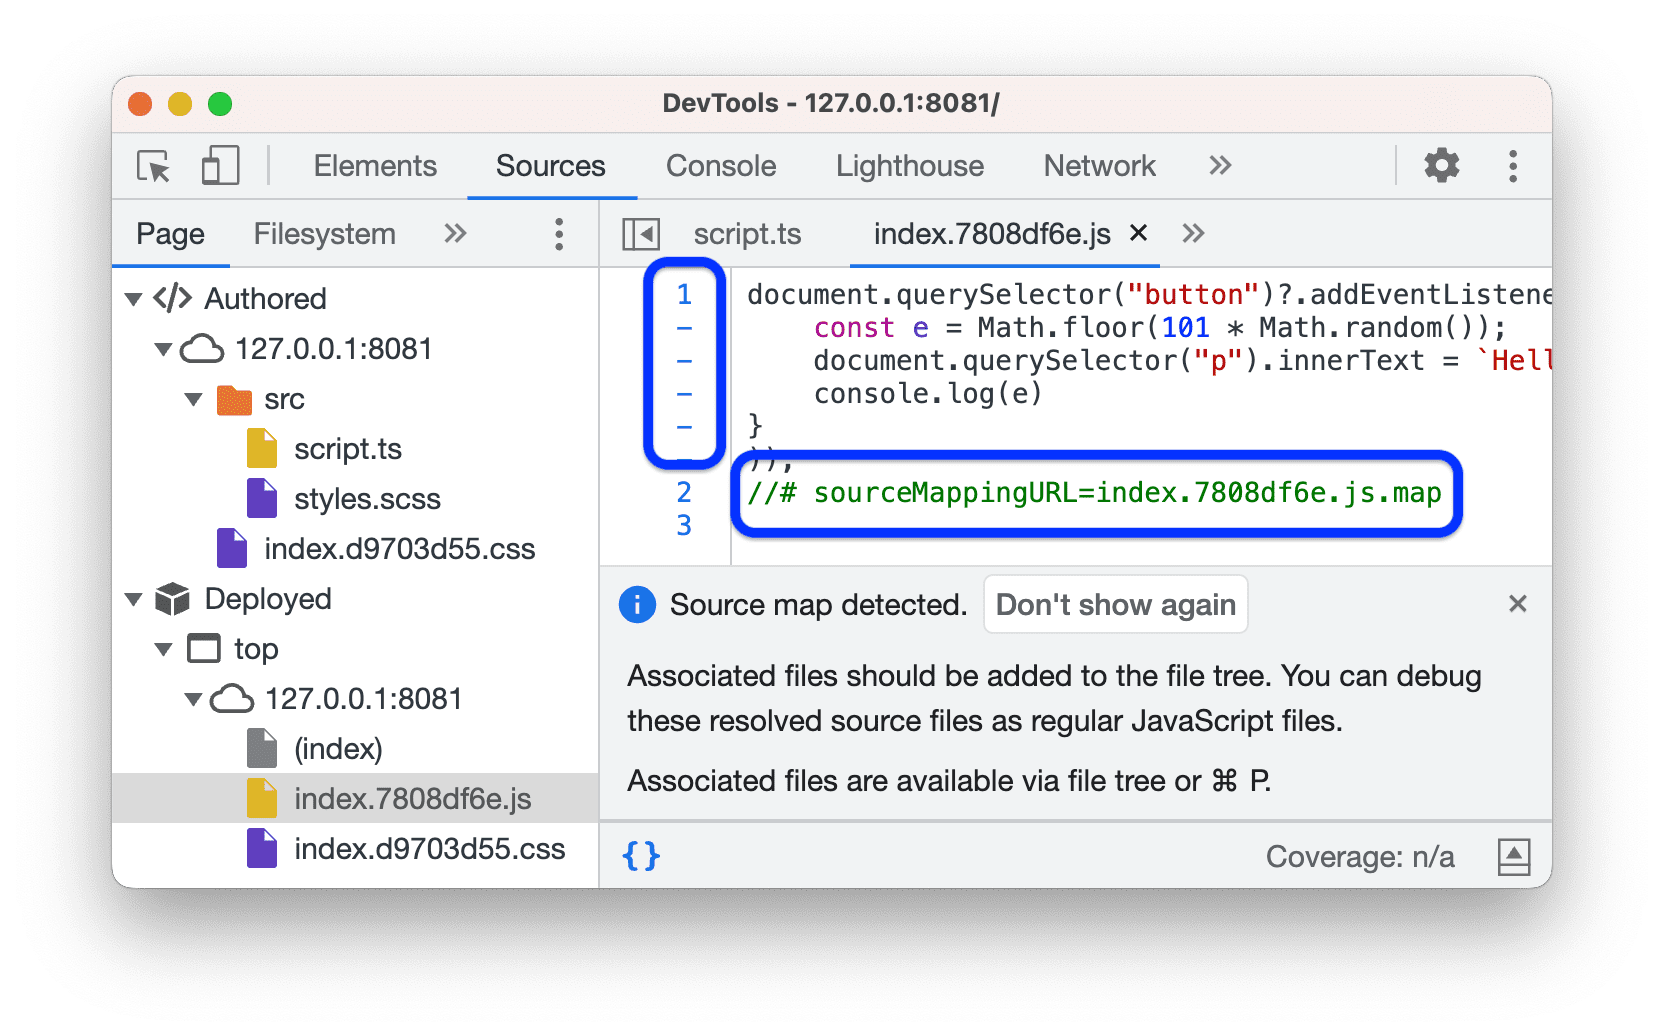
When you open any deployed file, DevTools notifies you if it found the //# sourceMappingURL comment and the associated original file.
Notice that the Editor automatically pretty-printed the deployed file. In reality, it contains all the code in a single line, except for the //# sourceMappingURL comment.
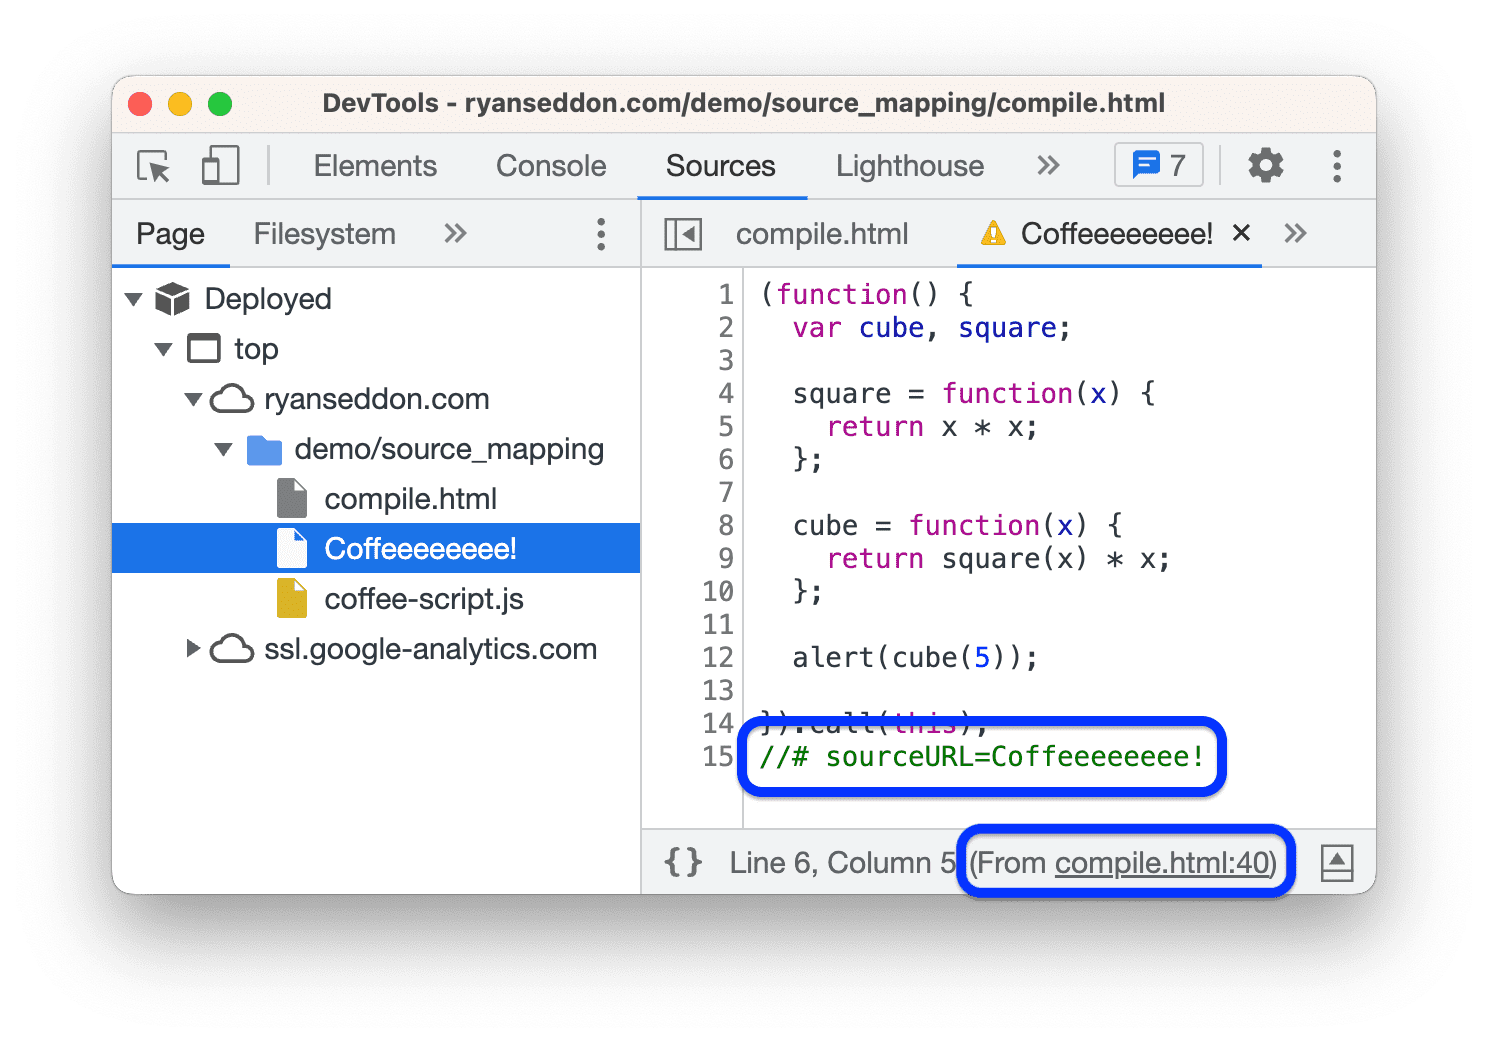
Name eval() calls with #sourceURL
The #sourceURL lets you simplify debugging
when dealing with eval() calls. This helper looks very similar to the //# sourceMappingURL property. For more information, see the Source Map V3 specification.
The //# sourceURL=/path/to/source.file comment tells the browser to look for the source file when you use eval(). This helps you name your evaluations and inline scripts and styles.
Test it on this demo page:
- Open the DevTools and go to the Sources panel.
- On the page, enter an arbitrary filename into the Name your code: input field.
- Click the Compile button. An alert appears with the evaluated sum from the CoffeeScript source.
- In the file tree on the Page pane, open a new file with the custom filename you entered. It contains the compiled JavaScript code that has the
// #sourceURLcomment with the original name of the source file. - To open the source file, click the link in the status bar of the Editor.
