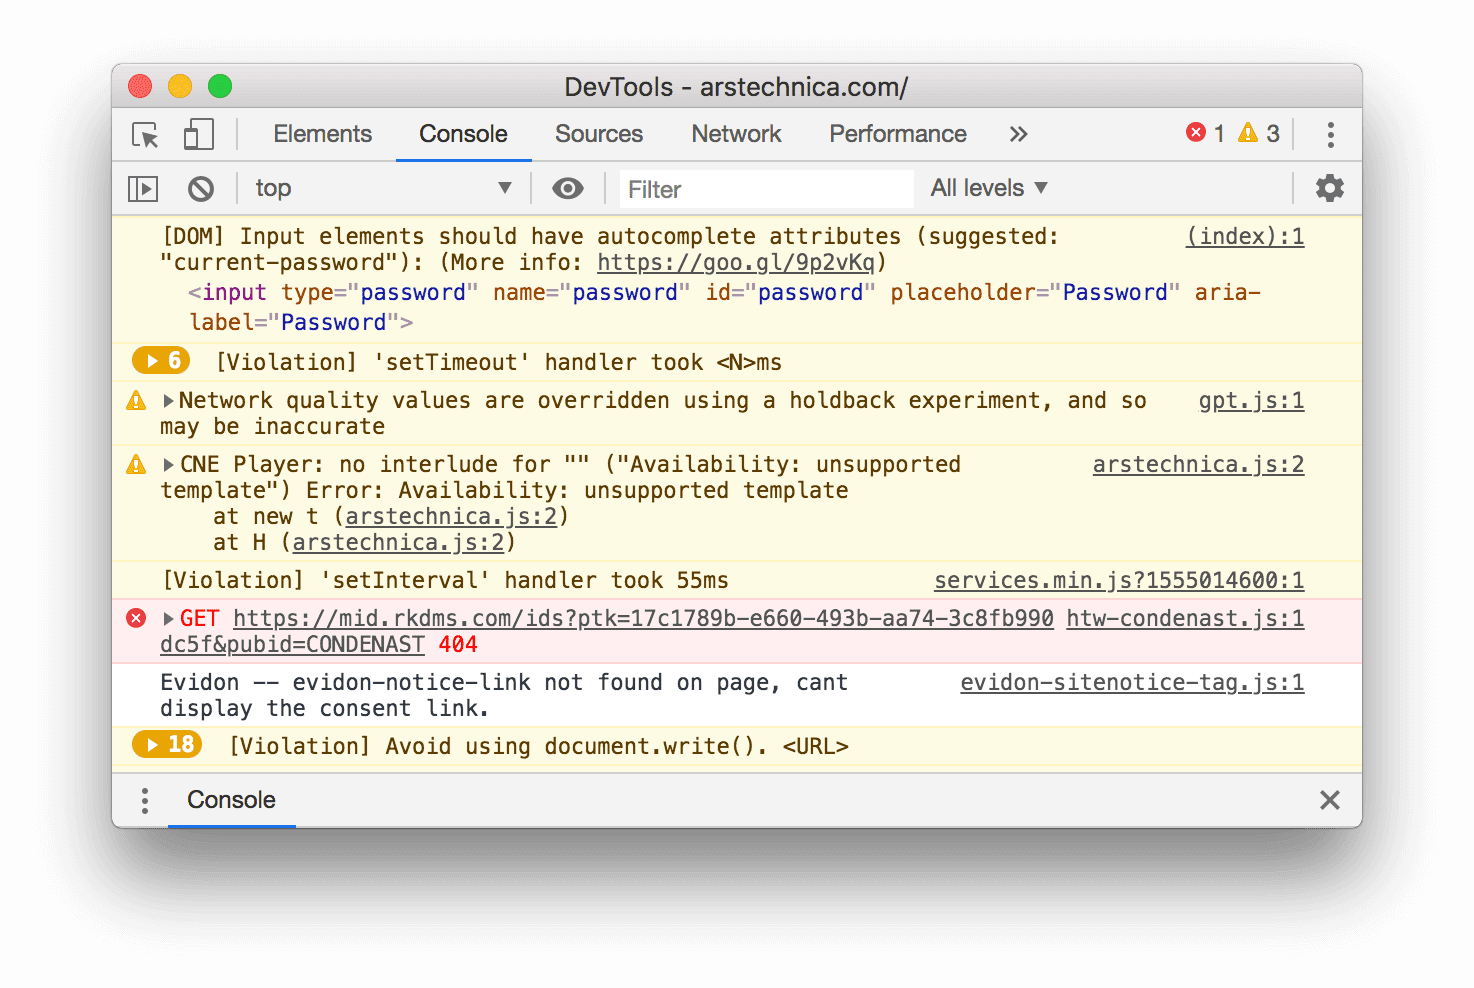
This interactive tutorial shows you how to log and filter messages in the Chrome DevTools Console.
This tutorial is intended to be completed in order. It assumes that you understand the fundamentals of web development, such as how to use JavaScript to add interactivity to a page.
Set up the demo and DevTools
This tutorial is designed so that you can open up the demo and try all the workflows yourself. When you physically follow along, you're more likely to remember the workflows later.
- Open the demo.
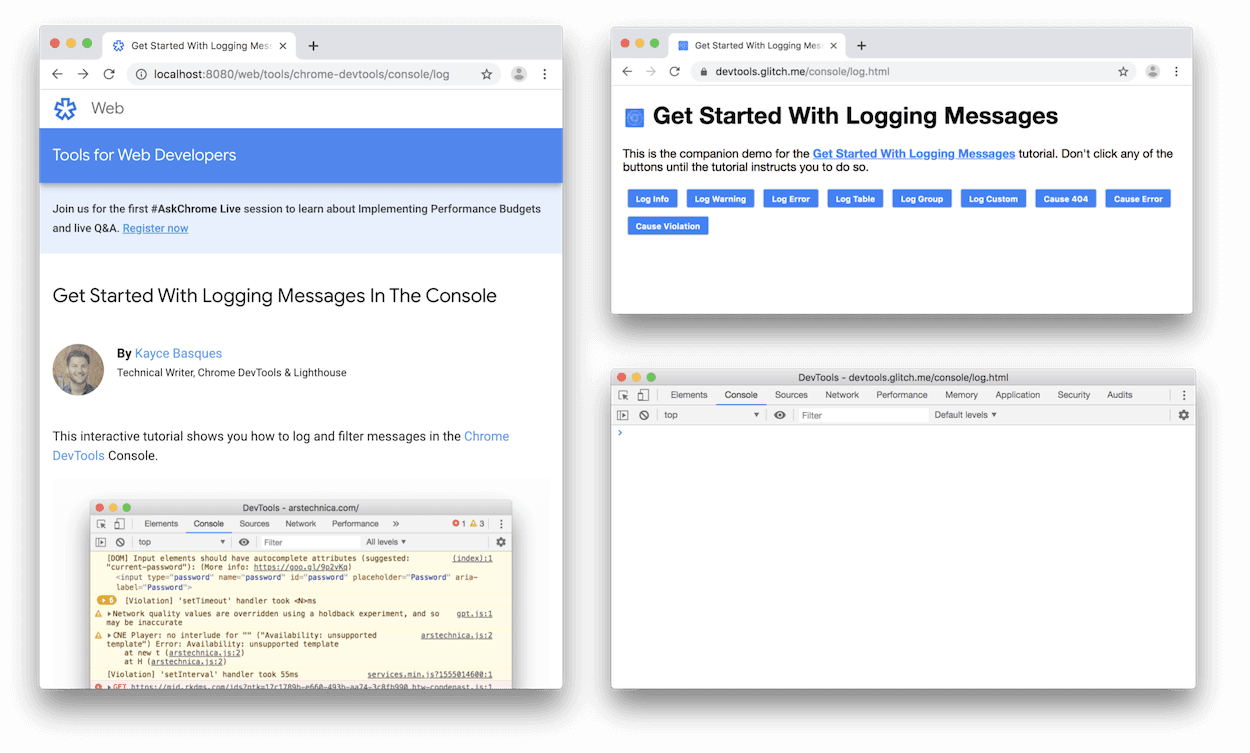
Optional: Move the demo to a separate window. In this example, the tutorial is on the left, and the demo is on the right.
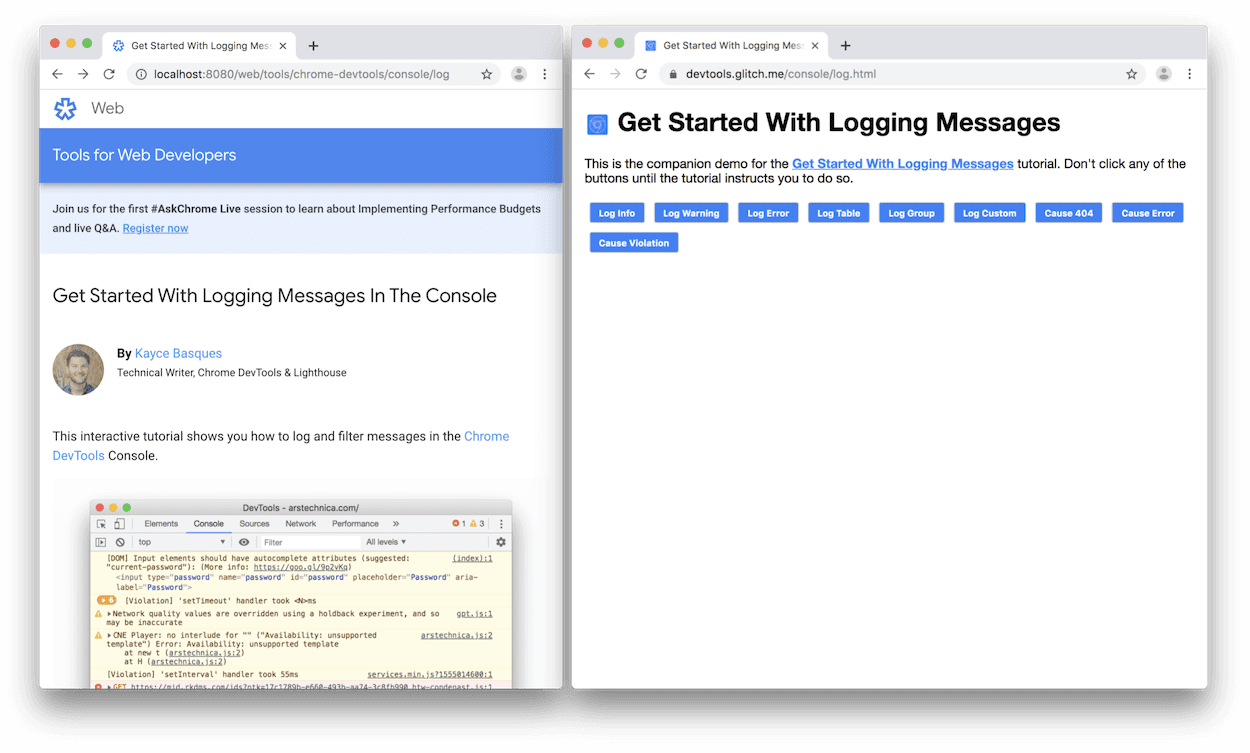
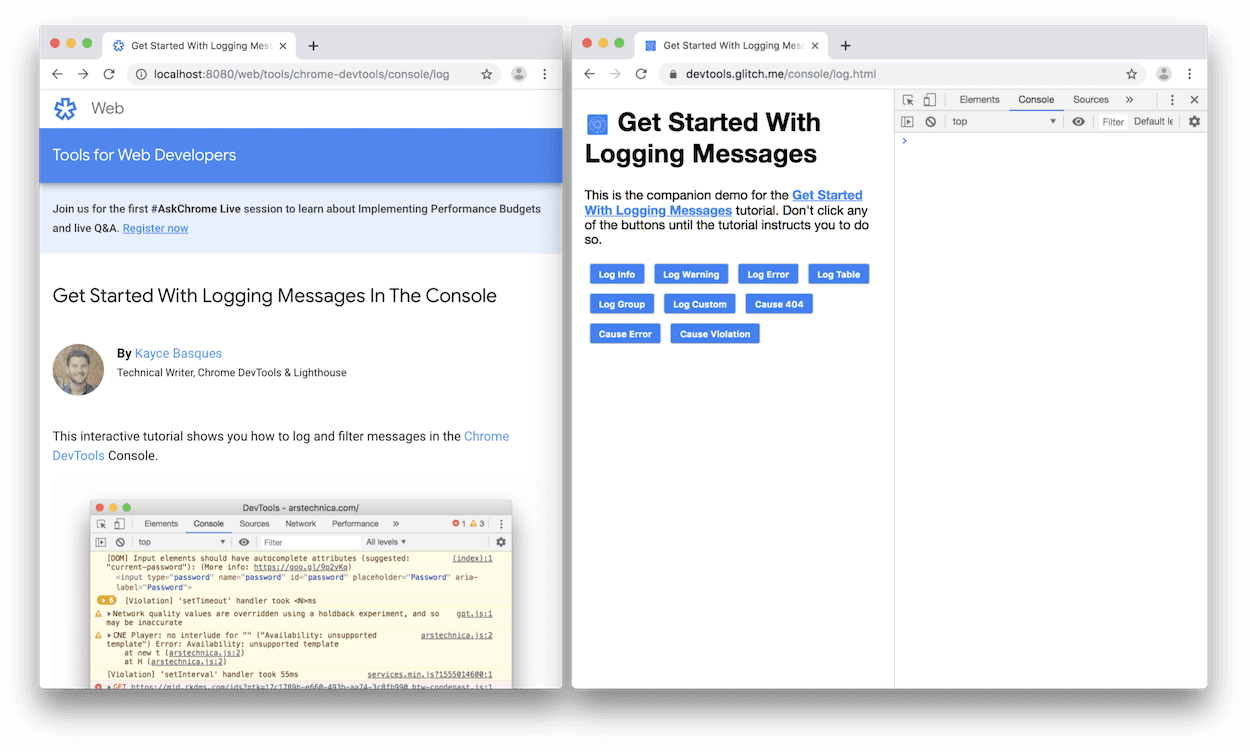
Focus the demo and then press Control+Shift+J or Command+Option+J (Mac) to open DevTools. By default DevTools opens to the right of the demo.
Optional: Dock DevTools to the bottom of the window or undock it into a separate window.
DevTools docked to the bottom of the demo:
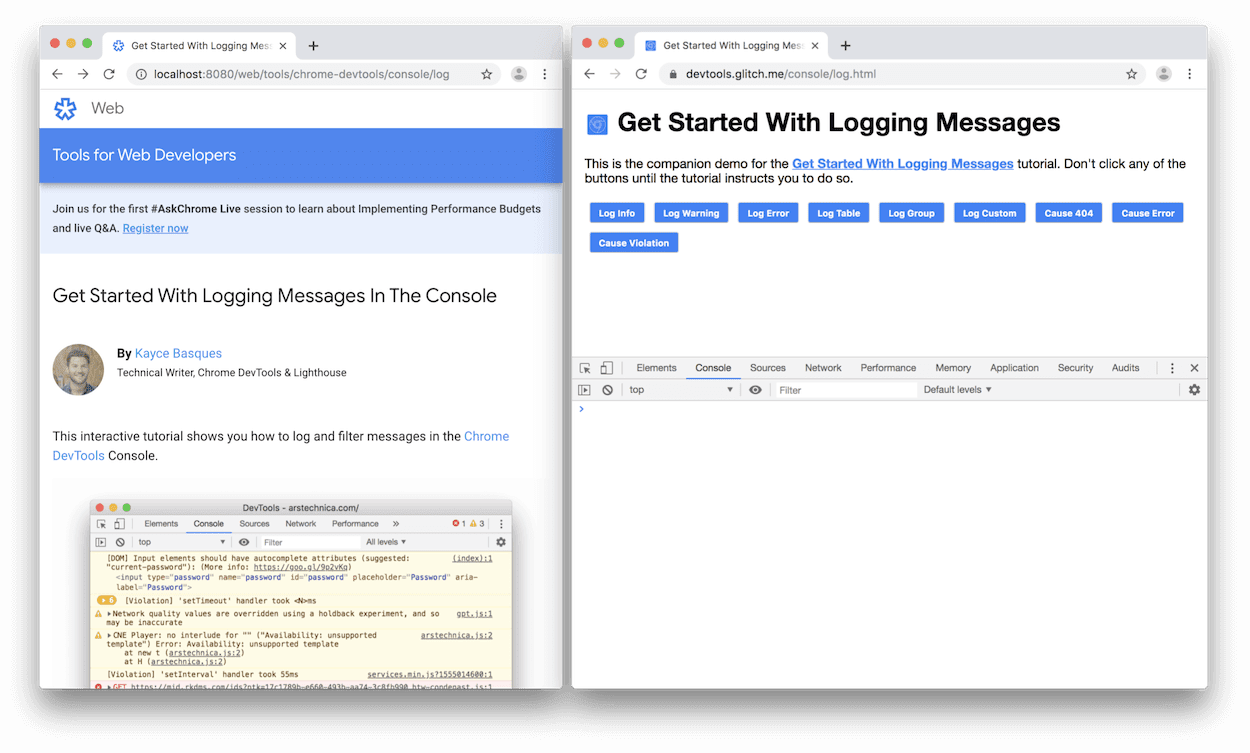
DevTools undocked in a separate window:
View messages logged from JavaScript
Most messages that you see in the Console come from the web developers who wrote the page's JavaScript. The goal of this section is to introduce you to the different message types that you're likely to see in the Console, and explain how you can log each message type yourself from your own JavaScript.
Click the Log Info button in the demo.
Hello, Console!gets logged to the Console.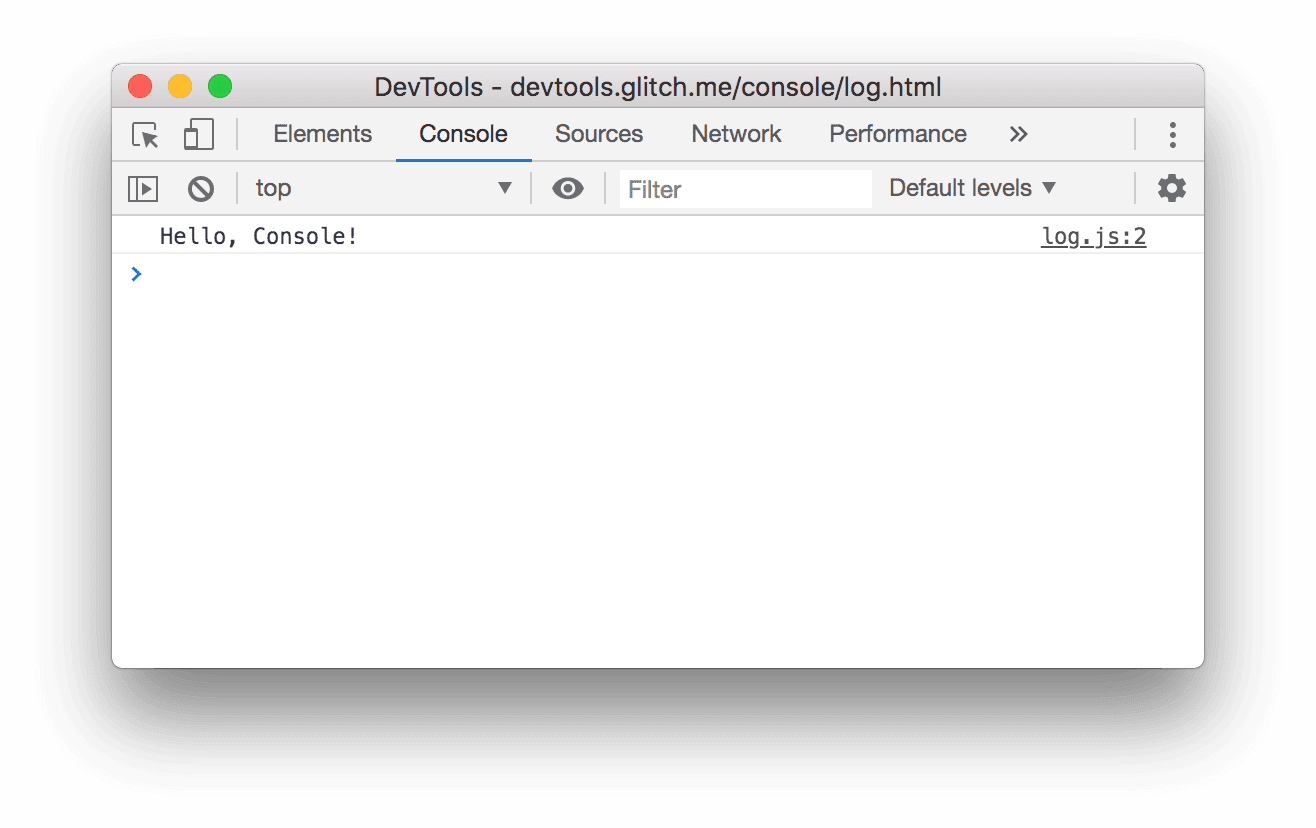
Next to the
Hello, Console!message in the Console, click log.js:2. The Sources panel opens and highlights the line of code that caused the message to get logged to the Console.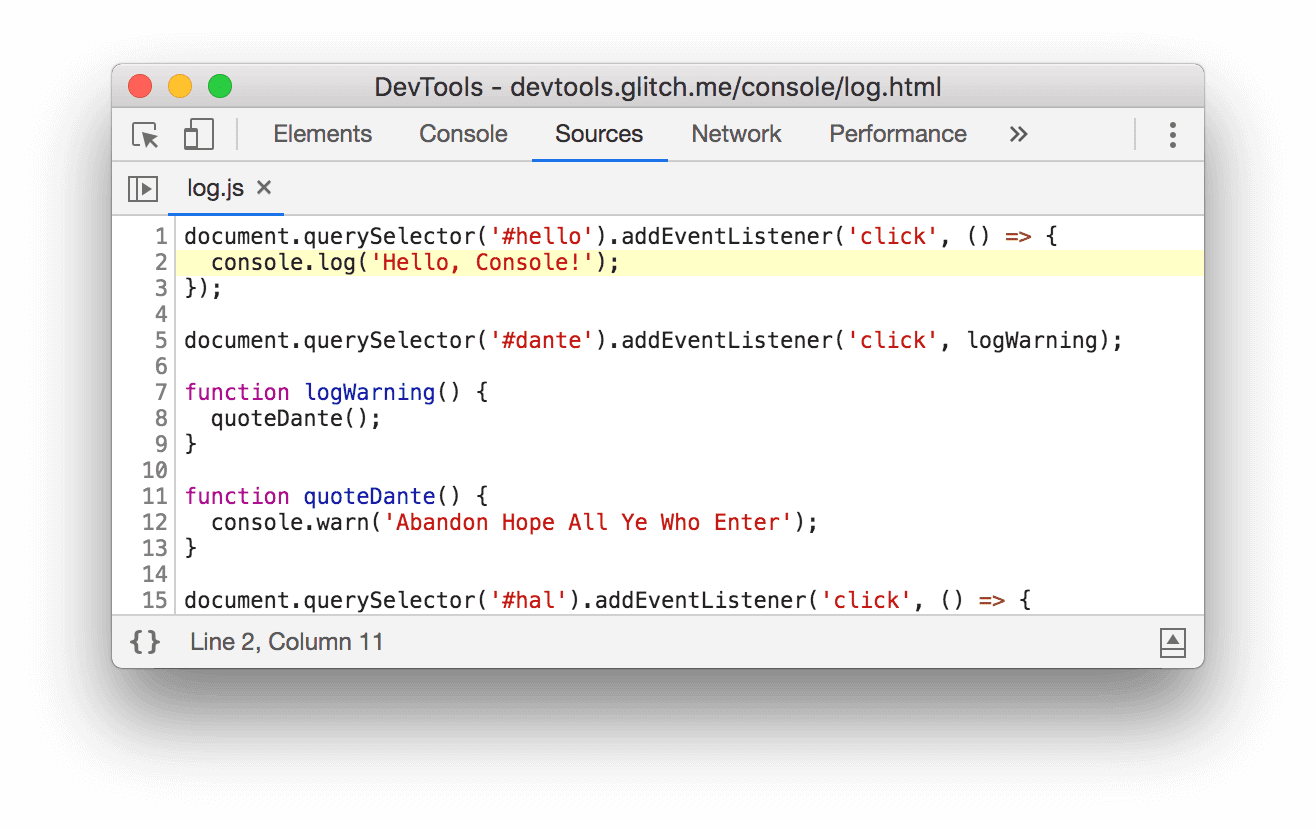
The message was logged when the page's JavaScript called
console.log('Hello, Console!').Navigate back to the Console using any of the following workflows:
- Click the Console tab.
- Press Control+[ or Command+[ (Mac) until the Console is in focus.
- Open the Command Menu, start typing
Console, select the Show Console Panel command, and then press Enter.
Click the Log Warning button in the demo.
Abandon Hope All Ye Who Entergets logged to the Console.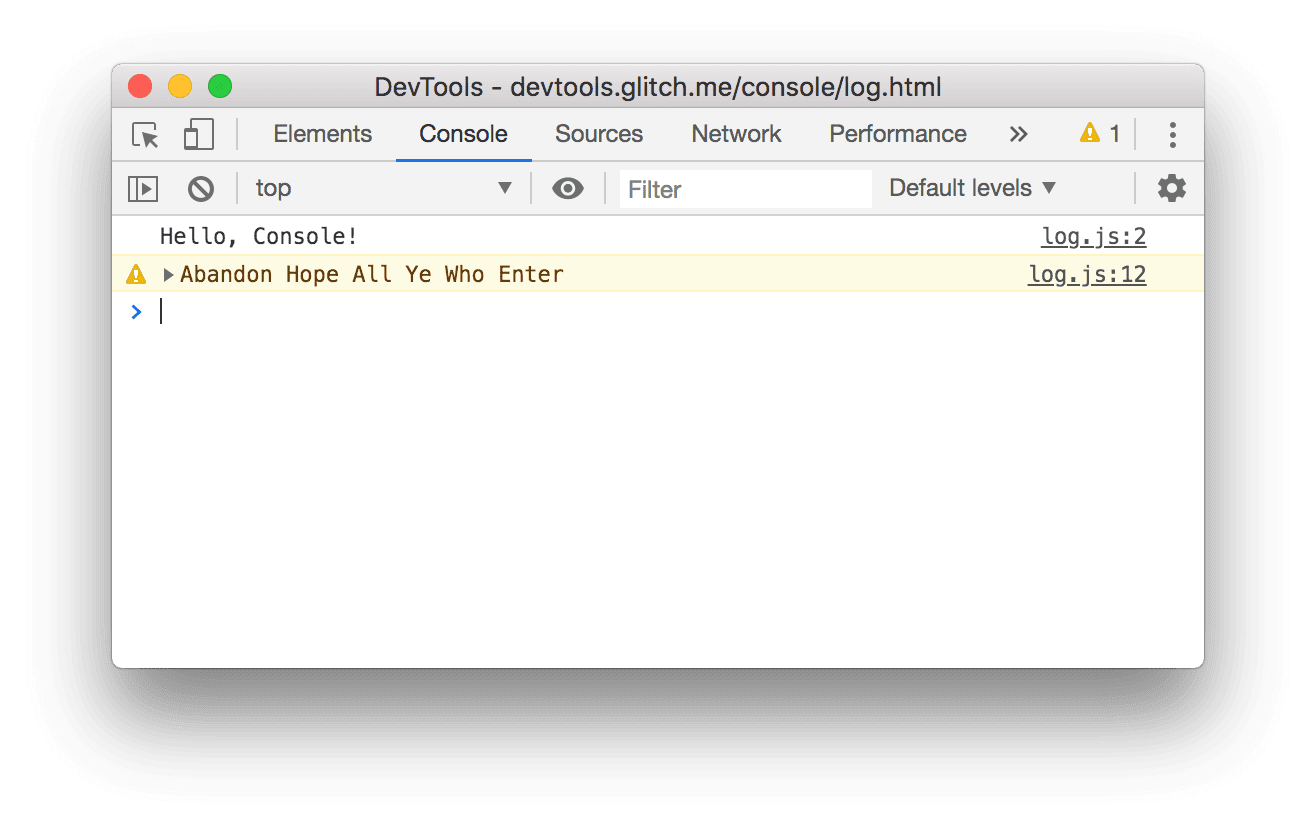
Messages formatted like this are warnings.
Optional: Click log.js:12 to view the code that caused the message to get formatted like this, and then navigate back to Console when you're finished. Do this whenever you want to see the code that caused a message to get logged a certain way.
Click the Expand
icon in front of
Abandon Hope All Ye Who Enter. DevTools shows the stack trace leading up to the call.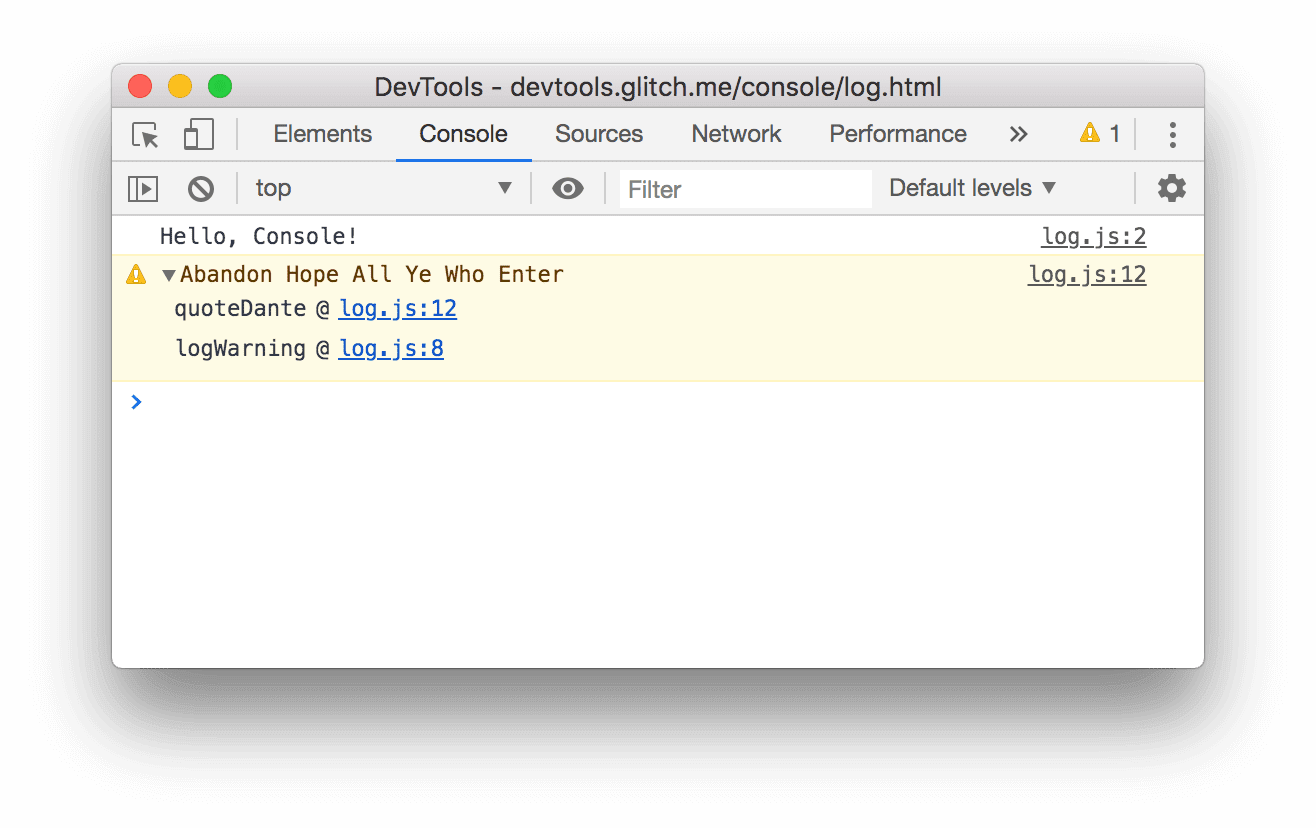
The stack trace is telling you that a function named
logWarningwas called, which in turn called a function namedquoteDante. In other words, the call that happened first is at the bottom of the stack trace. You can log stack traces at any time by callingconsole.trace().Click Log Error. The following error message gets logged:
I'm sorry, Dave. I'm afraid I can't do that.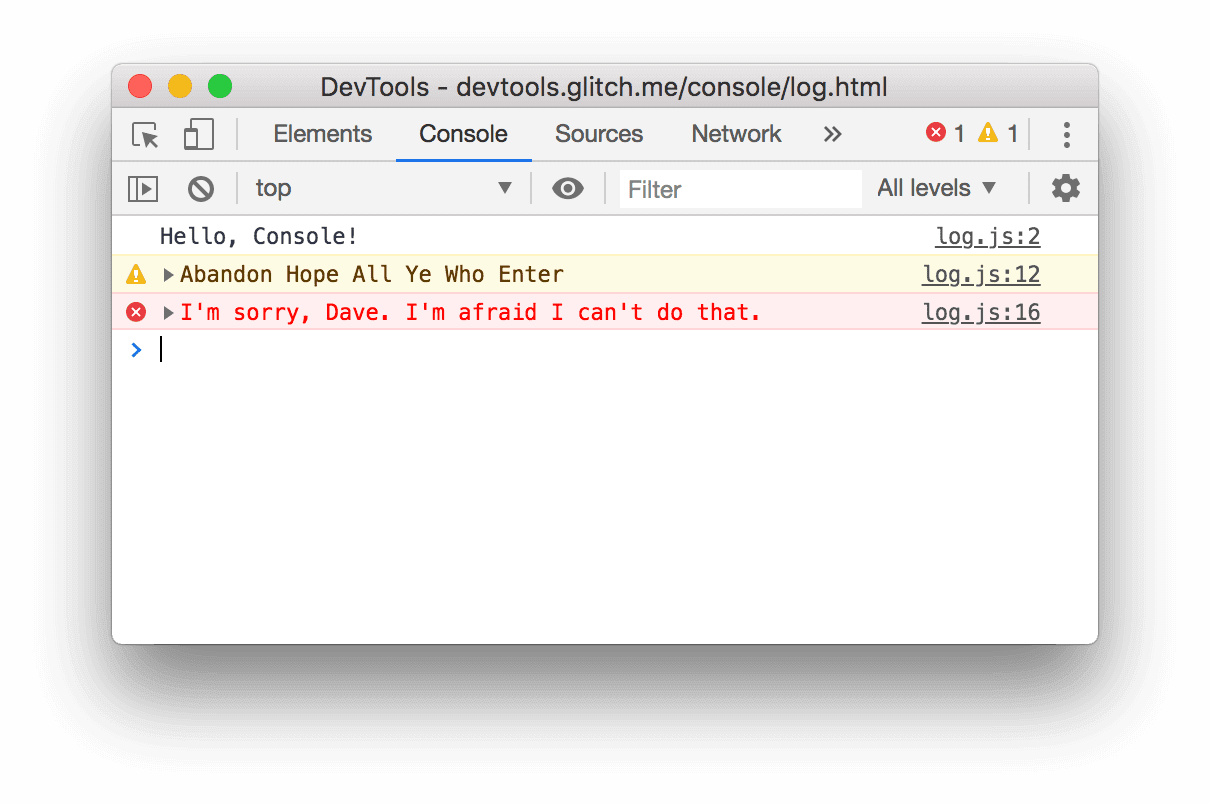
Click Log Table. A table about famous artists gets logged to the Console.
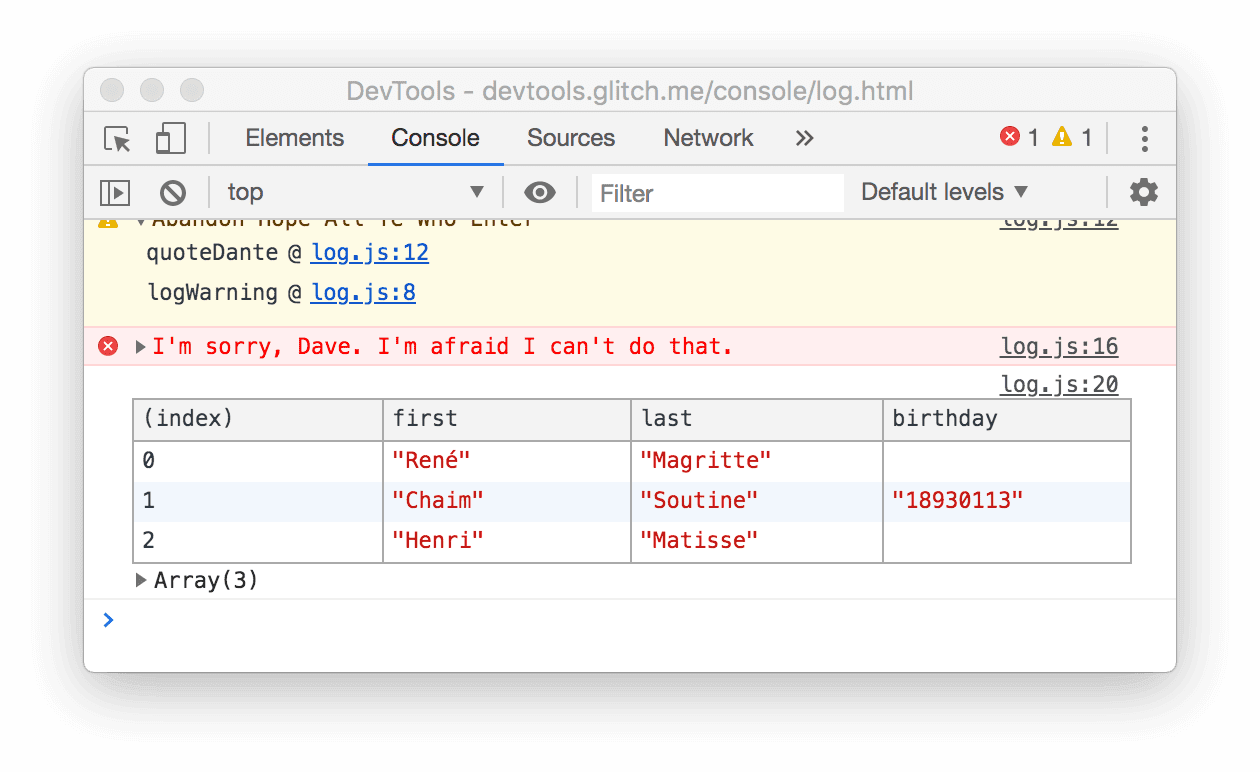
Note how the
birthdaycolumn is only populated for one row. Check the code to figure out why that is.Click Log Group. The names of 4 famous, crime-fighting turtles are grouped under the
Adolescent Irradiated Espionage Tortoiseslabel.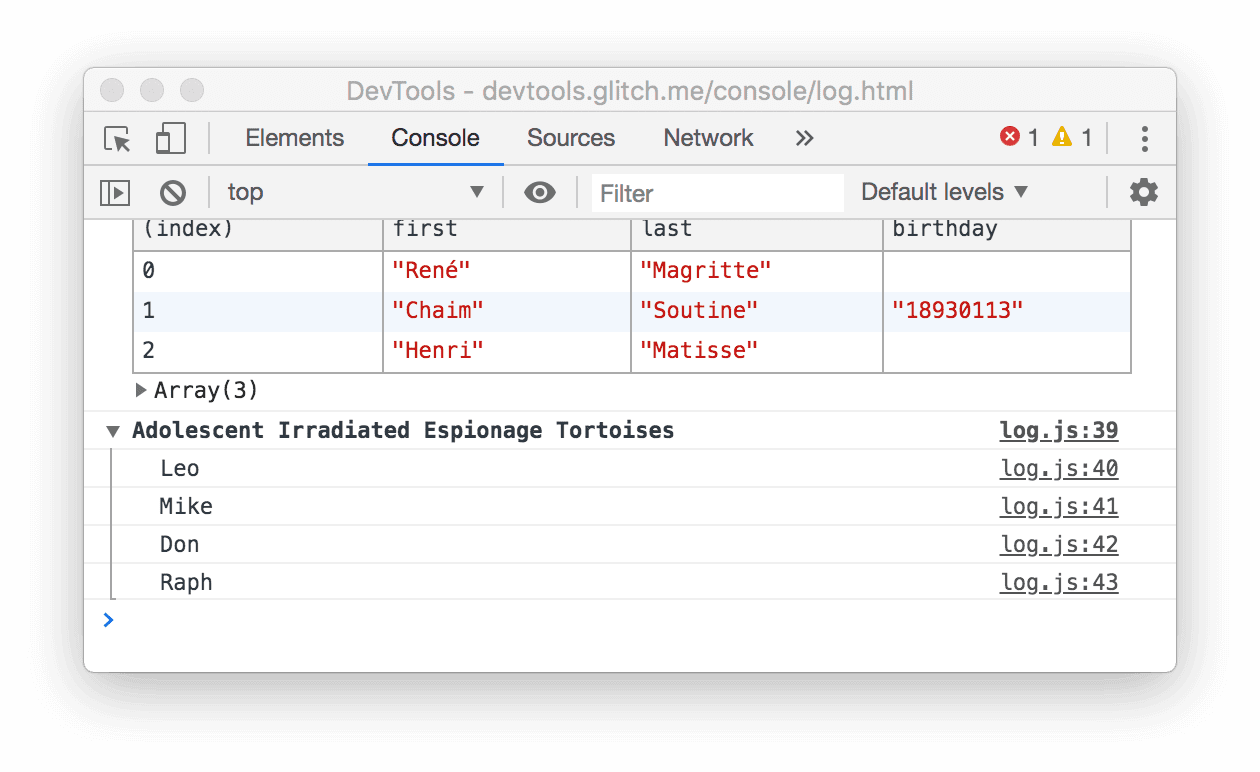
Click Log Custom. A message with a red border and blue background gets logged to the Console.
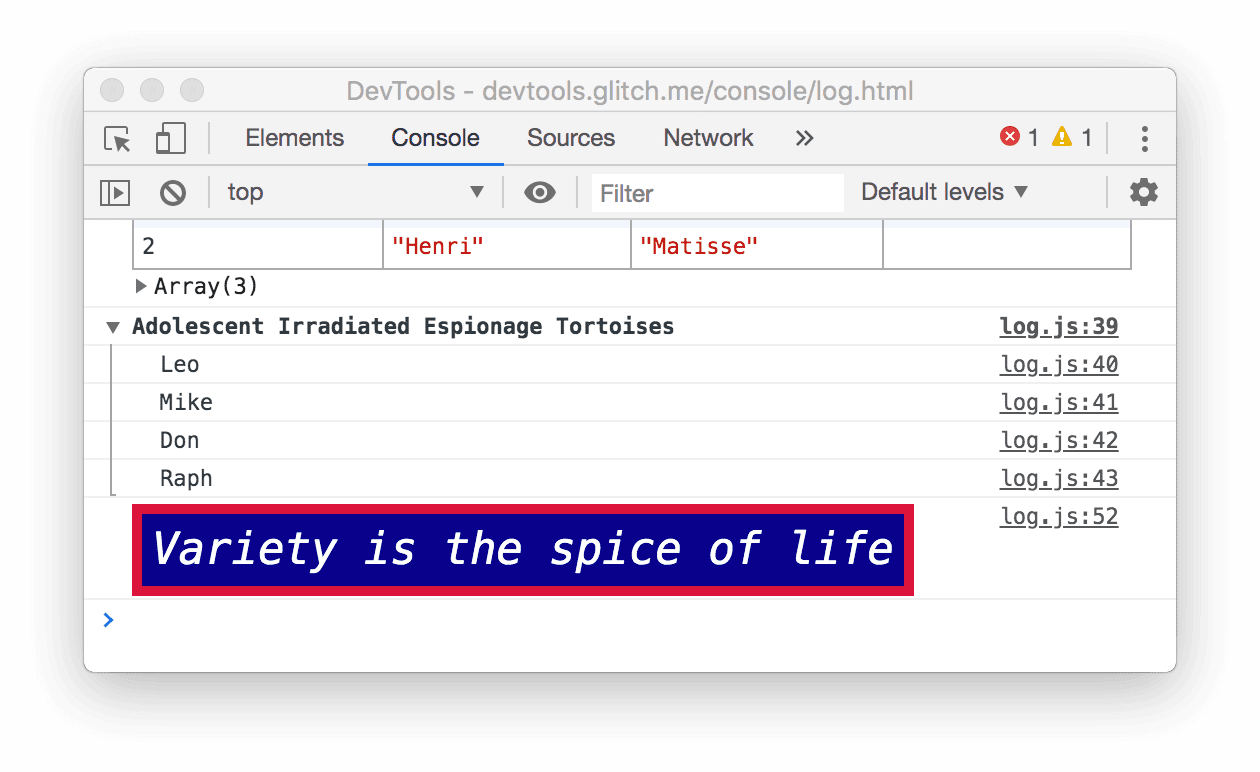
The main idea here is that when you want to log messages to the Console from your JavaScript, you
use one of the console methods. Each method formats messages differently.
There are even more methods than what has been demonstrated in this section. At the end of the tutorial you'll learn how to explore the rest of the methods.
View messages logged by the browser
The browser logs messages to the Console, too. This usually happens when there's a problem with the page.
Click Cause 404. The browser logs a
404network error because the page's JavaScript tried to fetch a file that doesn't exist.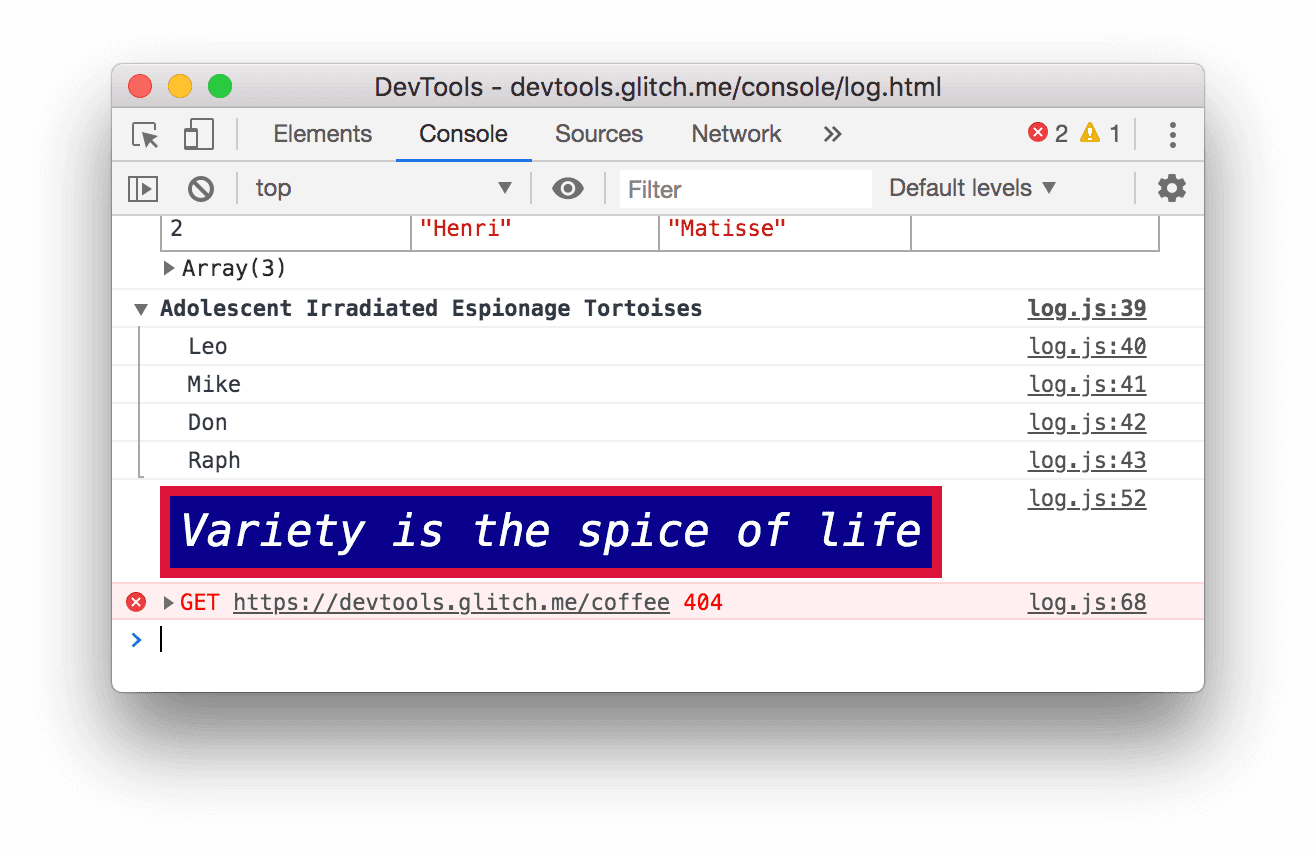
Click Cause Error. The browser logs an uncaught
TypeErrorbecause the JavaScript is trying to update a DOM node that doesn't exist.
Click the Log Levels drop-down and enable the Verbose option if it's disabled. You'll learn more about filtering in the next section. You need to do this to make sure that the next message you log is visible. Note: If the Default Levels drop-down is disabled, you may need to close the Console Sidebar. Filter by Message Source below for more information about the Console Sidebar.
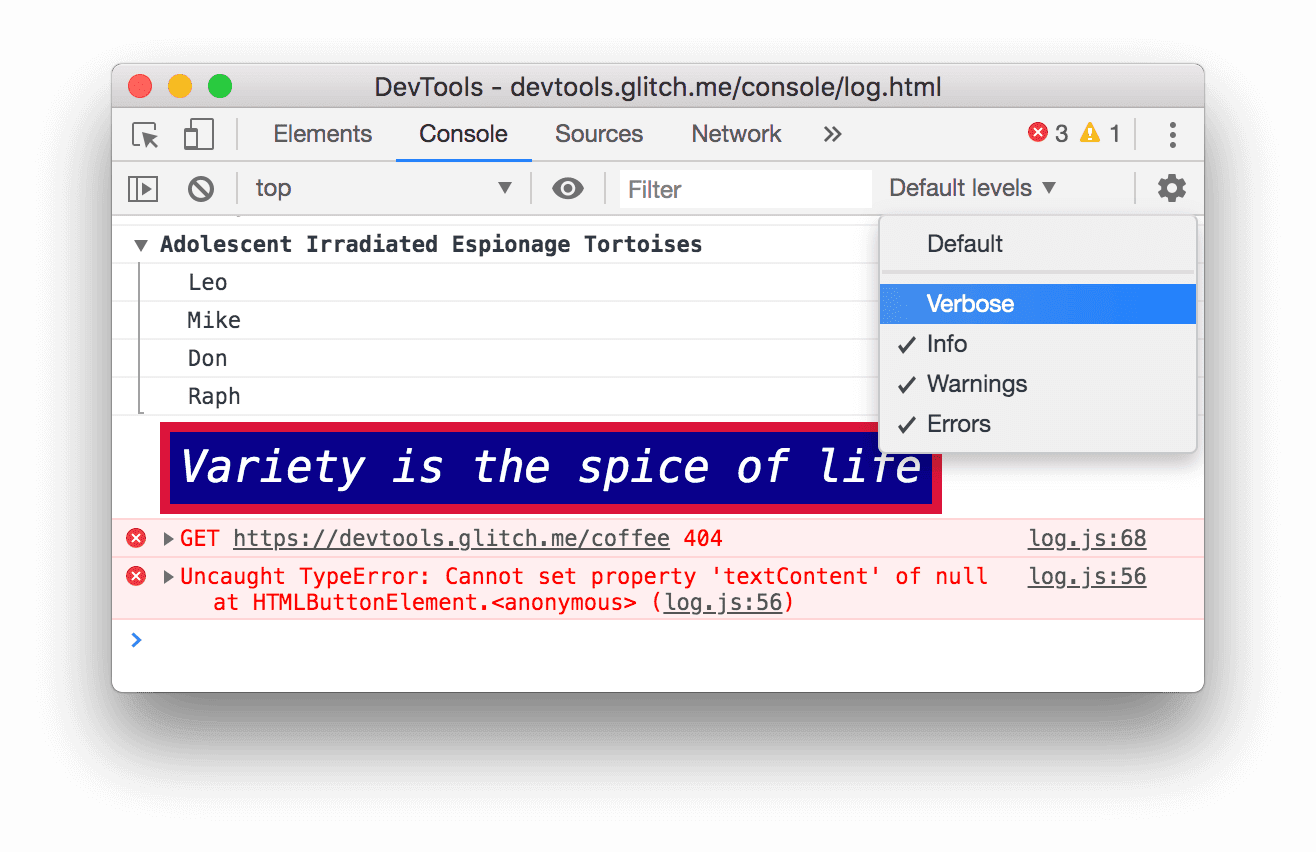
Click Cause Violation. The page becomes unresponsive for a few seconds and then the browser logs the message
[Violation] 'click' handler took 3000msto the Console. The exact duration may vary.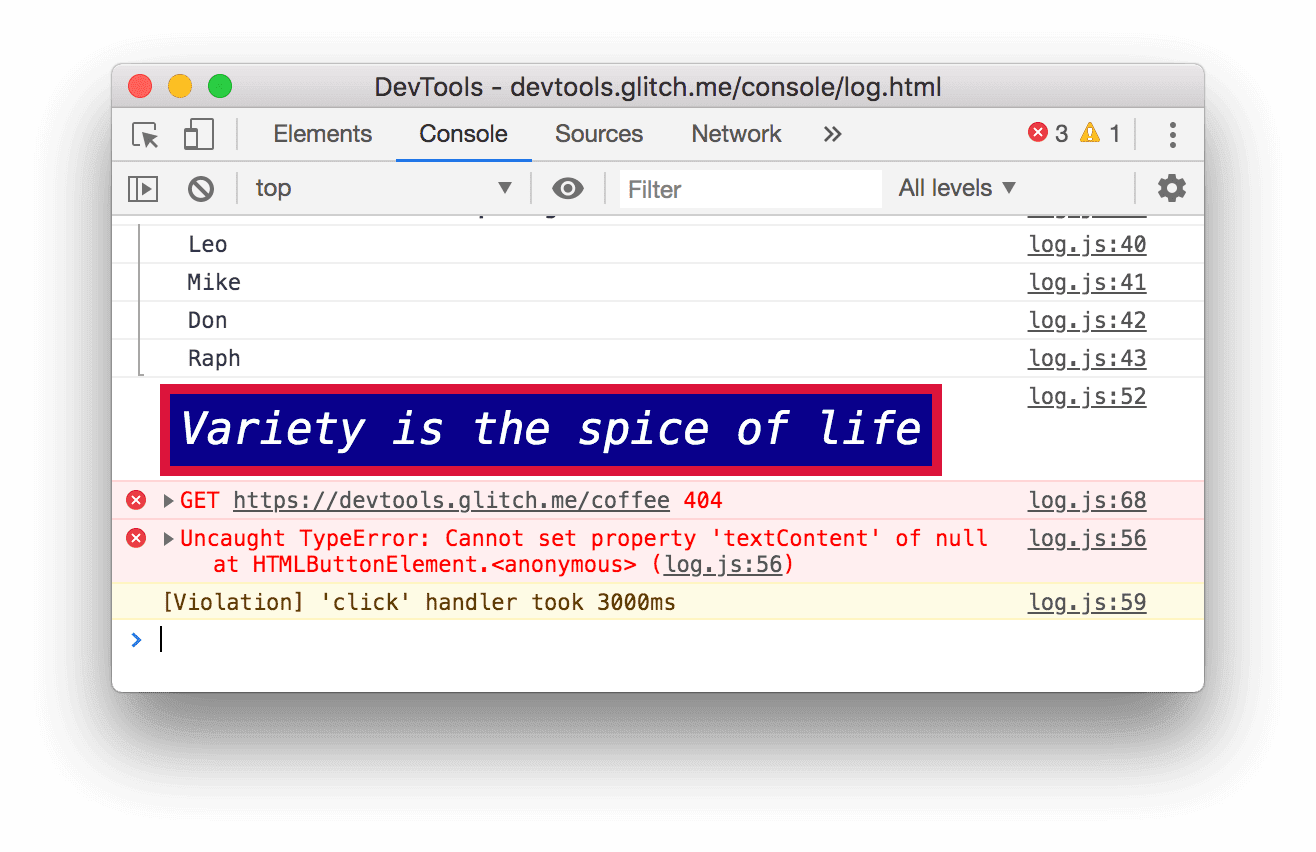
Filter messages
On some pages you'll see the Console get flooded with messages. DevTools provides many different ways to filter out messages that aren't relevant to the task at hand.
Filter by log level
Each console.* method is assigned a severity level: Verbose, Info, Warning, or Error. For example, console.log() is an Info-level message, whereas console.error() is an Error-level message.
To filter by log level:
Click the Log Levels drop-down and disable Errors. A level is disabled when there is no longer a checkmark next to it. The
Error-level messages disappear.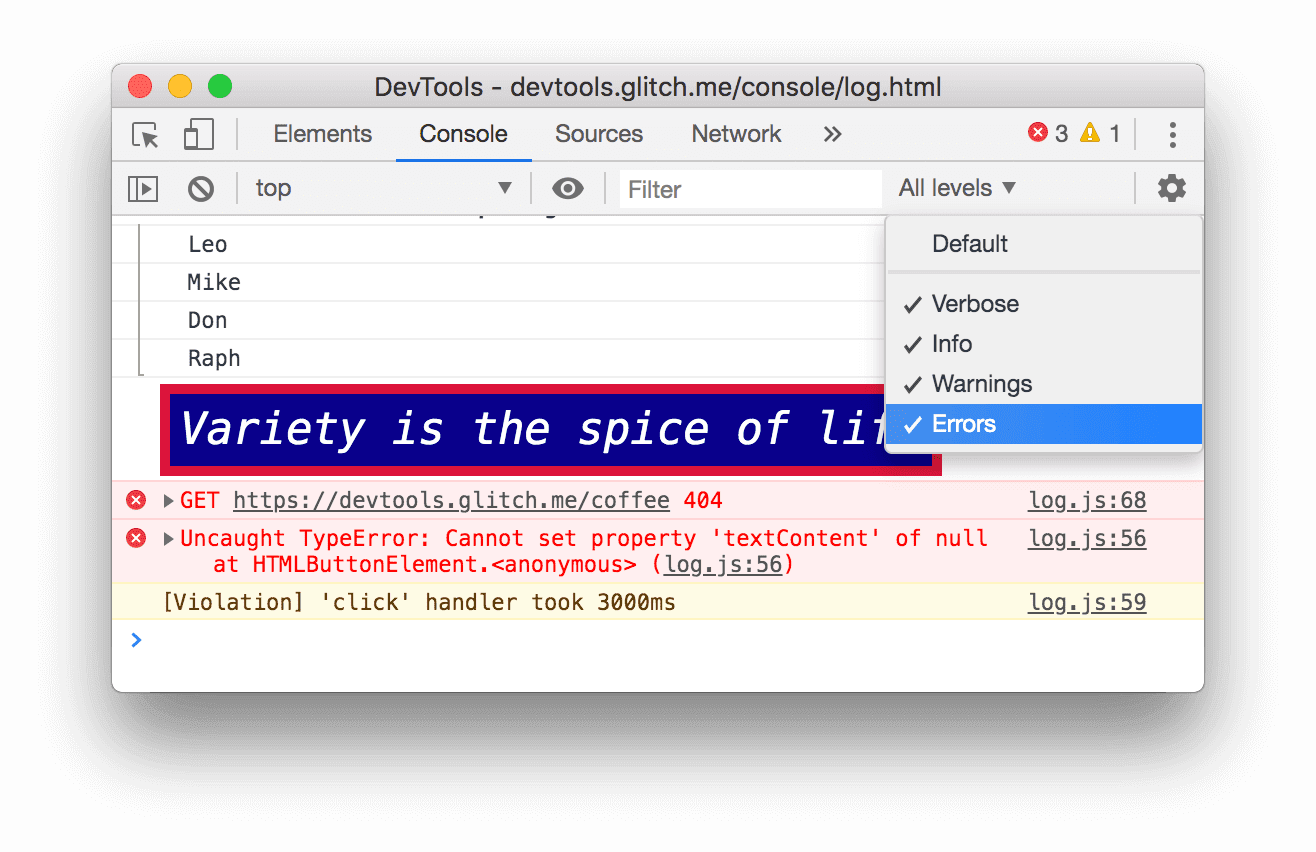
Click the Log Levels drop-down again and re-enable Errors. The
Error-level messages reappear.
Filter by text
When you want to only view messages that include an exact string, type that string into the Filter box.
Type
Daveinto the Filter box. All messages that don't include the stringDaveare hidden.
Delete
Davefrom the Filter box. All the messages reappear.
Filter by regular expression
When you want to show all messages that include a pattern of text, rather than a specific string, use a regular expression.
Type
/^[AH]/into the Filter box. Type this pattern into RegExr for an explanation of what it's doing.![Filtering out any message that does not match the pattern `/^[AH]/`.](https://developer.chrome.google.cn/static/docs/devtools/console/log/image/filtering-any-message-d-a0b17462a87b8.png?authuser=00)
Delete
/^[AH]/from the Filter box. All messages are visible again.
Filter by message source
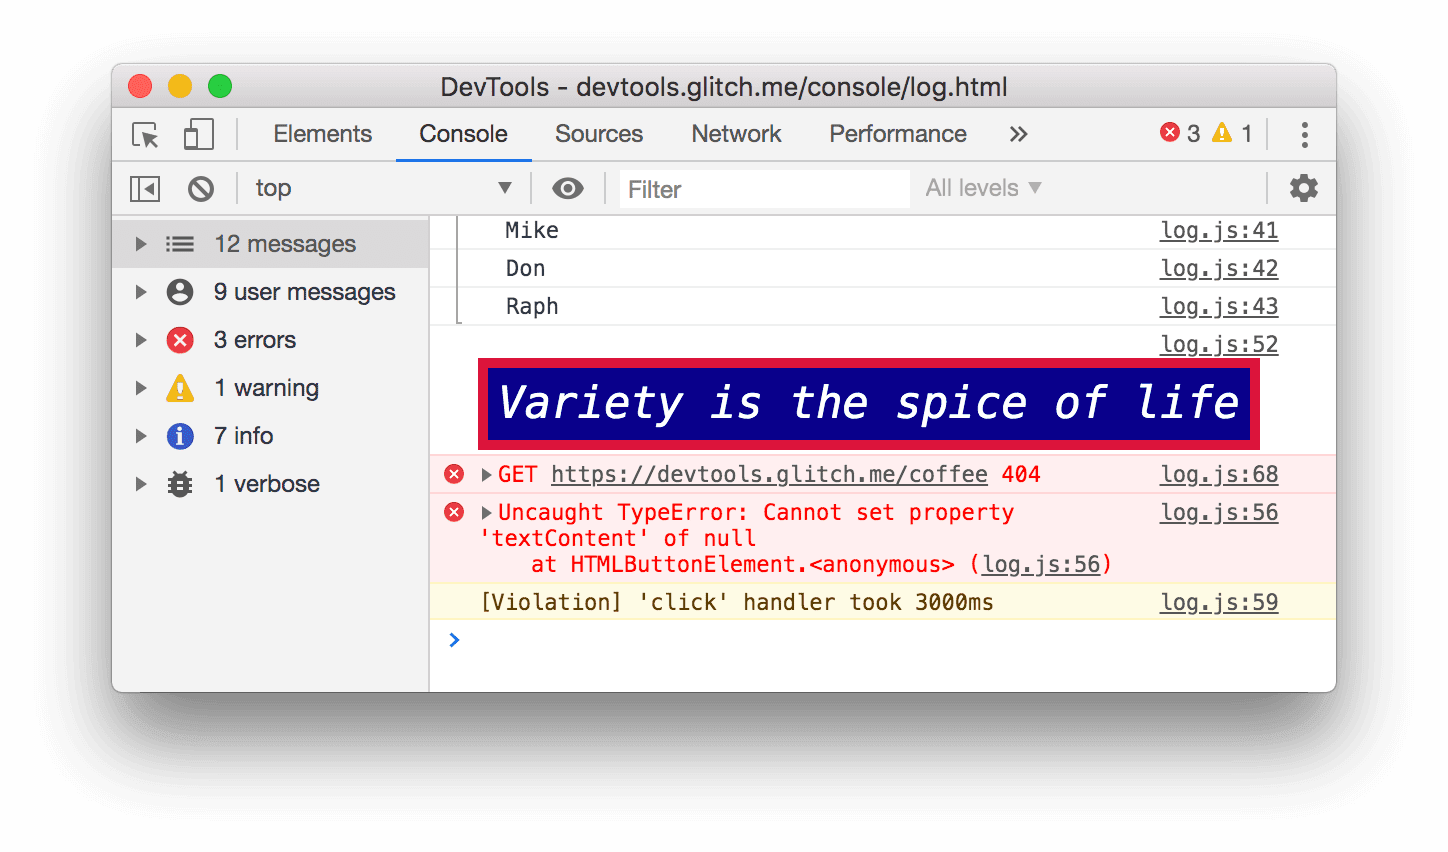
When you want to only view the messages that came from a certain URL, use the Sidebar.
Click Show Console Sidebar
 .
.
Click the Expand
icon next to 12 Messages. The Sidebar shows a list of URLs that caused messages to be logged. For example,
log.jscaused 11 messages.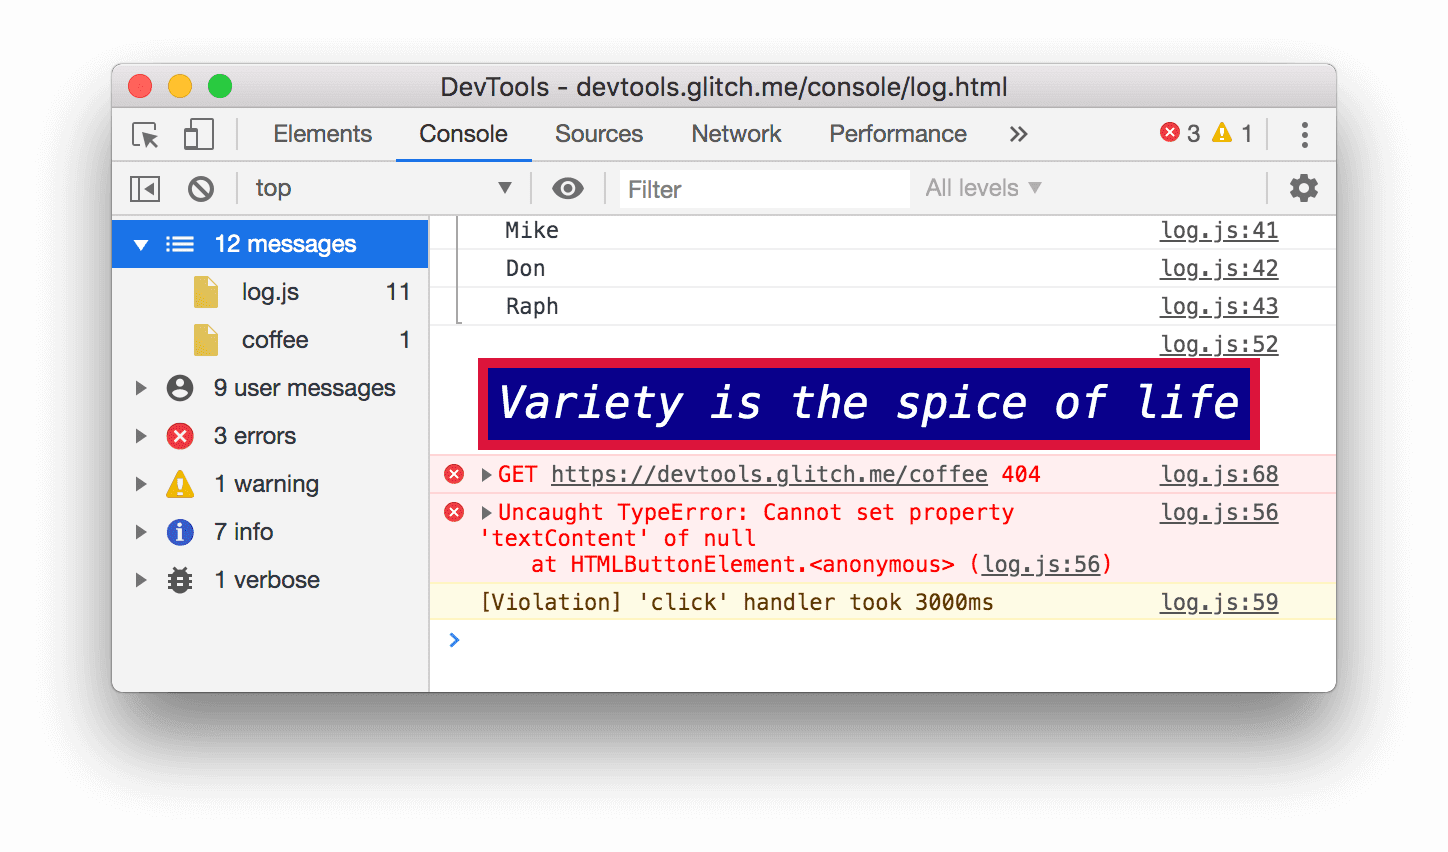
Filter by user messages
Earlier, when you clicked Log Info, a script called console.log('Hello, Console!') in order to
log the message to the Console. Messages logged from JavaScript like this are called user
messages. In contrast, when you clicked Cause 404, the browser logged an Error-level message
stating that the requested resource could not be found. Messages like that are considered browser
messages. You can use the Sidebar to filter out browser messages and only show user messages.
Click 9 User Messages. The browser messages are hidden.

Click 12 Messages to show all messages again.
Use the Console alongside any other panel
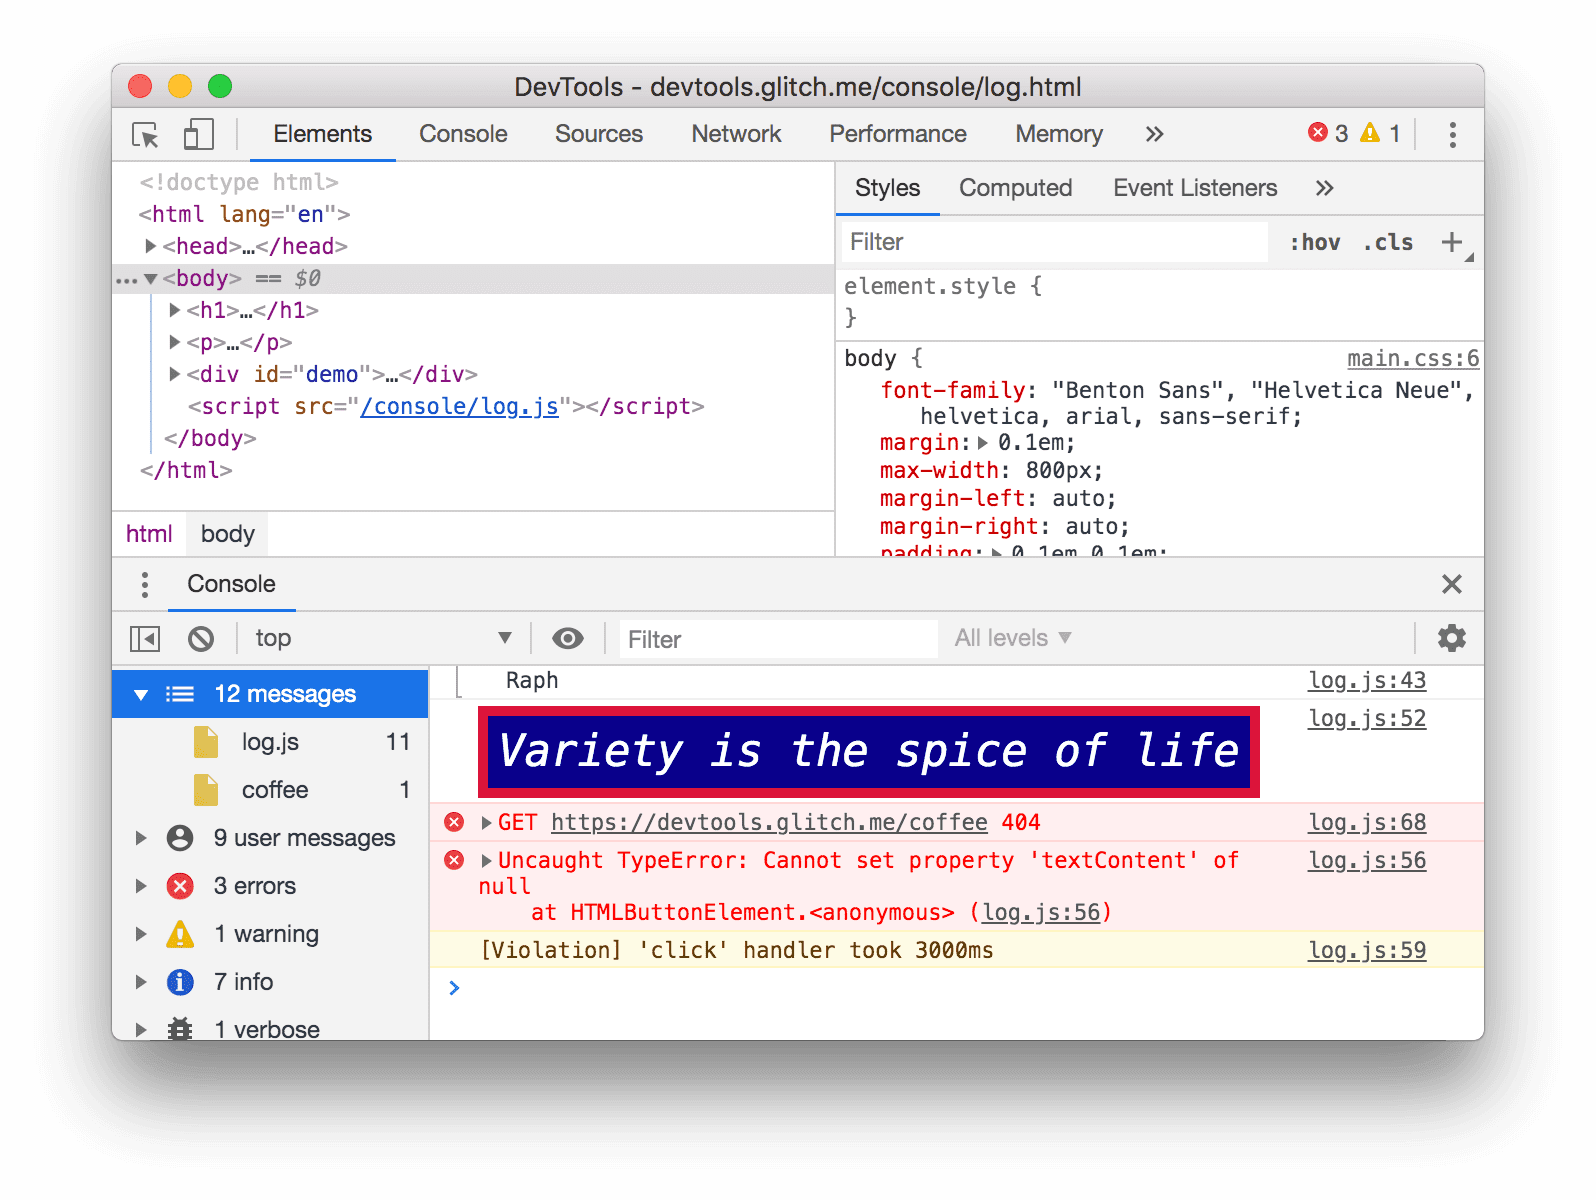
What if you're editing styles, but you need to quickly check the Console log for something? Use the Drawer.
- Click the Elements tab.
Press Escape. The Console tab of the Drawer opens. It has all of the features of the Console that you've been using throughout this tutorial.
Next steps
Congratulations, you have completed the tutorial. Click Dispense Trophy to receive your trophy.
- See Console Reference to explore more features and workflows related to the Console UI.
- See Console API Reference to learn more about all of the
consolemethods that were demonstrated in View messages logged from JavaScript and explore the otherconsolemethods that weren't covered in this tutorial. - See Get Started to explore what else you can do with DevTools.
- See Format and style messages in the Console to learn more about all of the
consoleformat and styling methods.

