


Deze pagina is een uitgebreid naslagwerk van Chrome DevTools-functies met betrekking tot het analyseren van prestaties.
Zie Runtimeprestaties analyseren voor een begeleide tutorial over hoe u de prestaties van een pagina kunt analyseren met Chrome DevTools.
Recordprestaties
U kunt runtime- of laadprestaties vastleggen.
Registreer runtime-prestaties
Registreer runtimeprestaties wanneer u de prestaties van een pagina wilt analyseren terwijl deze wordt uitgevoerd, in plaats van tijdens het laden.
- Ga naar de pagina die u wilt analyseren.
- Klik op het tabblad Prestaties in DevTools.
Klik op Opnemen
 .
. 
Interactie met de pagina. DevTools registreert alle pagina-activiteit die plaatsvindt als gevolg van uw interacties.
Klik nogmaals op Opnemen of klik op Stoppen om de opname te stoppen.
Registreer de laadprestaties
Leg de laadprestaties vast als u de prestaties van een pagina wilt analyseren terwijl deze wordt geladen, in plaats van wanneer deze actief is.
- Ga naar de pagina die u wilt analyseren.
- Open het prestatiepaneel van DevTools.
Klik op Start profilering en pagina opnieuw laden
 . DevTools navigeert eerst naar
 about:blankom eventuele resterende schermafbeeldingen en sporen te wissen. Vervolgens registreert DevTools prestatiestatistieken terwijl de pagina opnieuw wordt geladen en stopt de opname vervolgens automatisch een paar seconden nadat het laden is voltooid.
DevTools zoomt automatisch in op het gedeelte van de opname waar de meeste activiteit plaatsvond.
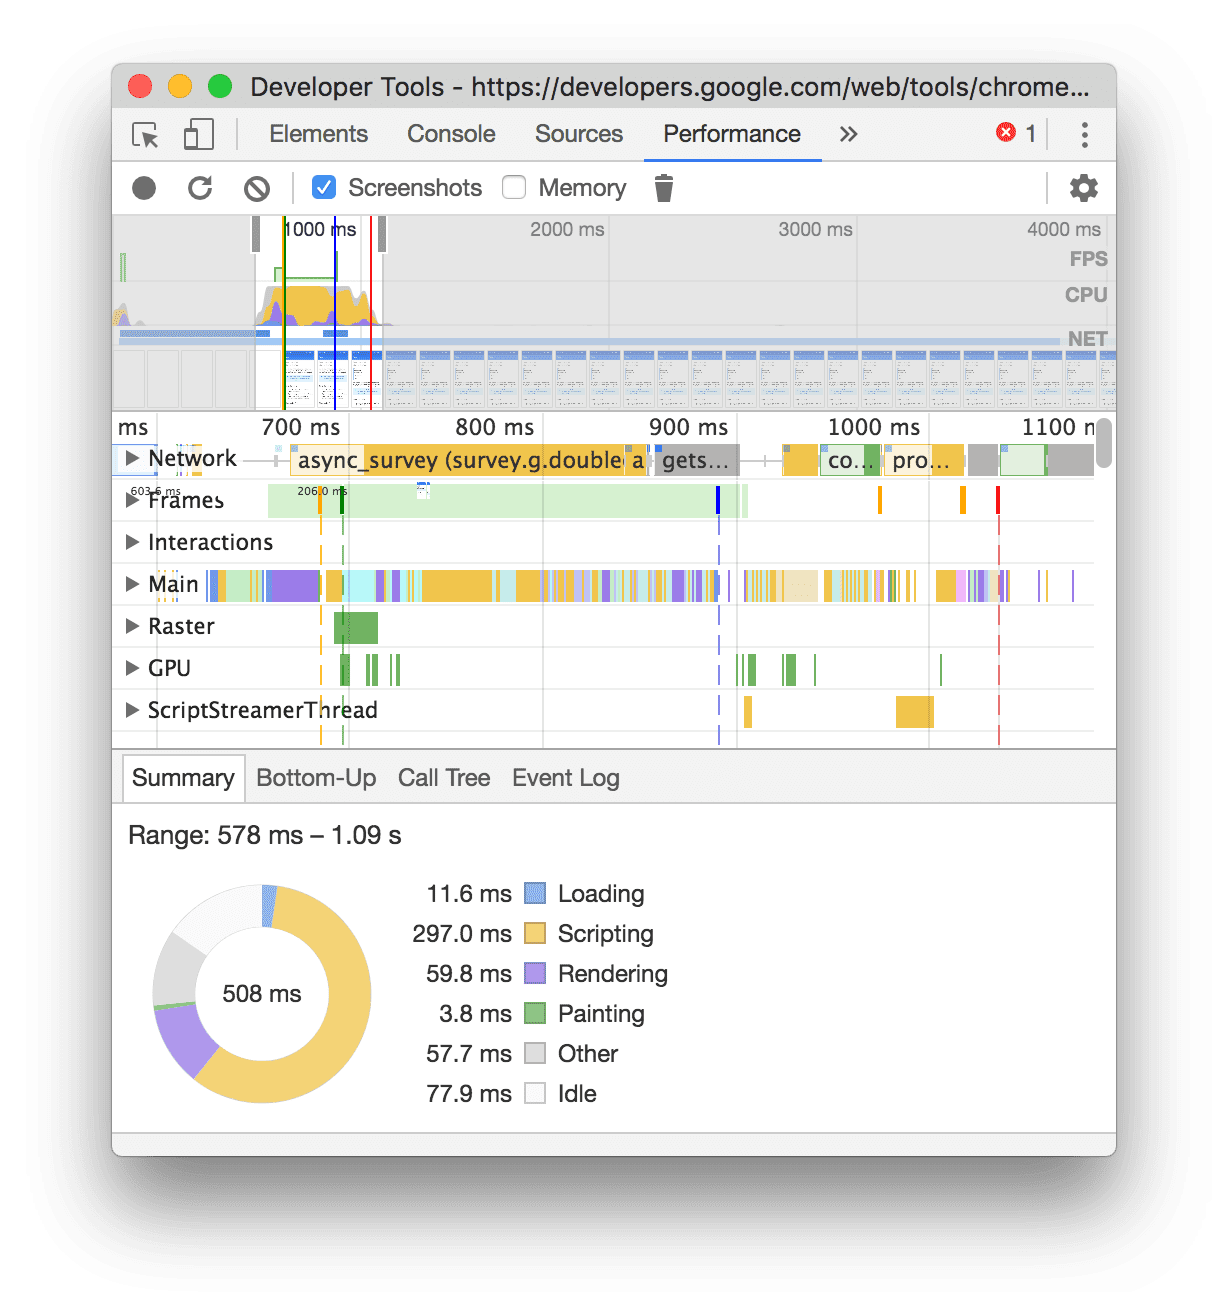
In dit voorbeeld toont het paneel Prestaties de activiteit tijdens het laden van een pagina.
Maak screenshots tijdens het opnemen
Schakel het selectievakje Screenshots in om tijdens het opnemen een screenshot te maken van elk frame.

Zie Een screenshot bekijken om te leren hoe u met screenshots kunt omgaan.
Forceer afvalinzameling tijdens het opnemen
Terwijl u een pagina opneemt, klikt u op verzamelen om de afvalinzameling te forceren.

Toon opname-instellingen
Klik op Instellingen vastleggen ![]() om meer instellingen bloot te leggen die verband houden met de manier waarop DevTools prestatie-opnamen vastlegt.
om meer instellingen bloot te leggen die verband houden met de manier waarop DevTools prestatie-opnamen vastlegt.

Schakel JavaScript-voorbeelden uit
Standaard geeft het hoofdspoor van een opname gedetailleerde call-stacks weer van JavaScript-functies die tijdens de opname zijn aangeroepen. Om deze call-stacks uit te schakelen:
- Open de opname-instellingen
 menu. Zie Opname-instellingen weergeven .
 - Schakel het selectievakje JavaScript-voorbeelden uitschakelen in.
- Maak een opname van de pagina.
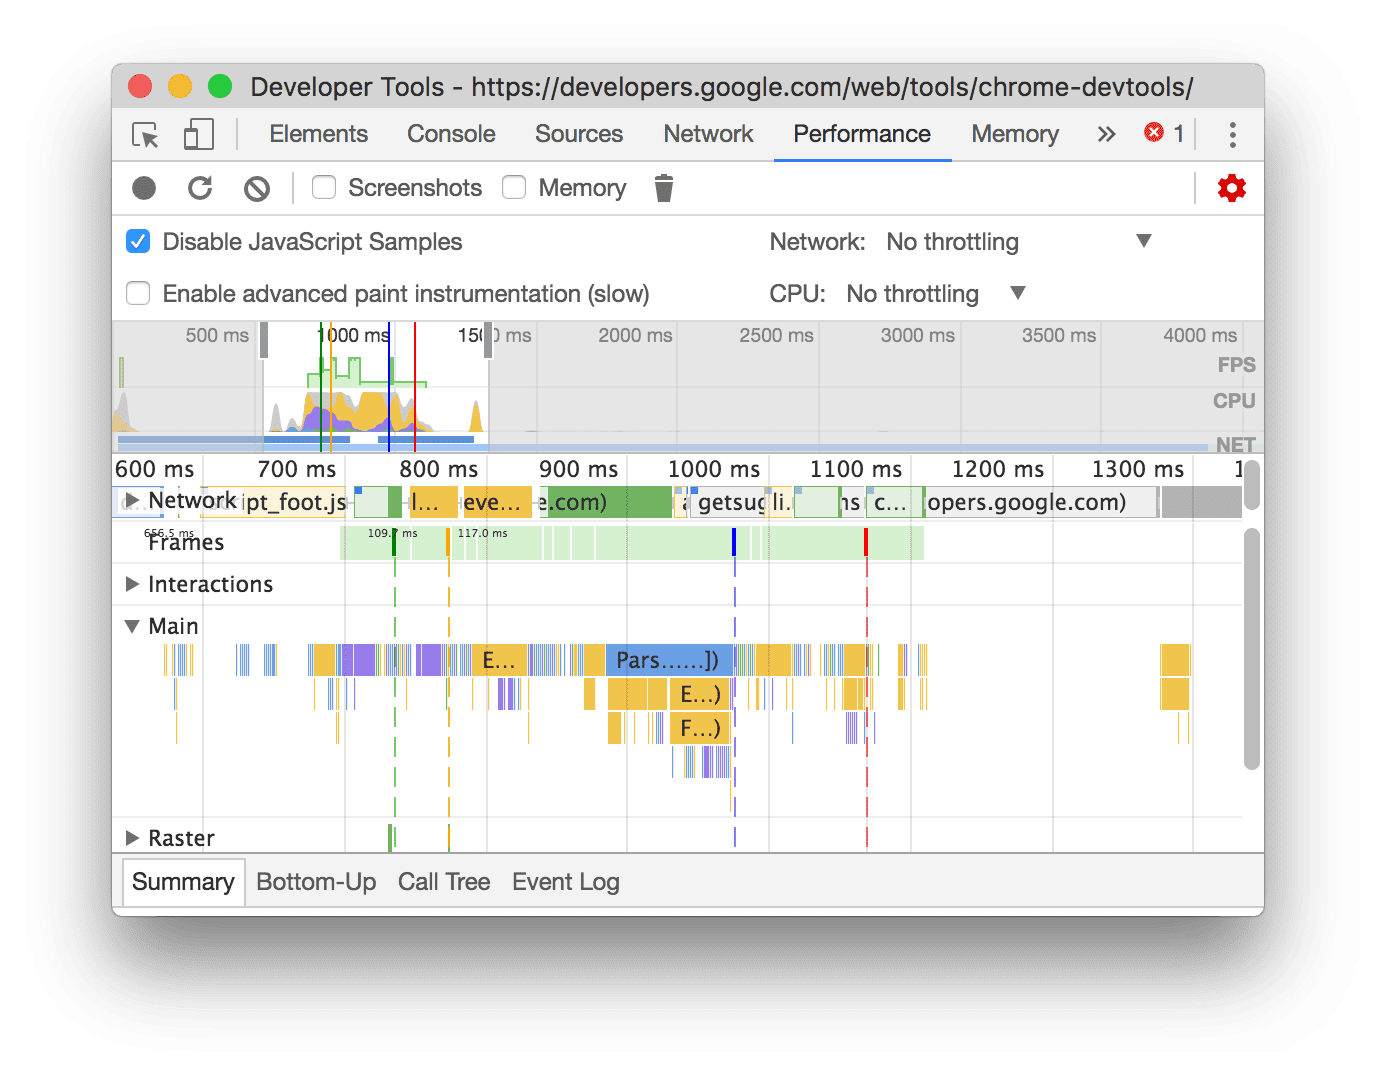
De volgende schermafbeeldingen laten het verschil zien tussen het uitschakelen en inschakelen van JavaScript-voorbeelden. Het hoofdspoor van de opname is veel korter wanneer sampling is uitgeschakeld, omdat alle JavaScript-aanroepstacks worden weggelaten.
Dit voorbeeld toont een opname met uitgeschakelde JS-samples.
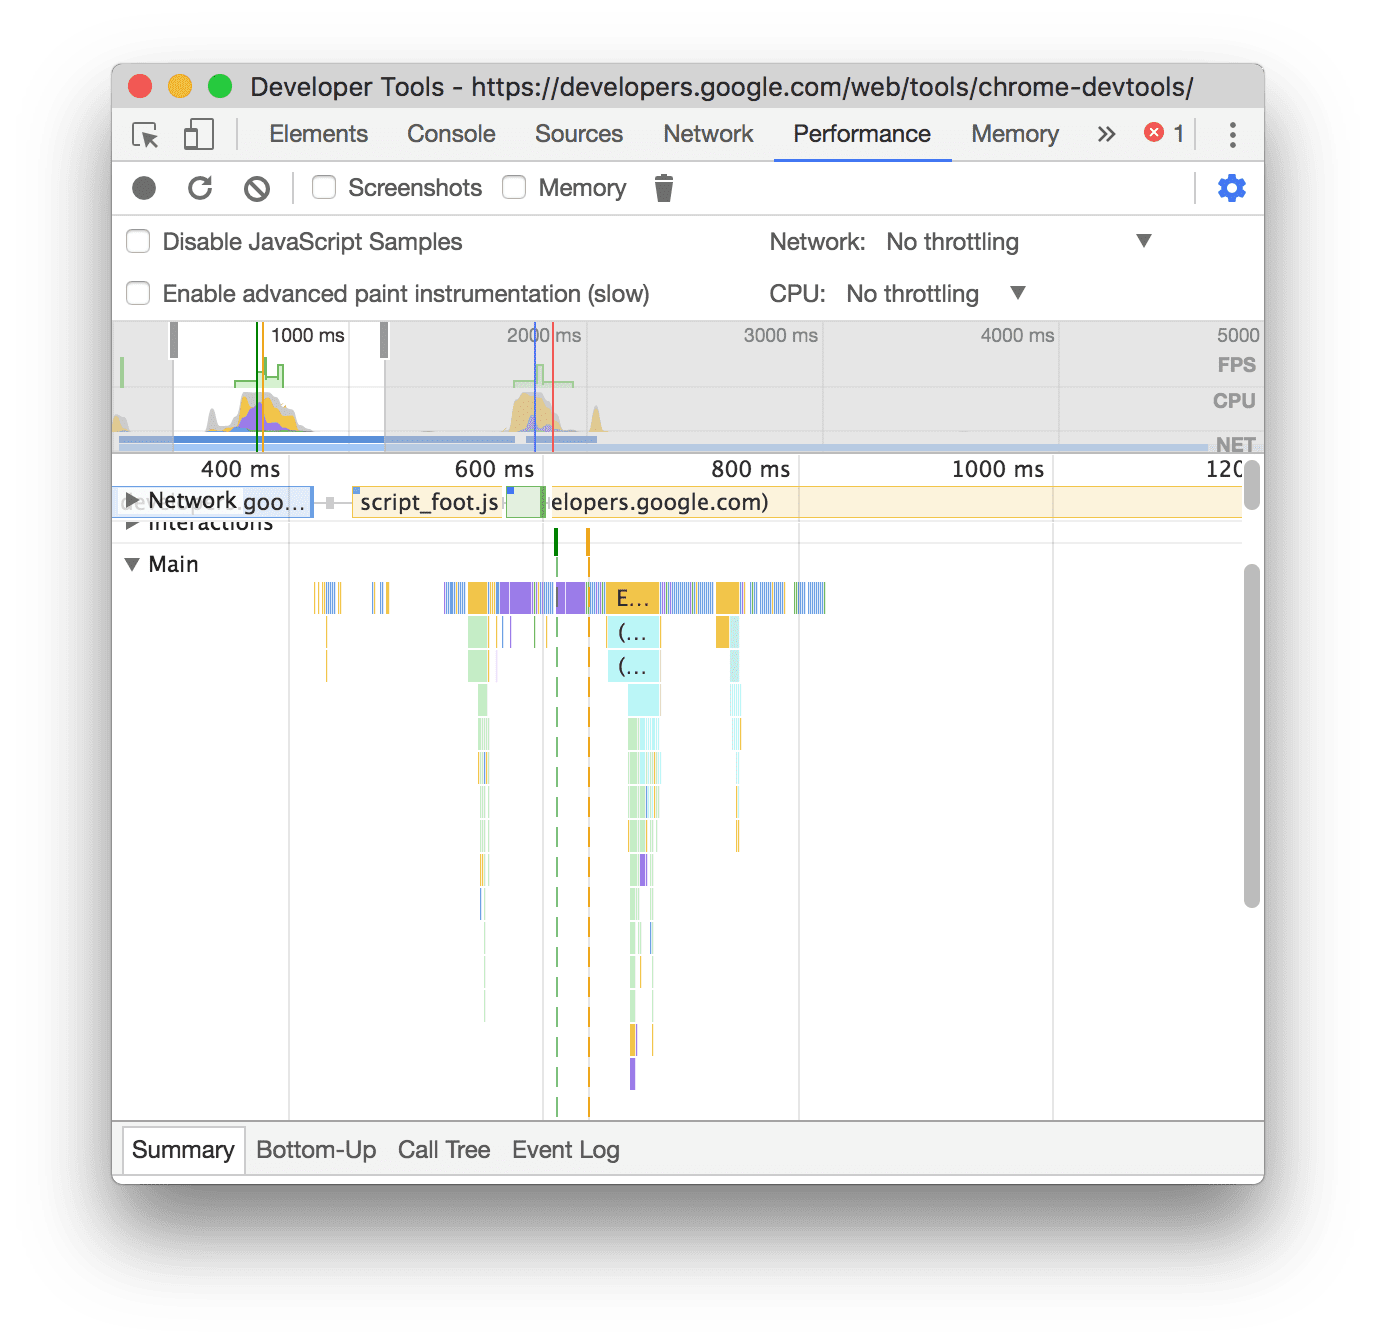
Dit voorbeeld toont een opname met ingeschakelde JS-samples.
Geef gas op het netwerk tijdens het opnemen
Het netwerk vertragen tijdens het opnemen:
- Open de opname-instellingen
 menu. Zie Opname-instellingen weergeven .
 - Stel Netwerk in op het gekozen beperkingsniveau.
In het vervolgkeuzemenu kan het paneel Prestaties ook een standaardvoorinstelling voor beperking aanbevelen, of een voorinstelling die de ervaring van uw gebruikers benadert op basis van veldgegevens .
Geef gas tijdens het opnemen
Om de CPU te vertragen tijdens het opnemen:
- Open de opname-instellingen
 menu. Zie Opname-instellingen weergeven .
 - Stel de CPU in op het gekozen beperkingsniveau.
Het beperken is afhankelijk van de mogelijkheden van uw computer. De optie 2x vertraging zorgt er bijvoorbeeld voor dat uw CPU 2 keer langzamer werkt dan normaal. DevTools kan de CPU's van mobiele apparaten niet echt simuleren, omdat de architectuur van mobiele apparaten heel anders is dan die van desktops en laptops.
In het vervolgkeuzemenu kan het paneel Prestaties ook een standaardvoorinstelling voor beperking aanbevelen, of een voorinstelling die de ervaring van uw gebruikers benadert op basis van veldgegevens .
Schakel CSS-selectorstatistieken in
Om de statistieken van uw CSS-regelselectors te bekijken tijdens langlopende Recalculate Style -gebeurtenissen:
- Open de opname-instellingen
 menu. Zie Opname-instellingen weergeven .
 - Schakel het selectievakje CSS-selectorstatistieken inschakelen in.
Zie voor meer details hoe u de prestaties van de CSS-selector analyseert tijdens stijlgebeurtenissen opnieuw berekenen .
Schakel geavanceerde verfinstrumentatie in
Gedetailleerde verfinstrumentatie bekijken:
- Open de opname-instellingen menu. Zie Opname-instellingen weergeven .
- Schakel het selectievakje Geavanceerde verfinstrumentatie inschakelen in.
Zie Lagen bekijken en Verfprofiler bekijken voor meer informatie over hoe u met de verfinformatie kunt omgaan.
Annoteer een opname en deel deze
Zodra een prestatietracering is vastgelegd , kunt u deze analyseren en annoteren om uw bevindingen te delen.
Om een opname te annoteren, opent u het tabblad Annotaties in de zijbalk aan de linkerkant van het paneel Prestaties . Er zijn verschillende manieren om een annotatie toe te voegen:
- Labelitem : Om een label aan een item toe te voegen, dubbelklikt u erop en typt u een label.
- Twee items verbinden : Om twee items met een pijl te verbinden, dubbelklikt u op het eerste item, klikt u op een pijl ernaast en klikt u vervolgens op het tweede item.
- Een tijdsperiode labelen : Om een willekeurige tijdsperiode te labelen, sleept u Shift-sleep vanaf het begin van een tijdsperiode naar het einde en typt u vervolgens een label.

In dit voorbeeld zijn er in de netwerktrack twee geannoteerde verzoeken, een verbinding daartussen, en een geannoteerd tijdsbereik dat roze is gemarkeerd. Het tabblad Annotaties toont het aantal annotaties naast de tabbladnaam, in dit voorbeeld 4.
Om een annotatie te verwijderen, beweegt u de muis eroverheen op het tabblad Annotaties en klikt u op de knop ernaast.
Om annotaties te verbergen voor de prestatietracering, vinkt u Annotaties verbergen aan onder aan het tabblad Annotaties .
Bewaar en deel een opname
Als u een opname wilt opslaan en deze later wilt delen met uw geannoteerde prestatiebevindingen, klikt u in de actiebalk bovenaan het prestatiepaneel Downloaden en selecteert u Trace opslaan .

U kunt ook Traceren zonder annotaties opslaan selecteren.
Laad een opname
Om een opname te laden, klikt u op Uploaden in de actiebalk bovenaan het paneel Prestaties .

In het deelvenster Prestaties worden annotaties weergegeven als deze in de trace aanwezig zijn.
Wis de vorige opname
Nadat u een opname hebt gemaakt, drukt u op Opname wissen ![]() om die opname uit het prestatiepaneel te wissen.
om die opname uit het prestatiepaneel te wissen.

Analyseer een uitvoeringsopname
Nadat u de runtimeprestaties of de laadprestaties hebt vastgelegd, biedt het paneel Prestaties veel gegevens voor het analyseren van de prestaties van wat er zojuist is gebeurd.
Krijg bruikbare inzichten
Het Prestatiepaneel consolideert prestatie-inzichten uit het Lighthouse -rapport en het nu verouderde paneel Prestatie-inzichten . Deze inzichten kunnen manieren voorstellen om de prestaties te verbeteren en een begeleide analyse bieden van de volgende prestatieproblemen, inclusief maar niet beperkt tot:
- LCP en INP per subonderdeel
- Ontdekking van LCP-verzoeken
- De boosdoeners van de indelingsverschuiving
- Geef blokkeringsverzoeken weer
- Derden
- Levering van afbeeldingen
- Latentie van documentverzoeken
- Viewport-optimalisatie voor mobiel
- CSS-selectorkosten
Om inzichten te gebruiken:
- Maak een uitvoeringsopname .
- Open in de linkerzijbalk van het prestatiepaneel het tabblad Inzichten , vouw verschillende secties uit, plaats de muisaanwijzer op items en klik erop. Het Prestatiepaneel zal de corresponderende gebeurtenissen in de trace markeren.
Navigeer door de opname
Om u te helpen navigeren, terwijl u de prestatietracering aanwijst, doet het paneel Prestaties het volgende:
- Toont u een verticale markering die het gehele prestatietracé omspant wanneer u de muisaanwijzer op het tijdlijnoverzicht plaatst.
- Markeert een bereik in het tijdlijnoverzicht wanneer u over items in de hoofdtrack beweegt.
Om uw uitvoeringsopname nauwkeurig te inspecteren, kunt u een deel van een opname selecteren, door een lange vlammengrafiek scrollen, in- en uitzoomen en broodkruimels gebruiken om tussen zoomniveaus te springen.
Gebruik sneltoetsen om te navigeren
Als u sneltoetsen wilt gebruiken om snel door de opname te navigeren, kiest u eerst de gewenste toetsenbordnavigatiestijl.
Klik in de rechterbovenhoek van het paneel op Snelkoppelingen weergeven en selecteer een van de volgende opties:
- Klassiek : zoomen met muiswiel (touchpad omhoog of omlaag) en verticaal scrollen met Shift + muiswiel.
- Modern : Verticaal scrollen met muiswiel, horizontaal scrollen met Shift + muiswiel en zoomen met Command/Control + muiswiel.
Het dialoogvenster met snelkoppelingen biedt u ook een spiekbriefje met de beschikbare snelkoppelingen.

Selecteer een deel van de opname
Onder de actiebalk van het prestatiepaneel en bovenaan de opname ziet u het tijdlijnoverzicht met de CPU- en NET -grafieken.

Om een deel van een opname te selecteren, klikt u op de knop, houdt u deze ingedrukt en sleept u vervolgens naar links of rechts over het tijdlijnoverzicht .
Om een portie te selecteren met behulp van het toetsenbord:
- Focus op het hoofdspoor of een van zijn buren.
- Gebruik de toetsen W , A , S en D om respectievelijk in te zoomen, naar links te bewegen, uit te zoomen en naar rechts te bewegen.
Een gedeelte selecteren met een trackpad:
- Beweeg over het tijdlijnoverzichtgedeelte of een van de tracks ( Main en zijn buren).
- Veeg met twee vingers omhoog om uit te zoomen, veeg naar links om naar links te gaan, veeg omlaag om in te zoomen en veeg naar rechts om naar rechts te gaan.
Maak broodkruimels en spring tussen zoomniveaus
Met het tijdlijnoverzicht kunt u meerdere geneste broodkruimels achter elkaar maken, de zoomniveaus verhogen en vervolgens vrijelijk tussen zoomniveaus springen.
Broodkruimels maken en gebruiken:
- Selecteer in Tijdlijnoverzicht een gedeelte van de opname.
- Beweeg over de selectie en klik op de knop N ms . De selectie wordt groter en vult het tijdlijnoverzicht . Bovenaan het tijdlijnoverzicht begint zich een keten van broodkruimels op te bouwen.
- Herhaal de vorige twee stappen om nog een geneste broodkruimel te maken. U kunt doorgaan met het nesten van broodkruimels zolang het selectiebereik groter is dan 5 milliseconden.
- Om naar een gekozen zoomniveau te springen, klikt u op de bijbehorende broodkruimel in de keten bovenaan het tijdlijnoverzicht .
Als u de onderliggende broodkruimels van een broodkruimel wilt verwijderen, klikt u met de rechtermuisknop op de bovenliggende broodkruimel en selecteert u Onderliggende broodkruimels verwijderen .
Blader door een lange vlammengrafiek
Om door een lange vlammengrafiek op het hoofdspoor of een van de aangrenzende sporen te scrollen, klikt u en houdt u de muisknop ingedrukt en sleept u vervolgens in een willekeurige richting totdat wat u zoekt in beeld komt.
Negeer irrelevante scripts in het vlamdiagram
Om u beter op uw code te kunnen concentreren, kunt u irrelevante scripts toevoegen aan de negeerlijst.
Voer een van de volgende handelingen uit om scripts te negeren:
- Klik op Dialoogvenster Negeerlijstinstellingen weergeven in de bovenste actiebalk en typ een reguliere expressie in het invoerveld. Het vlammendiagram past de nieuwe regel toe terwijl u typt.
- Klik met de rechtermuisknop op een script en selecteer Script toevoegen aan negeerlijst . Het paneel Prestaties voegt dit script toe aan de lijst in het dialoogvenster Negeerlijstinstellingen weergeven .
Het paneel zal overmatig nesten voor dergelijke scripts automatisch samenvouwen en ze markeren als On ignore list ( REGULAR_EXPRESSION ) .
In het dialoogvenster Instellingen voor negeerlijst tonen kunt u de regels voor de negeerlijst in- en uitschakelen.
Om een script uit de negeerlijst te verwijderen, klikt u er met de rechtermuisknop op in het vlamdiagram en selecteert u Script uit de negeerlijst verwijderen of beweegt u de muis eroverheen in het dialoogvenster Instellingen negeerlijst weergeven klikt u op Verwijderen
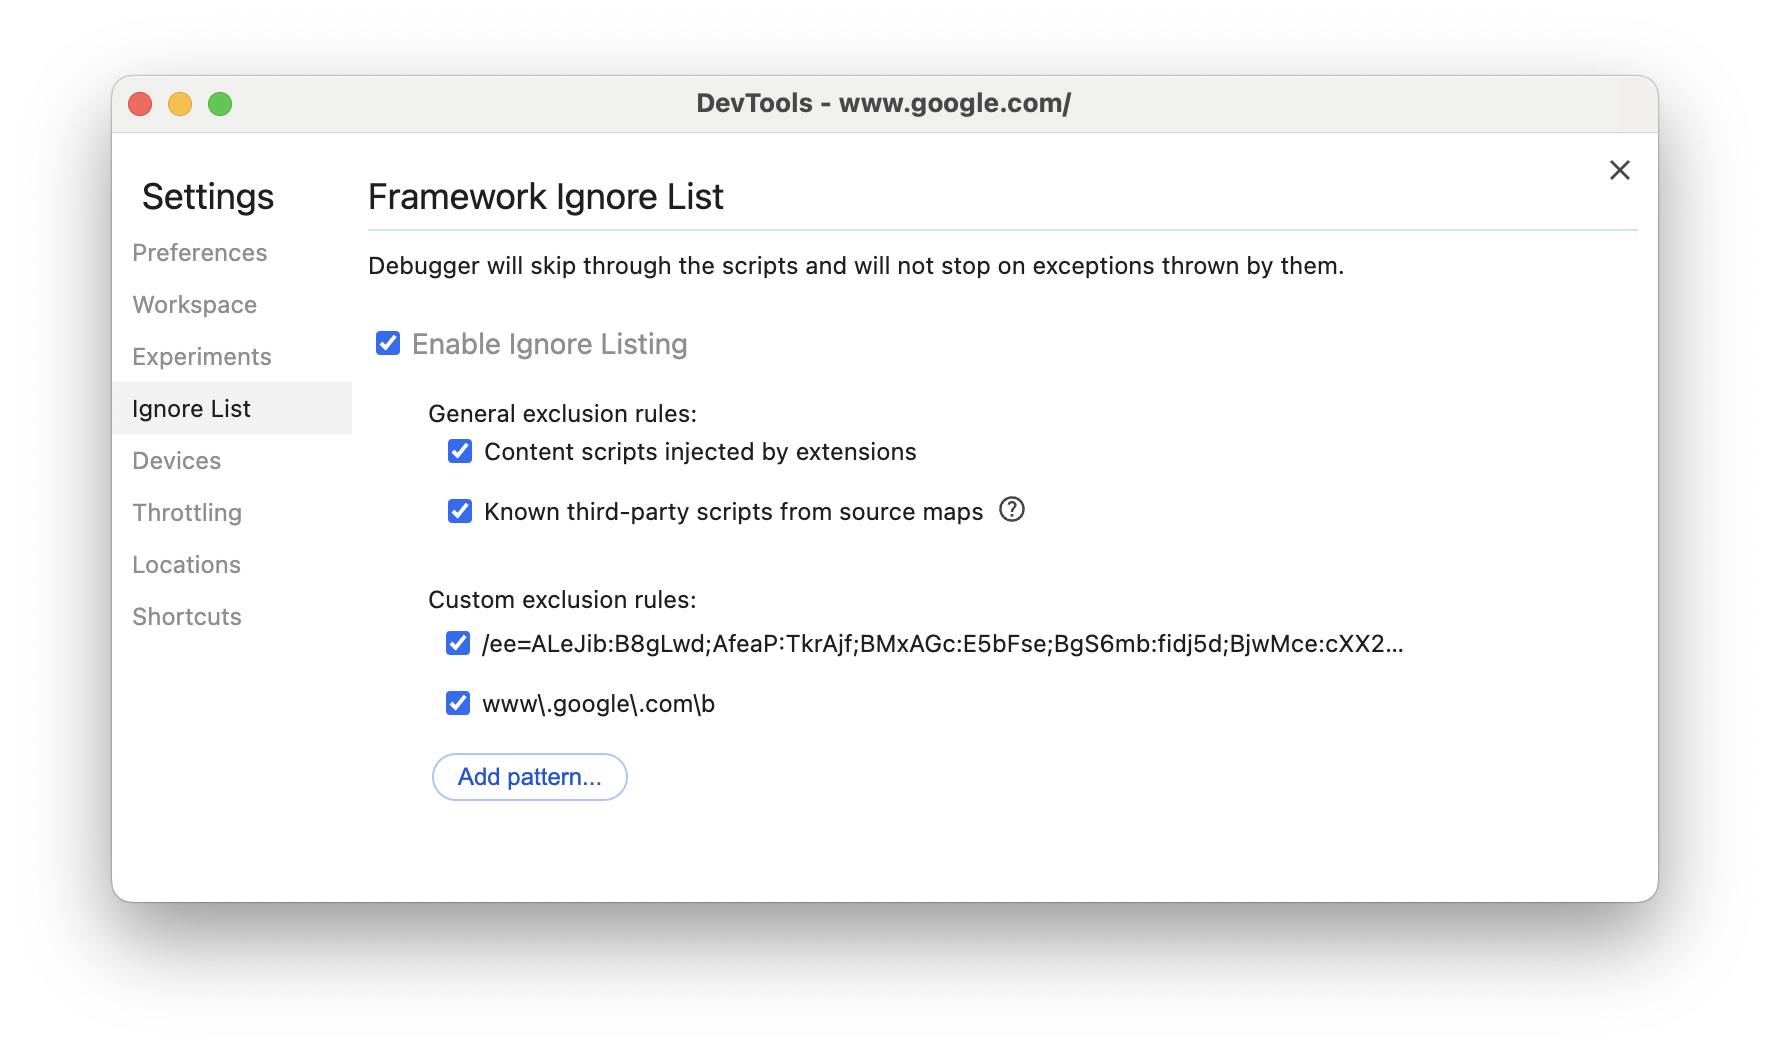
DevTools slaat de regels voor de negeerlijst op die u toevoegt in Instellingen > Negeerlijst .
Als u zich alleen op first-party scripts wilt concentreren, vinkt u bovendien Dim 3rd Parties aan. In het Prestatiepaneel worden scripts van derden grijs weergegeven.
Zoek activiteiten
U kunt zoeken tussen de activiteiten in het Hoofdspoor en aanvragen in het Netwerkspoor .
Om een zoekvak onder aan het prestatiepaneel te openen, drukt u op:
- macOS: Command + F
- Windows, Linux: Controle + F

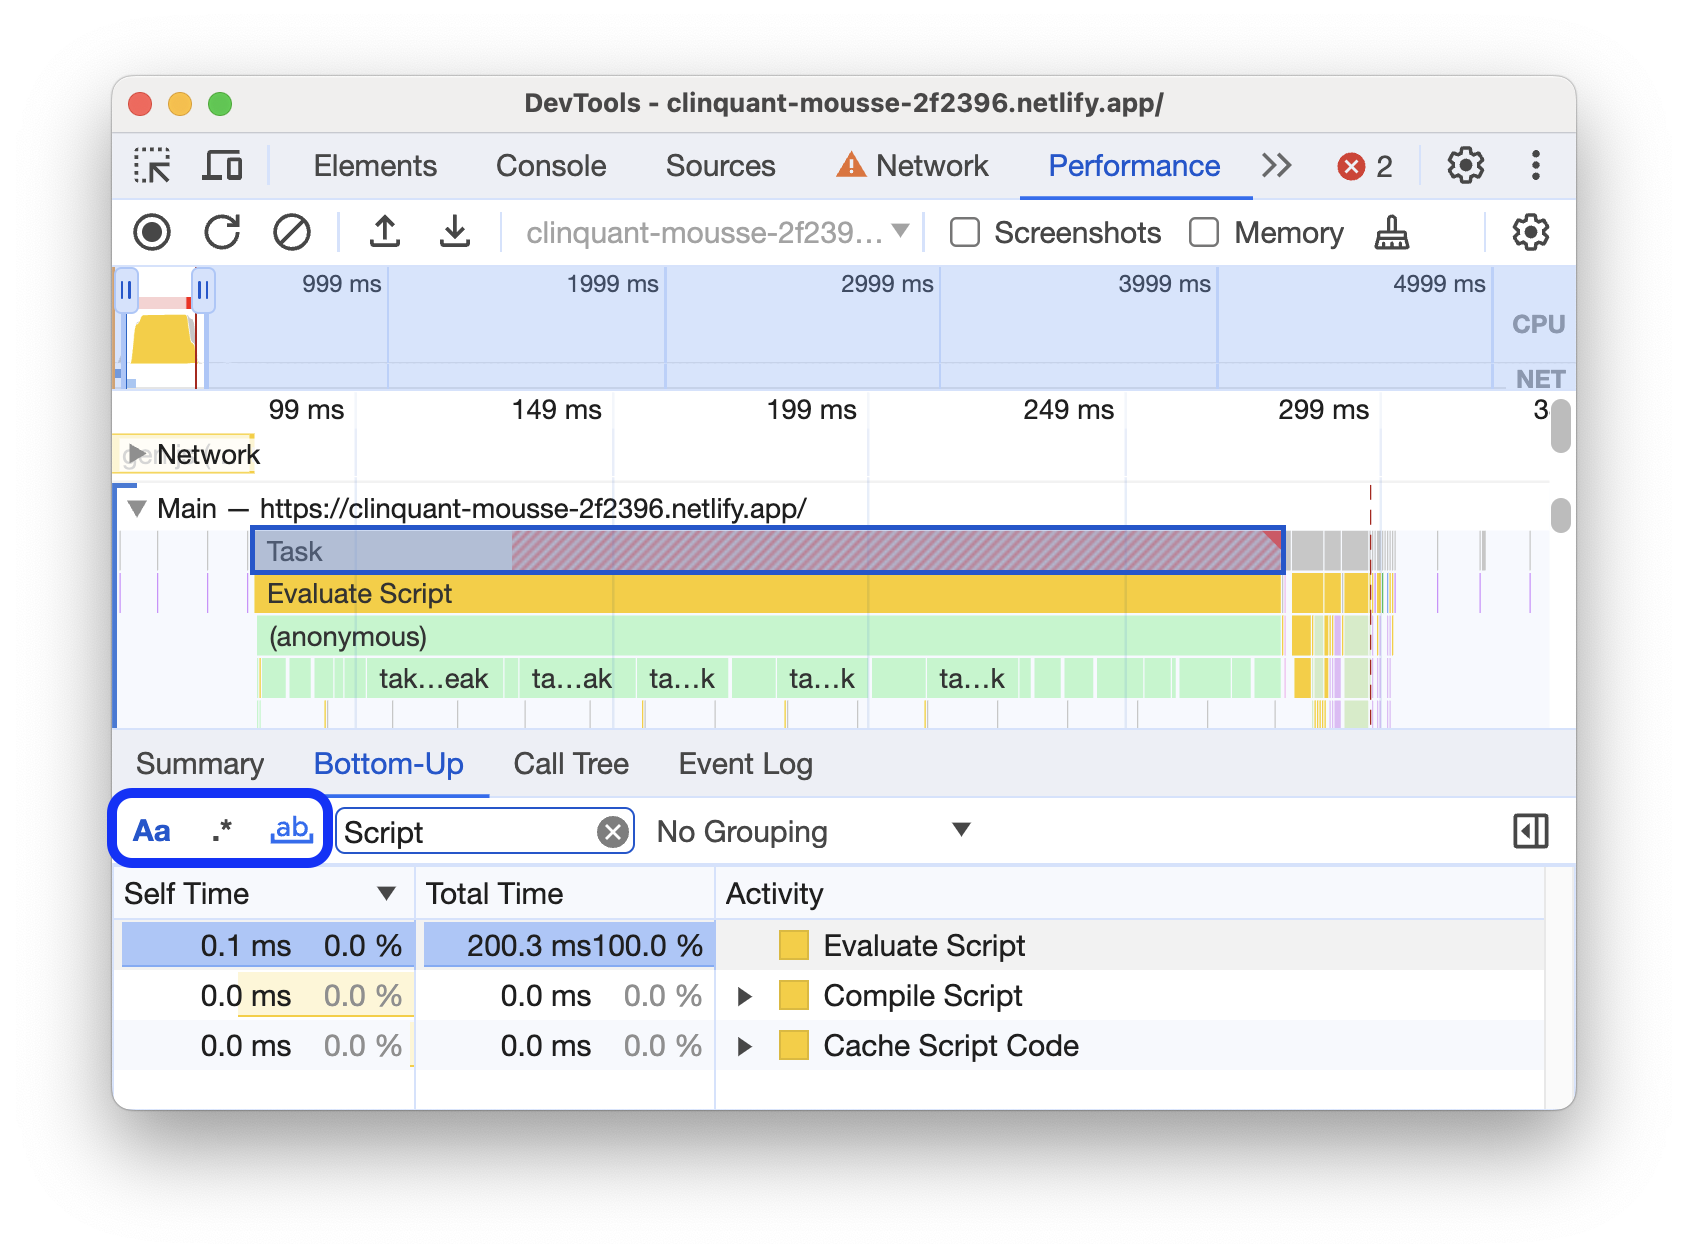
Dit voorbeeld toont een reguliere expressie in het zoekvak onderaan die elke activiteit vindt die begint met E .
Activiteiten doorlopen die overeenkomen met uw vraag:
- Klik op de knoppen Vorige of Volgende .
- Druk op Shift + Enter om de vorige te selecteren of op Enter om de volgende te selecteren.
Het deelvenster Prestaties toont knopinfo over de activiteit die in het zoekvak is geselecteerd.
Query-instellingen wijzigen:
- Klik op Match case om de zoekopdracht hoofdlettergevoelig te maken.
- Klik op Reguliere expressie om een reguliere expressie in uw query te gebruiken.
Om het zoekvak te verbergen, klikt u op Annuleren .
Verander de volgorde van de nummers en verberg ze
Om de prestatietracering overzichtelijker te maken, kunt u de volgorde van de tracks wijzigen en de irrelevante tracks verbergen in de trackconfiguratiemodus.
Tracks verplaatsen en verbergen:
- Om de configuratiemodus te openen, klikt u met de rechtermuisknop op een tracknaam en selecteert u Tracks configureren .
- Klik op up of down om een track omhoog of omlaag te verplaatsen. Klik op om het te verbergen.
- Wanneer u klaar bent, klikt u onderaan op Configuratie van tracks voltooien om de configuratiemodus te verlaten.
Bekijk de video om deze workflow in actie te zien.
Het prestatiepaneel slaat de trackconfiguratie op voor nieuwe traceringen, maar niet voor volgende DevTools-sessies.
Bekijk hoofdthreadactiviteit
Gebruik het hoofdspoor om de activiteit te bekijken die heeft plaatsgevonden op de hoofdthread van de pagina.

Klik op een gebeurtenis om meer informatie erover te bekijken op het tabblad Samenvatting , inclusief maar niet beperkt tot: timings, stacktraces, koppelingen naar overeenkomstige scripts en eventuele namen van derden. Het Prestatiepaneel schetst de geselecteerde gebeurtenis in blauw.

In dit voorbeeld ziet u meer informatie over de get -functieaanroepgebeurtenis op het tabblad Samenvatting .
Lees het vlammendiagram
Het Prestatiepaneel vertegenwoordigt de hoofdthreadactiviteit in een vlammendiagram. De x-as vertegenwoordigt de opname in de loop van de tijd. De y-as vertegenwoordigt de call-stack. De gebeurtenissen bovenaan veroorzaken de onderstaande gebeurtenissen.

Dit voorbeeld toont een vlammendiagram in het hoofdspoor . Een click veroorzaakte een anonieme functieaanroep. Deze functie riep op zijn beurt onEndpointClick_ aan, die handleClick_ aanriep, enzovoort.
Het paneel Prestaties wijst willekeurige kleuren aan scripts toe om de vlammenkaart op te splitsen en leesbaarder te maken. In het eerdere voorbeeld zijn functieaanroepen van één script lichtblauw gekleurd. Oproepen van een ander script zijn lichtroze gekleurd. Het donkerdere geel vertegenwoordigt scriptactiviteit en de paarse gebeurtenis vertegenwoordigt renderingactiviteit. Deze donkerder gele en paarse gebeurtenissen zijn consistent in alle opnames.
Lange taken worden ook gemarkeerd met een rode driehoek en met het gedeelte langer dan 50 milliseconden rood gearceerd:

In dit voorbeeld duurde de taak meer dan 400 milliseconden, dus het deel dat de laatste 350 milliseconden vertegenwoordigt, is rood gearceerd, terwijl de eerste 50 milliseconden dat niet zijn.
Bovendien toont het hoofdspoor informatie over CPU-profielen die zijn gestart en gestopt met de consolefuncties profile() en profileEnd() .
Zie JavaScript-voorbeelden uitschakelen om het gedetailleerde vlammendiagram van JavaScript-aanroepen te verbergen. Wanneer JS-voorbeelden zijn uitgeschakeld, ziet u alleen de gebeurtenissen op hoog niveau, zoals Event (click) en Function Call .
Volg initiatiefnemers van evenementen
Op het hoofdspoor kunnen pijlen worden weergegeven die de volgende initiatiefnemers met elkaar verbinden en de gebeurtenissen die ze hebben veroorzaakt:
- Ongeldigheid van stijl of lay-out -> Stijlen of lay-out opnieuw berekenen
- Animatieframe aanvragen -> Animatieframe geactiveerd
- Inactief terugbellen aanvragen -> Inactief terugbellen activeren
- Installatietimer -> Timer geactiveerd
- Maak een WebSocket -> Verzenden... en ontvang een WebSocket-handshake of vernietig WebSocket
- PostTask plannen -> PostTask afvuren of postTask afbreken
Om de pijlen te zien, zoek je een initiator of de gebeurtenis die deze veroorzaakte in de vlammenkaart en selecteer je deze.

Indien geselecteerd, toont het tabblad Samenvatting Initiator voor links voor initiatiefnemers en Geïnitieerd door links voor de gebeurtenissen die ze hebben veroorzaakt. Klik erop om tussen de overeenkomstige gebeurtenissen te springen.

Verberg functies en hun kinderen in de vlammengrafiek
Om het vlammendiagram in de hoofdthread overzichtelijker te maken, kunt u geselecteerde functies of hun onderliggende functies verbergen:
Klik in het hoofdspoor met de rechtermuisknop op een functie en kies een van de volgende opties of druk op de bijbehorende sneltoets:
- Functie verbergen (
H) - Kinderen verbergen (
C) - Herhalende kinderen verbergen (
R) - Kinderen resetten (
U) - Tracering opnieuw instellen (
T) - Script toevoegen aan negeerlijst (
I)

Er verschijnt een vervolgkeuzeknop naast de functienaam met verborgen onderliggende elementen.
- Functie verbergen (
Om het aantal verborgen kinderen te zien, beweegt u de muis over de vervolgkeuzeknop .

Om een functie met verborgen kinderen of de hele vlammenkaart te resetten, selecteert u de functie en drukt
Uop U of klikt u met de rechtermuisknop op een functie en selecteert u Trace traceren .
Negeer scripts in het vlammendiagram
Om een script aan de negeerlijst toe te voegen, klikt u met de rechtermuisknop op een script in het diagram en selecteert u Script toevoegen aan negeerlijst .

Het diagram vouwt genegeerde scripts samen, markeert ze als Op negeerlijst en voegt ze toe aan de Aangepaste uitsluitingsregels in Instellingen > Negeerlijst . Genegeerde scripts worden opgeslagen totdat u ze uit de tracering of uit de aangepaste uitsluitingsregels verwijdert.
Bekijk activiteiten in een tabel
Nadat u een pagina hebt opgenomen, hoeft u niet alleen op het hoofdspoor te vertrouwen om activiteiten te analyseren. DevTools biedt ook drie tabelweergaven voor het analyseren van activiteiten. Elke weergave geeft u een ander perspectief op de activiteiten:
- Als u de hoofdactiviteiten wilt bekijken die het meeste werk veroorzaken, gebruikt u het tabblad Call Tree .
- Wanneer u de activiteiten wilt bekijken waaraan direct de meeste tijd is besteed, gebruikt u het tabblad Bottom-Up .
- Als u de activiteiten wilt bekijken in de volgorde waarin ze plaatsvonden tijdens de opname, gebruikt u het tabblad Gebeurtenislogboek .
Om u te helpen sneller te vinden wat u zoekt, hebben alle drie de tabbladen knoppen voor geavanceerd filteren naast de filterbalk :
- Overeenkomstgeval .
- Reguliere expressie .
- Zoek het hele woord .
Elke tabelweergave in het deelvenster Prestaties toont koppelingen voor activiteiten zoals functieaanroepen. Om u te helpen bij het opsporen van fouten, vindt DevTools de overeenkomstige functiedeclaraties in bronbestanden. Als de juiste bronkaarten aanwezig en ingeschakeld zijn, vindt DevTools bovendien automatisch de originele bestanden.
Klik op een koppeling om een bronbestand te openen in het deelvenster Bronnen.

Root-activiteiten
Hier volgt een uitleg van het concept van hoofdactiviteiten dat wordt vermeld in de secties Oproepboom , Bottom-Up en Gebeurtenislogboek .
Root-activiteiten zijn activiteiten die ervoor zorgen dat de browser wat werk doet. Wanneer u bijvoorbeeld op een pagina klikt, activeert de browser een Event als hoofdactiviteit. Die Event kan er dan voor zorgen dat een handler wordt uitgevoerd.
In het vlammendiagram van het hoofdtrack staan de hoofdactiviteiten bovenaan het diagram. Op de tabbladen Oproepboom en Gebeurtenislogboek zijn rootactiviteiten de items op het hoogste niveau.
Zie het tabblad Oproepboom voor een voorbeeld van rootactiviteiten.
Het tabblad Oproepboom
Gebruik het tabblad Call Tree om te bekijken welke rootactiviteiten het meeste werk veroorzaken.
Op het tabblad Oproepboom worden alleen activiteiten weergegeven tijdens het geselecteerde gedeelte van de opname. Zie Een gedeelte van een opname selecteren voor informatie over het selecteren van gedeelten.

In dit voorbeeld zijn de items op het hoogste niveau in de kolom Activiteit , zoals Event , Paint en Composite Layers , hoofdactiviteiten. De nesting vertegenwoordigt de call-stack. In dit voorbeeld veroorzaakte de Event de Function Call , die button.addEventListener veroorzaakte, wat b veroorzaakte, enzovoort.
Zelftijd vertegenwoordigt de tijd die direct aan die activiteit wordt besteed. Totale tijd vertegenwoordigt de tijd die is doorgebracht in die activiteit of een van de onderliggende activiteiten ervan.
Klik op Zelftijd , Totale tijd of Activiteit om de tabel op die kolom te sorteren.
Gebruik het vak Filter om gebeurtenissen te filteren op activiteitsnaam.
Het menu Groeperen is standaard ingesteld op Geen groepering . Gebruik het menu Groeperen om de activiteitentabel te sorteren op basis van verschillende criteria.
Klik op Zwaarste stapel weergeven ![]() om een andere tabel rechts van de activiteitentabel weer te geven. Klik op een activiteit om de tabel met de zwaarste stapel in te vullen. In de tabel Zwaarste stapel ziet u welke kinderen van de geselecteerde activiteit de langste tijd nodig hadden om uit te voeren.
om een andere tabel rechts van de activiteitentabel weer te geven. Klik op een activiteit om de tabel met de zwaarste stapel in te vullen. In de tabel Zwaarste stapel ziet u welke kinderen van de geselecteerde activiteit de langste tijd nodig hadden om uit te voeren.
Het tabblad Bottom-Up
Gebruik het tabblad Bottom-Up om te bekijken welke activiteiten in totaal direct de meeste tijd in beslag namen.
Op het tabblad Bottom-Up worden alleen activiteiten weergegeven tijdens het geselecteerde gedeelte van de opname. Zie Een gedeelte van een opname selecteren voor informatie over het selecteren van gedeelten.

In het vlamdiagram van het hoofdspoor van dit voorbeeld kun je zien dat bijna alle tijd werd besteed aan het uitvoeren van de drie oproepen tot wait() . De belangrijkste activiteit op het tabblad Bottom-Up is dus wait . In de vlammengrafiek zijn de gele oproepen onder de oproepen om te wait feitelijk duizenden Minor GC oproepen. Dienovereenkomstig kunt u zien dat op het tabblad Bottom-Up de op een na duurste activiteit Minor GC is.
De kolom Zelftijd vertegenwoordigt de totale tijd die rechtstreeks aan die activiteit is besteed, in alle gevallen ervan.
De kolom Totale tijd vertegenwoordigt de totale tijd die is doorgebracht in die activiteit of een van de onderliggende activiteiten ervan.
Het tabblad Gebeurtenislogboek
Gebruik het tabblad Gebeurtenislogboek om activiteiten te bekijken in de volgorde waarin ze plaatsvonden tijdens de opname.
Op het tabblad Gebeurtenislogboek worden alleen activiteiten weergegeven tijdens het geselecteerde gedeelte van de opname. Zie Een gedeelte van een opname selecteren voor informatie over het selecteren van gedeelten.

De kolom Starttijd vertegenwoordigt het punt waarop die activiteit begon, relatief ten opzichte van het begin van de opname. De starttijd van 1573.0 ms voor het geselecteerde item in dit voorbeeld betekent dat de activiteit 1573 ms na het starten van de opname begon.
De kolom Zelftijd vertegenwoordigt de tijd die rechtstreeks aan die activiteit wordt besteed.
De kolommen Totale tijd vertegenwoordigen de tijd die rechtstreeks aan die activiteit of aan een van de onderliggende activiteiten is besteed.
Klik op Starttijd , Zelftijd of Totale tijd om de tabel op die kolom te sorteren.
Gebruik het filtervak om activiteiten op naam te filteren.
Gebruik het menu Duur om activiteiten eruit te filteren die minder dan 1 ms of 15 ms duurden. Standaard is het menu Duur ingesteld op Alles , wat betekent dat alle activiteiten worden weergegeven.
Schakel de selectievakjes Loading , Scripting , Rendering of Painting uit om alle activiteiten uit die categorieën te filteren.
Bekijk prestatiemarkeringen
In een overlay met verticale lijnen over het prestatiespoor ziet u belangrijke prestatiemarkeringen, zoals:
- Eerste verf (FP)
- Eerste inhoudsvolle verf (FCP)
- Grootste inhoudsvolle verf (LCP)
- DOMContentLoaded-gebeurtenis (DCL)
- Onload-evenement (L)

Beweeg over de namen van de markeringen onder aan de trace om hun tijdstempel te zien.
Bekijk aangepaste timings
Bekijk op het Timings -circuit uw aangepaste prestatiemarkeringen, zoals:
-
performance.mark()oproepen. Hieronder wordt een individuele markering met tooltip weergegeven op 813,44 ms, met de naam Starten met het uitvoeren van JavaScript . -
performance.measure()-aanroepen. Hieronder wordt een gele spanwijdte weergegeven met de naam Slow Interaction .

Selecteer een markering om meer details te zien op het tabblad Samenvatting , inclusief de tijdstempel, totale tijd, zelftijd en het detail . Voor performance.mark() - en performance.measure() aanroepen toont het tabblad ook stacktraces.
Bekijk interacties
Bekijk gebruikersinteracties op het Interacties -spoor om potentiële problemen met de responsiviteit op te sporen.
Interacties bekijken:
- Open bijvoorbeeld DevTools op deze demopagina .
- Open het prestatiepaneel en start een opname .
- Klik op een element (koffie) en stop de opname.
- Zoek het interactiespoor in de tijdlijn.

In dit voorbeeld toont het interactiespoor de aanwijzerinteractie . Interacties hebben snorharen die vertragingen in de invoer en presentatie aangeven bij de grenzen van de verwerkingstijd. Beweeg de muis over de interactie om tooltip te zien met invoervertraging, verwerkingstijd en presentatievertraging.
Het Interacties -spoor toont ook Interaction to Next Paint (INP) -waarschuwingen voor interacties langer dan 200 milliseconden op het tabblad Samenvatting en in een tooltip bij het aanwijzen van de muis:

De interactietrack markeert de interacties van meer dan 200 milliseconden met een rode driehoek in de rechterbovenhoek.
Bekijk lay-outverschuivingen
Bekijk lay-outverschuivingen op het spoor Lay-outverschuivingen . Verschuivingen worden weergegeven als paarse diamanten en zijn gegroepeerd in clusters (paarse lijnen) op basis van hun nabijheid op de tijdlijn.

Om een element te markeren dat een lay-outverschuiving in het venster veroorzaakte, beweegt u de muis over de overeenkomstige diamant.
Als u meer informatie wilt zien over een lay-outverschuiving of -verschuivingen op het tabblad Samenvatting met timings, scores, elementen en potentiële boosdoeners, klikt u op de bijbehorende ruit of cluster.
Zie Cumulatieve lay-outverschuiving (CLS) voor meer informatie.
Bekijk animaties
Bekijk animaties op het animatiespoor . Animaties worden genoemd als overeenkomstige CSS-eigenschappen of eventuele elementen, bijvoorbeeld transform of my-element . Animaties die geen compositie vormen, zijn gemarkeerd met rode driehoekjes in de rechterbovenhoek.

Selecteer een animatie om meer details op het tabblad Samenvatting te zien, inclusief de redenen voor mislukte composities.
Bekijk GPU-activiteit
Bekijk GPU-activiteit in het GPU- gedeelte.

Bekijk rasteractiviteit
Bekijk rasteractiviteit in de sectie Threadpool .

Analyseer frames per seconde (FPS)
DevTools biedt talloze manieren om frames per seconde te analyseren:
- Gebruik het gedeelte Frames om te zien hoe lang een bepaald frame duurde.
- Gebruik de FPS-meter voor een realtime schatting van de FPS terwijl de pagina wordt uitgevoerd. Zie Frames per seconde in realtime bekijken met de FPS-meter .
De sectie Frames
In het gedeelte Frames kunt u precies zien hoe lang een bepaald frame duurde.
Beweeg over een frame om tooltip te bekijken met meer informatie erover.

Dit voorbeeld toont tooltip wanneer u over een frame beweegt.
In de sectie Frames kunnen vier typen frames worden weergegeven:
- Stationair frame (wit) . Geen wijzigingen.
- Kader (groen) . Geleverd zoals verwacht en op tijd.
- Gedeeltelijk gepresenteerd frame (geel met een dun, breed streepjespatroon) . Chrome heeft zijn best gedaan om op zijn minst enkele visuele updates op tijd weer te geven. Bijvoorbeeld als het werk van de hoofdthread van het rendererproces (canvasanimatie) laat is, maar de compositorthread (scrollen) op tijd is.
- Verlaagd frame (rood met een dicht patroon van ononderbroken lijnen) . Chrome kan het frame niet binnen een redelijke tijd weergeven.

Dit voorbeeld toont tooltip wanneer u over een gedeeltelijk weergegeven frame beweegt.
Klik op een frame om nog meer informatie over het frame te bekijken op het tabblad Samenvatting . DevTools schetst het geselecteerde frame in blauw.

Bekijk netwerkverzoeken
Vouw de sectie Netwerk uit om een waterval van netwerkverzoeken te bekijken die plaatsvonden tijdens de opname van de uitvoering.

Naast de netwerktracknaam staat een legenda met kleurgecodeerde verzoektypen.
Renderblokkeringsverzoeken zijn gemarkeerd met een rode driehoek in de rechterbovenhoek.
Beweeg de muis over een verzoek om tooltip te zien met:
- De URL van het verzoek en de totale tijd die nodig was om het uit te voeren.
- Prioriteit of een wijziging van prioriteit, bijvoorbeeld
Medium -> High. - Of het verzoek
Render blockingis of niet. - Een overzicht van de aanvraagtijden, zoals later beschreven.
Wanneer u op een verzoek klikt, tekent het netwerkspoor een pijl van de initiator naar het verzoek.
Bovendien toont het paneel Prestaties u het tabblad Samenvatting met meer informatie over het verzoek, inclusief maar niet beperkt tot de velden Initiële prioriteit en (eind) prioriteit . Als hun waarden verschillen, is de ophaalprioriteit van het verzoek gewijzigd tijdens de opname. Zie Het laden van bronnen optimaliseren met de Fetch Priority API voor meer informatie.
Het tabblad Samenvatting toont ook een overzicht van de timing van het verzoek.

Het verzoek voor www.google.com wordt weergegeven door een lijn aan de linkerkant ( |– ), een balk in het midden met een donker gedeelte en een licht gedeelte, en een lijn aan de rechterkant ( –| ).
Een ander tijdsoverzicht vindt u op het tabblad Netwerk . Klik met de rechtermuisknop op het verzoek in de netwerktrack of de URL ervan op het tabblad Samenvatting en klik op Openbaar maken in het netwerkpaneel . DevTools brengt u naar het netwerkpaneel en selecteert het bijbehorende verzoek. Open het tabblad Timing .

Hier ziet u hoe deze twee uitsplitsingen met elkaar in verband staan:
- De linkerregel (
|–) is alles tot aan deConnection startmet gebeurtenissen, inclusief. Met andere woorden, het is alles vóórRequest Sent. - Het lichte gedeelte van de balk is
Request sentenWaiting for server response. - Het donkere gedeelte van de balk is
Content download. - De rechter regel (
–|) is de tijd die wordt besteed aan het wachten op de hoofdthread. Het tabblad Netwerk > Timing laat dit niet zien.
Bekijk geheugenstatistieken
Schakel het selectievakje Geheugen in om geheugenstatistieken van de laatste opname te bekijken.

DevTools geeft een nieuw geheugendiagram weer, boven het tabblad Samenvatting . Er is ook een nieuw diagram onder het NET- diagram, genaamd HEAP . Het HEAP -diagram biedt dezelfde informatie als de JS Heap -regel in het geheugendiagram .

In dit voorbeeld worden geheugenstatistieken weergegeven boven het tabblad Samenvatting .
De gekleurde lijnen op de kaart verwijzen naar de gekleurde selectievakjes boven de kaart. Schakel een selectievakje uit om die categorie in het diagram te verbergen.
Het diagram toont alleen het gebied van de opname dat is geselecteerd. In het eerdere voorbeeld toont het geheugendiagram alleen het geheugengebruik voor het begin van de opname, tot ongeveer 1000 ms.
Bekijk de duur van een gedeelte van een opname
Wanneer u een sectie als Netwerk of Hoofd analyseert, heeft u soms een nauwkeurigere schatting nodig van hoe lang bepaalde gebeurtenissen hebben geduurd. Houd Shift ingedrukt, klik en houd vast en sleep naar links of rechts om een deel van de opname te selecteren. Onderaan uw selectie laat DevTools zien hoe lang dat gedeelte duurde.

In dit voorbeeld geeft de tijdstempel 488.53ms onder aan het geselecteerde gedeelte aan hoe lang dat gedeelte duurde.
Bekijk een schermafdruk
Zie Schermafbeeldingen maken tijdens het opnemen voor meer informatie over het inschakelen van schermafbeeldingen.
Beweeg over het tijdlijnoverzicht om een screenshot te bekijken van hoe de pagina er op dat moment van de opname uitzag. Het tijdlijnoverzicht is de sectie die de CPU- , FPS- en NET -grafieken bevat.

U kunt ook schermafbeeldingen bekijken door op een frame in de sectie Frames te klikken. DevTools geeft een kleine versie van de schermafbeelding weer op het tabblad Samenvatting .

Dit voorbeeld toont de schermafbeelding voor het frame 195.5ms op het tabblad Samenvatting wanneer u erop klikt in de sectie Frames .
Klik op de miniatuur op het tabblad Samenvatting om in te zoomen op de schermafbeelding.

Dit voorbeeld toont een ingezoomde schermafbeelding nadat u op de miniatuur ervan op het tabblad Samenvatting hebt geklikt.
Bekijk lageninformatie
Geavanceerde laaginformatie over een frame bekijken:
- Schakel geavanceerde verfinstrumentatie in .
- Selecteer een frame in de sectie Frames . DevTools geeft informatie weer over de lagen op het tabblad Nieuwe lagen , naast het tabblad Evenementlogboek .

Beweeg over een laag om het in het diagram te markeren.

Dit voorbeeld toont de laag #39 gemarkeerd terwijl u erover zweeft.
Om het diagram te verplaatsen:
- Klik op PAN -modus
 om langs de X- en Y -assen te bewegen.
 - Klik op Rotate modus
 om te roteren langs de z -as.
 - Klik op Reset Transform
 om het diagram opnieuw in te stellen naar zijn oorspronkelijke positie.
Zie laaganalyse in actie:
Bekijk Paint Profiler
Om geavanceerde informatie over een verfevenement te bekijken:
- Geavanceerde verfinstrumentatie inschakelen .
- Selecteer een verfevenement in het hoofdspoor .

Analyseer de renderingprestaties met het tabblad Rendering
Gebruik de functies van het Tab van de weergave om de weergaveprestaties van uw pagina te visualiseren.
Bekijk frames per seconde in realtime met de FPS -meter
De frame-renderingstatistieken is een overlay die in de rechterbovenhoek van uw viewport verschijnt. Het biedt een realtime schatting van FPS terwijl de pagina wordt uitgevoerd.
Zie frame rendering statistieken .
Bekijk schilderevenementen in realtime met verfflitsen
Gebruik verfflitsen om een realtime weergave te krijgen van alle verfgebeurtenissen op de pagina.
Zie verf knipperen .
Bekijk een overlay van lagen met laaggrenzen
Gebruik laagranden om een overlay van laaggrenzen en tegels bovenop de pagina te bekijken.
Zie Laaggrenzen .
Vind in realtime scrollprestatieproblemen
Gebruik scrollingprestatieproblemen om elementen van de pagina te identificeren die luisteraars van gebeurtenis hebben met betrekking tot scrollen die de prestaties van de pagina kunnen schaden. DevTools schetst de potentieel-problemen in groenblauw.
Zie Scrolling -prestatieproblemen .
,
Deze pagina is een uitgebreide referentie van Chrome Devtools -functies met betrekking tot het analyseren van prestaties.
Zie runtime -prestaties analyseren voor een begeleide zelfstudie over het analyseren van de prestaties van een pagina met Chrome Devtools.
Record Performance
U kunt runtime of laadprestaties opnemen.
Runtime -prestaties opnemen
Noteer runtime -prestaties wanneer u de prestaties van een pagina wilt analyseren terwijl deze actief is, in tegenstelling tot laden.
- Ga naar de pagina die u wilt analyseren.
- Klik op het tabblad Performance in Devtools.
Klik op Record
. Interactie met de pagina. DevTools registreert alle pagina -activiteiten die optreedt als gevolg van uw interacties.
Klik op opnieuw op te nemen of klik op STOP om te stoppen met opnemen.
Record load -prestaties
Record laadprestaties wanneer u de prestaties van een pagina wilt analyseren tijdens het laden, in tegenstelling tot hardlopen.
- Ga naar de pagina die u wilt analyseren.
- Open het uitvoeringspaneel van Devtools.
Klik op Pagina Start Profile and Load
. DevTools navigeert eerst naar about:blankom resterende screenshots en sporen te wissen. Vervolgens registreert Devtools Performance Metrics terwijl de pagina opnieuw wordt geladen en vervolgens de opname een paar seconden na de lading automatisch stopt.
DevTools zoomt automatisch in op het deel van de opname waar de meeste activiteiten plaatsvonden.
In dit voorbeeld toont het prestatiepaneel de activiteit tijdens een pagina -laden.
Maak screenshots vast tijdens het opnemen
Schakel het selectievakje schermen in om een screenshot van elk frame vast te leggen tijdens het opnemen.
Zie een screenshot bekijken om te leren om te gaan met screenshots.
Force Garbage Collection tijdens het opnemen
Terwijl u een pagina opneemt, klikt u op Garbage om afvalcollectie te forceren.
Toon opname -instellingen
Klik op Instellingen vastleggen ![]() Om meer instellingen bloot te stellen met betrekking tot hoe Devtools prestatie -opnames vastlegt.
Om meer instellingen bloot te stellen met betrekking tot hoe Devtools prestatie -opnames vastlegt.
Schakel JavaScript -monsters uit
Standaard toont de hoofdbaan van een opname gedetailleerde call -stacks van JavaScript -functies die tijdens de opname werden aangeroepen. Om deze call -stacks uit te schakelen:
- Open de instellingen van de opname menu. Zie instellingen voor het opnemen van shows .
- Schakel het selectievakje JavaScript Samples in.
- Neem een opname van de pagina.
De volgende screenshots tonen het verschil tussen het uitschakelen en inschakelen van JavaScript -monsters. De hoofdbaan van de opname is veel korter wanneer bemonstering is uitgeschakeld, omdat het alle JavaScript -call -stacks weglaat.
Dit voorbeeld toont een opname met uitgeschakelde JS -monsters.
Dit voorbeeld toont een opname met ingeschakelde JS -monsters.
Het netwerk te smoren tijdens het opnemen
Om het netwerk te smoren tijdens het opnemen:
- Open de instellingen van de opname menu. Zie instellingen voor het opnemen van shows .
- Stel het netwerk in op het gekozen niveau van throttling.
In het vervolgkeuzemenu kan het prestatiepaneel ook een standaard throttling-preset of een preset aanbevelen die de ervaring van uw gebruikers benadert op basis van veldgegevens .
Gaskleed de CPU tijdens het opnemen
Om de CPU te smoren tijdens het opnemen:
- Open de instellingen van de opname menu. Zie instellingen voor het opnemen van shows .
- Stel CPU in op het gekozen niveau van throttling.
Throttling is relatief ten opzichte van de mogelijkheden van uw computer. Door de 2X -vertragingsoptie zorgt bijvoorbeeld dat uw CPU 2 keer langzamer werkt dan de gebruikelijke mogelijkheid. DevTools kan de CPU's van mobiele apparaten niet echt simuleren, omdat de architectuur van mobiele apparaten heel anders is dan die van desktops en laptops.
In het vervolgkeuzemenu kan het prestatiepaneel ook een standaard throttling-preset of een preset aanbevelen die de ervaring van uw gebruikers benadert op basis van veldgegevens .
Schakel CSS -selectorstatistieken in
Om de statistieken van uw CSS-regel-selectors te bekijken tijdens langlopende herberekeningsstijlgebeurtenissen :
- Open de instellingen van de opname menu. Zie instellingen voor het opnemen van shows .
- Controleer het selectievakje CSS Selector Statistieken inschakelen.
Zie voor meer informatie hoe u CSS -selectorprestaties kunt analyseren tijdens evenementen in de herberekening .
Schakel geavanceerde verfinstrumentatie in
Om gedetailleerde verfinstrumentatie te bekijken:
- Open de instellingen van de opname menu. Zie instellingen voor het opnemen van shows .
- Controleer het selectievakje Enable Advanced Paint Instrumentation .
Zie Layers en bekijk Profiler om te leren om te leren om te gaan met de verfinformatie.
Annoteer een opname en deel deze
Zodra een prestatietrace is opgenomen , kunt u deze analyseren en annoteren om uw bevindingen te delen.
Om een opname te annoteren, opent u het tabblad Annotaties in de zijbalk links van het prestatiepaneel . Er zijn verschillende manieren om een annotatie toe te voegen:
- Labelitem : om een label aan een item toe te voegen, dubbelklik op het en typ een label.
- Sluit twee items aan : om twee items aan te sluiten met een pijl, dubbelklik op het eerste item, klik op een pijl ernaast en klik vervolgens op het tweede item.
- Label een tijdbereik : om een willekeurig tijdbereik te labelen, schakel de drag van het begin van een tijdbereik tot het einde en typ vervolgens een label.
In dit voorbeeld zijn er in de netwerktrack twee geannoteerde verzoeken, een verbinding tussen hen en een geannoteerd tijdbereik dat in roze wordt gemarkeerd. Het tabblad Annotaties toont het aantal annotaties naast zijn tabnaam, in dit voorbeeld, 4.
Om een annotatie te verwijderen, zweeft u eroverheen op het tabblad Annotaties en klikt u op de knop verwijderen ernaast.
Om annotaties te verbergen voor het prestatietrace, check Annotations verbergen onderaan het tabblad Annotaties .
Bewaar en deel een opname
Om een opname op te slaan en later te delen met uw geannoteerde prestatiebevindingen, klikt u in de actiebalk bovenaan het uitvoeringspaneel downloaden en selecteer Save Trace .
Als alternatief, selecteer Save Trace zonder annotaties .
Laad een opname
Om een opname te laden, klikt u op Upload in de actiebalk bovenaan het prestatiepaneel .
Het uitvoeringspaneel zal annotaties weergeven als ze aanwezig zijn in het spoor.
Wis de vorige opname
Na het maken van een opname, drukt u op Duidelijke opname ![]() Om die opname van het prestatiepaneel te wissen.
Om die opname van het prestatiepaneel te wissen.
Analyseer een prestatie -opname
Nadat u runtime -prestaties of opnameprestaties hebt opgenomen, biedt het prestatiepaneel veel gegevens voor het analyseren van de prestaties van wat er net is gebeurd.
Krijg bruikbare inzichten
Het prestatiepaneel consolideert prestatie -inzichten van het Lighthouse Report en het nu verouderde Performance Insights -paneel. Deze inzichten kunnen manieren suggereren om de prestaties te verbeteren en begeleide analyse te geven van de volgende prestatieproblemen, inclusief maar niet beperkt tot:
- LCP en Inp door subdeel
- LCP -aanvraagontdekking
- Lay -out shift daders
- Blokkerende verzoeken weergeven
- Derden
- Afbeelding
- Documentverzoek latentie
- Viewport -optimalisatie voor mobiel
- CSS -selectorkosten
Om inzichten te gebruiken:
- Maak een prestatie -opname .
- Open in de linker zijbalk van het prestatiepaneel het tabblad Insights , breid verschillende secties uit en zweeft over en klik op items. Het prestatiepaneel zal de bijbehorende gebeurtenissen in het spoor markeren.
Navigeer door de opname
Om u te helpen navigeren, terwijl u op Performance Trace zweeft, doet het prestatiepaneel het volgende:
- Toont een verticale marker die het hele prestatiespoor overspant wanneer u over het tijdlijnoverzicht zweeft.
- Benadrukt een bereik in het tijdlijnoverzicht wanneer u over items in de hoofdbaan zweeft.
Om uw prestatie -opname nauwkeurig te inspecteren, kunt u een deel van een opname selecteren, een lange vlamgrafiek scrollen, in- en uitzoomen en broodkruimels gebruiken om tussen zoomniveaus te springen.
Gebruik sneltoetsen om te navigeren
Om sneltoetsen te gebruiken om snel door de opname te navigeren, kies eerst de stijl van toetsenbordnavigatie.
Klik in de rechterbovenhoek van het paneel op -snelkoppelingen en selecteer een van de volgende zaken:
- Klassiek : Zoom met muiswiel (touchpad omhoog of omlaag) en verticale scroll met shift + muiswiel.
- Modern : verticale scroll met muiswiel, horizontale scroll met schakel + muiswiel en zoom met commando/bediening + muiswiel.
Het dialoogvenster Shortcuts biedt u ook een cheatsheet van de beschikbare snelkoppelingen.
Selecteer een deel van de opname
Onder de actiebalk van het uitvoeringspaneel en bovenaan de opname kunt u het gedeelte Tijdlijnoverzicht zien met de CPU- en NET -kaarten.
Om een deel van een opname te selecteren, klikt u en houdt u vast en sleep u links of rechts over het tijdlijnoverzicht .
Om een deel te selecteren met het toetsenbord:
- Focus het hoofdspoor of een van zijn buren.
- Gebruik de W , A , S , D -sleutels om in te zoomen, links naar links te gaan en respectievelijk naar rechts te bewegen.
Om een deel te selecteren met behulp van een trackpad:
- Beweeg over het tijdlijnoverzichtsgedeelte of een van de tracks ( hoofd en zijn buren).
- Gebruik twee vingers, veeg omhoog om uit te zoomen, veeg naar links om naar links te bewegen, veeg naar beneden om in te zoomen en veeg naar rechts om naar rechts te bewegen.
Maak broodkruimels en spring tussen zoomniveaus
Met het tijdlijnoverzicht kunt u meerdere geneste broodkruimels achtereenvolgens maken, de zoomniveaus verhogen en vervolgens vrij springen tussen zoomniveaus.
Om broodkruimels te maken en te gebruiken:
- Selecteer in het tijdlijnoverzicht een deel van de opname.
- Beweeg over de selectie en klik op de knop N MS . De selectie breidt uit om het tijdlijnoverzicht in te vullen. Een keten van broodkruimels begint te bouwen bovenop het tijdlijnoverzicht .
- Herhaal de vorige twee stappen om nog een geneste broodkruimel te maken. U kunt broodkruimels blijven nestelen zolang het selectiebereik groter is dan 5 milliseconden.
- Om naar een gekozen zoomniveau te springen, klikt u op de bijbehorende broodkruimel in de ketting bovenop het tijdlijnoverzicht .
Om de kinderen van een broodkruimel te verwijderen, klikt u met de rechtermuisknop op de bovenbroodkruimel en selecteert u kinderbroodkruimels verwijderen .
Scroll een lange vlamgrafiek
Om een lange vlamgrafiek in het hoofdspoor of een van zijn buren te scrollen, klik en houd vast en sleep dan in elke richting totdat wat u zoekt in beeld komt.
Negeer irrelevante scripts in de vlamgrafiek
Om je beter op je code te concentreren, kun je irrelevante scripts toevoegen om de lijst te negeren.
Om scripts te negeren, doe een van de volgende zaken:
- Klik op Toon Lijstinstellingen Dialoogvenster Negeren Negeren in de bovenste actiebalk en typ een reguliere expressie in het invoerveld. De vlamgrafiek past de nieuwe regel toe terwijl u typt.
- Klik met de rechtermuisknop op een script en selecteer Script toevoegen om de lijst te negeren . Het prestatiepaneel voegt dit script toe aan de lijst in het dialoogvenster tonen negeren Lijstinstellingen .
Het paneel zal automatisch overdreven nestelen voor dergelijke scripts instorten en ze markeren als On ignore list ( REGULAR_EXPRESSION ) .
In het dialoogvenster tonen negeren Lijstinstellingen , kunt u de regels voor negerenlijst in- en uitgeschakeld inschakelen.
Als u een script uit de lijst kunt verwijderen, klikt u met de rechtermuisknop in de vlamgrafiek en selecteert u het script verwijderen uit de lijst van de negeren of zweven erover in het dialoogvenster tonen negeren Lijstinstellingen en klik op Verwijderen .
DevTools slaat de regels voor negeren op die u toevoegt in -instellingen > Negeerlijst negeren .
Bovendien, om u alleen op first-party scripts te concentreren, controleert u Dim 3e partijen . Het prestatiepaneel grijst scripts van derden uit.
Zoekactiviteiten
U kunt over de activiteiten in de hoofdbaan en verzoeken in de netwerktrack zoeken.
Druk op: om een zoekvak onderaan het uitvoeringspaneel te openen, druk op:
- MacOS: Command + F
- Windows, Linux: Control + F
Dit voorbeeld toont een reguliere expressie in het zoekvak onderaan die elke activiteit vindt die begint met E .
Om door activiteiten te fietsen die overeenkomen met uw vraag:
- Klik op Vorige of volgende knoppen.
- Druk op Shift + Enter om de vorige te selecteren of Voer in om de volgende te selecteren.
Het prestatiepaneel toont een tooltip over de activiteit die in het zoekvak is geselecteerd.
Om query -instellingen te wijzigen:
- Klik op Match Case om de query case gevoelig te maken.
- Klik op Regular Expression om een reguliere expressie in uw query te gebruiken.
Klik op Annuleren om het zoekvak te verbergen.
Verander de volgorde van tracks en verberg ze
Om het prestatietrace op te banen, kunt u de volgorde van tracks wijzigen en de irrelevante verbergen in de configuratiemodus van de track.
Om tracks te verplaatsen en te verbergen:
- Om de configuratiemodus in te voeren, klikt u met de rechtermuisknop op een tracknaam en selecteert u tracks configureren .
- Klik op Up of om naar beneden om een track omhoog of omlaag te verplaatsen. Klik op om het te verbergen.
- Wanneer u klaar bent, klikt u op Voltooien UITDIENEN VOERTROUWEN VOOR DE BOVEN om de configuratiemodus te verlaten.
Bekijk de video om deze workflow in actie te zien.
Het prestatiepaneel slaat de trackconfiguratie op voor nieuwe sporen, maar niet in de volgende DevTools -sessies.
Bekijk hoofddraadactiviteit
Gebruik de hoofdbaan om de activiteit te bekijken die plaatsvond op de hoofdthread van de pagina.
Klik op een evenement om er meer informatie over te bekijken op het tabblad Samenvatting , inclusief maar niet beperkt tot: Timings, stapelsporen, links naar overeenkomstige scripts en eventuele namen van derden. Het prestatiepaneel schetst de geselecteerde gebeurtenis in blauw.
Dit voorbeeld toont meer informatie over de gebeurtenis get Function Call op het tabblad Samenvatting .
Lees de vlamgrafiek
Het prestatiepaneel vertegenwoordigt de hoofddraadactiviteit in een vlamgrafiek. De x-as vertegenwoordigt de opname in de loop van de tijd. De y-as vertegenwoordigt de oproepstapel. De gebeurtenissen bovenaan veroorzaken de onderstaande gebeurtenissen.
Dit voorbeeld toont een vlamdiagram in de hoofdbaan . Een click veroorzaakte een anonieme functieaanroep. Deze functie wordt op zijn beurt genoemd, onEndpointClick_ , die handleClick_ , enzovoort, noemde.
Het prestatiepaneel wijst willekeurige kleuren van scripts toe om de vlamgrafiek te verbreken en leesbaarder te maken. In het eerdere voorbeeld zijn functieaanroepen uit één script gekleurd lichtblauw. Oproepen uit een ander script zijn gekleurd lichtroze. Het donkerdere geel vertegenwoordigt scriptactiviteit en de paarse gebeurtenis vertegenwoordigt renderingactiviteit. Deze donkerdere gele en paarse gebeurtenissen zijn consistent in alle opnames.
Lange taken worden ook benadrukt met een rode driehoek, en met het deel van meer dan 50 milliseconden in de schaduw van rood:
In dit voorbeeld duurde de taak meer dan 400 milliseconden, dus het deel dat de laatste 350 milliseconden vertegenwoordigt, wordt rood in de schaduw, terwijl de eerste 50 milliseconden dat niet zijn.
Bovendien toont de hoofdbaan informatie over CPU -profielen gestart en gestopt met profile() en profileEnd() .
Zie JavaScript -voorbeelden uitschakelen om de gedetailleerde vlamgrafiek van JavaScript -oproepen te verbergen. Wanneer JS-monsters zijn uitgeschakeld, ziet u alleen de gebeurtenissen op hoog niveau zoals Event (click) en Function Call .
Track Event Initiators
De hoofdbaan kan pijlen tonen die de volgende initiatiefnemers verbinden en de gebeurtenissen die ze hebben veroorzaakt:
- Stijl of lay -out Invalidatie -> Recalculeer stijlen of lay -out
- Verzoek animatieframe -> Animatiekader Fired
- Vraag Idle Callback -> Fire Idle callback
- Installeer timer -> Timer Fired
- Websocket maken -> Verzenden ... en ontvang WebSocket -handdruk of vernietig WebSocket
- Schema Posttask -> Fire Posttask of afbreken Posttask
Om de pijlen te zien, zoek je een initiator of de gebeurtenis die het in de vlamgrafiek heeft veroorzaakt en selecteer deze.
Indien geselecteerd, toont het tabblad Samenvatting initiator voor links voor initiatiefnemers en geïnitieerd door links voor de gebeurtenissen die ze hebben veroorzaakt. Klik op hen om te springen tussen de bijbehorende gebeurtenissen.
Verberg functies en hun kinderen in de vlamgrafiek
Om de vlamgrafiek in de hoofdthread op te richten, kunt u geselecteerde functies of hun kinderen verbergen:
Klik in de hoofdbaan met de rechtermuisknop op een functie en kies een van de volgende opties of druk op de bijbehorende snelkoppeling:
- Functie verbergen (
H) - Verberg kinderen (
C) - Verbergt herhalende kinderen (
R) - Reset kinderen (
U) - Reset Trace (
T) - Script toevoegen om lijst te negeren (
I)
Een vervolgkeuzelijst verschijnt naast de functienaam met verborgen kinderen.
- Functie verbergen (
Om het aantal verborgen kinderen te zien, zweeft u over de vervolgkeuzelijst .
Om een functie te resetten met verborgen kinderen of de hele vlamgrafiek, selecteert u de functie en drukt u op
Uof klikt u met de rechtermuisknop en selecteert u respectievelijk RESET TRACE .
Negeer scripts in de vlamgrafiek
Als u een script aan de lijst Negeren toevoegt, klikt u met de rechtermuisknop op een script in de grafiek en selecteert u script toevoegen om de lijst te negeren .
De instortingen van de grafiek negeerden scripts, markeert ze als op de lijst met negeren en voegt ze toe aan de aangepaste uitsluitingsregels in instellingen> Negeer de lijst . Gegooid scripts worden opgeslagen totdat u ze uit het spoor of uit de aangepaste uitsluitingsregels verwijdert.
Bekijk activiteiten in een tafel
Na het opnemen van een pagina, hoeft u niet alleen op de hoofdbaan te vertrouwen om activiteiten te analyseren. DevTools biedt ook drie tabelweergaven voor het analyseren van activiteiten. Elke weergave geeft u een ander perspectief op de activiteiten:
- Wanneer u de root -activiteiten wilt bekijken die het meeste werk veroorzaken, gebruikt u het tabblad Tree .
- Wanneer u de activiteiten wilt bekijken waar de meeste tijd direct is besteed, gebruikt u het tabblad Bottom-up .
- Wanneer u de activiteiten wilt bekijken in de volgorde waarin ze tijdens de opname hebben plaatsgevonden, gebruikt u het tabblad Evenementlogboek .
Om u te helpen vinden waar u sneller naar op zoek bent, hebben alle drie de tabbladen knoppen voor geavanceerde filtering naast de filterbalk :
- match case .
- reguliere expressie .
- match hele woord .
Elke tabelweergave in het prestatiepaneel toont links voor activiteiten zoals functiesaanroepen. Om u te helpen debuggen, vindt Devtools de bijbehorende functie -verklaringen in bronbestanden. Bovendien, als de juiste brongaarten aanwezig en ingeschakeld zijn, vindt DevTools automatisch de originele bestanden.
Klik op een link om een bronbestand in het paneel Bronnen te openen.
Wortelactiviteiten
Hier is een uitleg van het rootactiviteitenconcept dat wordt vermeld in het tabblad Call Tree , het bottom-up tabblad en gebeurtenislogboeksecties .
Wortelactiviteiten zijn die welke de browser wat werk doen. Wanneer u bijvoorbeeld op een pagina klikt, vuurt de browser een Event af als de root -activiteit. Die Event kan er dan voor zorgen dat een handler uitvoert.
In de vlamgrafiek van het hoofdnummer staan rootactiviteiten bovenaan de grafiek. In de tabbladen van de oproepboom- en gebeurtenislogboek zijn rootactiviteiten de items op het hoogste niveau.
Zie het tabblad Call Tree voor een voorbeeld van wortelactiviteiten.
Het tabblad met oproepboom
Gebruik het tabblad Call Tree om te bekijken welke wortelactiviteiten het meeste werk veroorzaken.
Het tabblad Tree Tree geeft alleen activiteiten weer tijdens het geselecteerde gedeelte van de opname. Zie een deel van een opname selecteren om te leren hoe u delen kunt selecteren.
In dit voorbeeld zijn het topniveau van items in de activiteitskolom , zoals Event , Paint en Composite Layers wortelactiviteiten. Het nesten vertegenwoordigt de call -stack. In dit voorbeeld veroorzaakte de Event de Function Call , die button.addEventListener veroorzaakte, die b veroorzaakte, enzovoort.
Zelftijd vertegenwoordigt de tijd die rechtstreeks in die activiteit wordt besteed. Totale tijd vertegenwoordigt de tijd die wordt besteed aan die activiteit of een van zijn kinderen.
Klik op Zelftijd , totale tijd of activiteit om de tabel op die kolom te sorteren.
Gebruik het filtervak om gebeurtenissen op activiteitennaam te filteren.
Standaard is het groepsmenu ingesteld op NO -groepering . Gebruik het groepsmenu om de activiteitstabel te sorteren op basis van verschillende criteria.
Klik op de zwaarste stapel tonen ![]() om een andere tabel rechts van de activiteitstabel te onthullen. Klik op een activiteit om de zwaarste stapeltabel te vullen. De zwaarste stapeltabel laat je zien welke kinderen van de geselecteerde activiteit de langste tijd duurden om uit te voeren.
om een andere tabel rechts van de activiteitstabel te onthullen. Klik op een activiteit om de zwaarste stapeltabel te vullen. De zwaarste stapeltabel laat je zien welke kinderen van de geselecteerde activiteit de langste tijd duurden om uit te voeren.
Het bottom-up tabblad
Gebruik het bottom-up tabblad om te bekijken welke activiteiten de meeste tijd rechtstreeks in totaal hebben in beslag genomen.
Het bottom-up tabblad geeft alleen activiteiten weer tijdens het geselecteerde gedeelte van de opname. Zie een deel van een opname selecteren om te leren hoe u delen kunt selecteren.
In de hoofdbaanvlamgrafiek van dit voorbeeld kunt u zien dat bijna alle tijd werd besteed aan het uitvoeren van de drie oproepen om te wait() . Dienovereenkomstig is de bovenste activiteit op het tabblad Bottom-Up wait . In de vlamgrafiek zijn het geel onder de oproepen om te wait eigenlijk duizenden Minor GC -oproepen. Dienovereenkomstig kunt u zien dat de volgende duurste activiteit op het tabblad Bottom-Up Minor GC is.
De zelftijdkolom vertegenwoordigt de geaggregeerde tijd die rechtstreeks in die activiteit wordt doorgebracht, over al zijn gebeurtenissen.
De totale tijdkolom vertegenwoordigt geaggregeerde tijd die wordt besteed aan die activiteit of een van zijn kinderen.
Het tabblad Evenementlogboek
Gebruik het tabblad Gebeurtenislogboek om activiteiten te bekijken in de volgorde waarin ze plaatsvonden tijdens de opname.
Het tabblad Evenementlogboek geeft alleen activiteiten weer tijdens het geselecteerde deel van de opname. Zie een deel van een opname selecteren om te leren hoe u delen kunt selecteren.
De starttijdkolom vertegenwoordigt het punt waarop die activiteit begon, ten opzichte van het begin van de opname. De starttijd van 1573.0 ms voor het geselecteerde item in dit voorbeeld betekent dat de activiteit 1573 ms startte nadat de opname was gestart.
De kolom Zelftijd vertegenwoordigt de tijd die rechtstreeks in die activiteit wordt doorgebracht.
De totale tijdkolommen vertegenwoordigen de tijd die rechtstreeks in die activiteit of in een van zijn kinderen wordt doorgebracht.
Klik op Starttijd , zelftijd of totale tijd om de tabel op die kolom te sorteren.
Gebruik het filtervak om activiteiten op naam te filteren.
Gebruik het duurmenu om alle activiteiten uit te filteren die minder dan 1 ms of 15 ms duurden. Standaard is het menu Duur ingesteld op ALL , wat betekent dat alle activiteiten worden getoond.
Schakel het laden , scripten , renderen of schilderen uit om alle activiteiten uit die categorieën te filteren.
Bekijk prestatiemarkeringen
In een overlay met verticale lijnen over het prestatiespoor kunt u belangrijke prestatiemarkeringen zien, zoals:
- Eerste verf (FP)
- Eerste contentful verf (FCP)
- Grootste inhoudelijke verf (LCP)
- DomContentLoaded Event (DCL)
- Onload -evenement (L)
Beweeg over de markernamen onderaan het spoor om hun tijdstempel te zien.
Bekijk aangepaste timings
Bekijk op het spoor van de timing uw aangepaste prestatiemarkeringen zoals:
-
performance.mark()oproepen. Een individuele markering met tooltip wordt hieronder weergegeven op 813,44 ms, gelabeld met het uitvoeren van JavaScript . -
performance.measure()oproepen. Een gele spanwijdte wordt hieronder weergegeven, gelabelde langzame interactie .
Selecteer een marker voor meer informatie op het tabblad Samenvatting , inclusief de tijdstempel, totale tijd, zelftijd en het detail . Voor performance.mark() en performance.measure() oproepen toont het tabblad ook stapelsporen.
Bekijk interacties
Bekijk gebruikersinteracties op de interacties -track om potentiële responsiviteitsproblemen op te sporen.
Om interacties te bekijken:
- Open Devtools bijvoorbeeld op deze demo -pagina .
- Open het prestatiepaneel en start een opname .
- Klik op een element (koffie) en stop de opname.
- Vind de interacties -track in de tijdlijn.
In dit voorbeeld toont de interacties -track de pointer -interactie. Interacties hebben snorharen die aangeven dat input en presentatievertragingen bij verwerkingstijdgrenzen. Beweeg over de interactie om een tooltip te zien met invoervertraging, verwerkingstijd en presentatievertraging.
De interacties -track toont ook interactie met de volgende verf (INP) waarschuwingen voor interacties langer dan 200 milliseconden op het tabblad Samenvatting en in een tooltip op Hover:
De interacties -track markeert de interacties van meer dan 200 milliseconden met een rode driehoek in de rechterbovenhoek.
Bekijk lay -outverschuivingen
Bekijk lay -outverschuivingen op de lay -outverschuivingen Track. Shifts worden weergegeven als paarse diamanten en zijn gegroepeerd in clusters (paarse lijnen) op basis van hun nabijheid op de tijdlijn.
Om een element te markeren dat een lay -outverschuiving in het viewport veroorzaakte, zweeft u over de overeenkomstige diamant.
Voor meer informatie over een lay -outverschuiving of verschuivingen op het tabblad Samenvatting met timings, scores, elementen en potentiële daders, klikt u op de bijbehorende diamant of cluster.
Zie Cumulative Layout Shift (CLS) voor meer informatie.
Bekijk animaties
Bekijk animaties op het nummer van de animaties . Animaties worden genoemd als overeenkomstige CSS-eigenschappen of elementen, bijvoorbeeld, transform of my-element . Niet-compositieve animaties zijn gemarkeerd met rode driehoeken in de rechterbovenhoek.
Selecteer een animatie voor meer informatie op het tabblad Samenvatting , inclusief redenen voor het samenstellen van storingen.
Bekijk GPU -activiteit
Bekijk GPU -activiteit in de GPU -sectie.
Bekijk rasteractiviteit
Bekijk rasteractiviteit in de sectie Draadpool .
Analyseer frames per seconde (FPS)
DevTools biedt talloze manieren om frames per seconde te analyseren:
- Gebruik de sectie Frames om te bekijken hoe lang een bepaald frame duurde.
- Gebruik de FPS -meter voor een realtime schatting van FPS terwijl de pagina wordt uitgevoerd. Zie Bekijk frames per seconde in realtime met de FPS -meter .
Het sectie Frames
Het framesgedeelte vertelt je precies hoe lang een bepaald frame duurde.
Beweeg over een frame om een tooltip te bekijken met meer informatie erover.
Dit voorbeeld toont een tooltip wanneer u over een frame zweeft.
De sectie Frames kan vier soorten frames weergeven:
- Idle frame (wit) . Geen wijzigingen.
- Frame (groen) . Weergegeven zoals verwacht en op tijd.
- Gedeeltelijk gepresenteerd frame (geel met een schaars breed dashboard-lijnpatroon) . Chrome heeft zijn best gedaan om op tijd op zijn minst enkele visuele updates weer te geven. Bijvoorbeeld in het geval dat het werk van de hoofdthread van het renderer -proces (canvasanimatie) te laat is, maar de compositor -thread (scrollen) is op tijd.
- Gevallen frame (rood met een dicht vaste lijnpatroon) . Chrome kan het frame niet in redelijke tijd weergeven.
Dit voorbeeld toont een tooltip wanneer u over een gedeeltelijk gepresenteerd frame zweeft.
Klik op een frame om nog meer informatie over het frame op het tabblad Samenvatting te bekijken. DevTools schetst het geselecteerde frame in blauw.
Netwerkverzoeken bekijken
Breid de netwerksectie uit om een waterval van netwerkverzoeken te bekijken die plaatsvonden tijdens de prestatie -opname.
Naast de naam van het netwerkspoor is er een legende met kleurgecodeerde aanvraagtypen.
Render -blokkerende aanvragen worden gemarkeerd met een rode driehoek in de rechterbovenhoek.
Beweeg over een verzoek om een tooltip te zien met:
- De URL van het verzoek en de totale tijd die nodig was om deze uit te voeren.
- Prioriteit of een prioriteitsverandering, bijvoorbeeld,
Medium -> High. - Of het verzoek
Render blockingof niet. - Een uitsplitsing van aanvraagtimings, later beschreven.
Wanneer u op een verzoek klikt, trekt het netwerktrack een pijl van zijn initiator naar het verzoek.
Bovendien toont het prestatiepaneel u het tabblad Samenvatting met meer informatie over het verzoek, inclusief maar niet beperkt tot initiële prioriteit en (definitieve) prioriteitsvelden . Als hun waarden verschillen, is de ophaalprioriteit van het verzoek tijdens de opname gewijzigd. Zie Resource Loading Optimaliseren met de Fetch Priority API voor meer informatie optimaliseren.
Het tabblad Samenvatting toont ook een uitsplitsing van de timings van het verzoek.
Het verzoek voor www.google.com wordt vertegenwoordigd door een lijn links ( |– ), een balk in het midden met een donkere portie en een licht gedeelte en een lijn rechts ( –| ).
U kunt een andere uitsplitsing van de timings vinden op het tabblad Netwerk . Klik met de rechtermuisknop op het verzoek in de netwerktrack of de URL op het tabblad Samenvatting en klik op ONVERKOPEN in het netwerkpaneel . DevTools neemt u mee naar het netwerkpaneel en selecteert het bijbehorende verzoek. Open het tabblad Timing .
Dit is hoe deze twee uitsplitsingen elkaar in kaart brengen:
- De linker lijn (
|–) is alles van deConnection startGroup of Events, inclusief. Met andere woorden, het is alles voordatRequest Sent. - Het lichtgedeelte van de balk is
Request sentenWaiting for server response. - Het donkere gedeelte van de balk is
Content download. - De juiste lijn (
–|) is de tijd die wordt besteed aan het wachten op de hoofdthread. Het tabblad Netwerk > Timing laat het niet zien.
Bekijk geheugenstatistieken
Schakel het selectievakje Memory in om geheugenstatistieken te bekijken vanuit de laatste opname.
DevTools geeft een nieuwe geheugengrafiek weer, boven het tabblad Samenvatting . Er is ook een nieuwe grafiek onder de netgrafiek , genaamd Heap . De Heap -grafiek biedt dezelfde informatie als de JS Heap -lijn in de geheugengrafiek .
Dit voorbeeld toont geheugenstatistieken boven het tabblad Samenvatting .
De gekleurde lijnen op de kaartkaart naar de gekleurde selectievakjes boven de grafiek. Schakel een selectievakje uit om die categorie voor de grafiek te verbergen.
De grafiek toont alleen de regio van de geselecteerde opname. In the earlier example, the Memory chart shows only the memory usage for the start of the recording, up to around the 1000ms mark.
View the duration of a portion of a recording
When analyzing a section like Network or Main , sometimes you need a more precise estimate of how long certain events took. Hold Shift, click and hold, and drag left or right to select a portion of the recording. At the bottom of your selection, DevTools shows how long that portion took.
In this example, the 488.53ms timestamp at the bottom of the selected portion indicates how long that portion took.
View a screenshot
See Capture screenshots while recording to learn how to enable screenshots.
Hover over the Timeline overview to view a screenshot of how the page looked during that moment of the recording. The Timeline overview is the section that contains the CPU , FPS , and NET charts.
You can also view screenshots by clicking a frame in the Frames section. DevTools displays a small version of the screenshot in the Summary tab.
This example shows the screenshot for the 195.5ms frame in the Summary tab when you click it in the Frames section.
Click the thumbnail in the Summary tab to zoom in on the screenshot.
This example shows a zoomed-in screenshot after you click its thumbnail in the Summary tab.
View layers information
To view advanced layers information about a frame:
- Enable advanced paint instrumentation .
- Select a frame in the Frames section. DevTools displays information about its layers in the new Layers tab, next to the Event Log tab.
Hover over a layer to highlight it in the diagram.
This example shows the layer #39 highlighted as you hover over it.
To move the diagram:
- Click Pan Mode to move along the X and Y axes.
- Click Rotate Mode to rotate along the Z axis.
- Click Reset Transform to reset the diagram to its original position.
See layer analysis in action:
View paint profiler
To view advanced information about a paint event:
- Enable advanced paint instrumentation .
- Select a Paint event in the Main track.
Analyze rendering performance with the Rendering tab
Use the Rendering tab's features to help visualize your page's rendering performance.
View frames per second in real time with the FPS meter
The Frame rendering stats is an overlay that appears in the top-right corner of your viewport. It provides a real time estimate of FPS as the page runs.
See Frame rendering stats .
View painting events in real time with Paint Flashing
Use Paint Flashing to get a real time view of all paint events on the page.
See Paint flashing .
View an overlay of layers with Layer Borders
Use Layer Borders to view an overlay of layer borders and tiles on top of the page.
See Layer borders .
Find scroll performance issues in real time
Use Scrolling Performance Issues to identify elements of the page that have event listeners related to scrolling that may harm the performance of the page. DevTools outlines the potentially-problematic elements in teal.
See Scrolling performance issues .
,
This page is a comprehensive reference of Chrome DevTools features related to analyzing performance.
See Analyze runtime performance for a guided tutorial on how to analyze a page's performance using Chrome DevTools.
Record performance
You can record runtime or load performance.
Record runtime performance
Record runtime performance when you want to analyze the performance of a page as it's running, as opposed to loading.
- Go to the page that you want to analyze.
- Click the Performance tab in DevTools.
Click Record
. Interact with the page. DevTools records all page activity that occurs as a result of your interactions.
Click Record again or click Stop to stop recording.
Record load performance
Record load performance when you want to analyze the performance of a page as it's loading, as opposed to running.
- Go to the page that you want to analyze.
- Open the Performance panel of DevTools.
Click Start profiling and reload page
. DevTools first navigates to about:blankto clear any remaining screenshots and traces. Then DevTools records performance metrics while the page reloads and then automatically stops the recording a couple seconds after the load finishes.
DevTools automatically zooms in on the portion of the recording where most of the activity occurred.
In this example, the Performance panel shows the activity during a page load.
Capture screenshots while recording
Enable the Screenshots checkbox to capture a screenshot of every frame while recording.
See View a screenshot to learn how to interact with screenshots.
Force garbage collection while recording
While you are recording a page, click Collect garbage to force garbage collection.
Show recording settings
Click Capture settings ![]() to expose more settings related to how DevTools captures performance recordings.
to expose more settings related to how DevTools captures performance recordings.
Disable JavaScript samples
By default, the Main track of a recording displays detailed call stacks of JavaScript functions that were called during the recording. To disable these call stacks:
- Open the Capture settings menu. See Show recording settings .
- Enable the Disable JavaScript Samples checkbox.
- Take a recording of the page.
The following screenshots show the difference between disabling and enabling JavaScript samples. The Main track of the recording is much shorter when sampling is disabled, because it omits all of the JavaScript call stacks.
This example shows a recording with disabled JS samples.
This example shows a recording with enabled JS samples.
Throttle the network while recording
To throttle the network while recording:
- Open the Capture settings menu. See Show recording settings .
- Set Network to the chosen level of throttling.
In the drop-down menu, the Performance panel may also recommend a default throttling preset or a preset that approximates the experience of your users based on field data .
Throttle the CPU while recording
To throttle the CPU while recording:
- Open the Capture settings menu. See Show recording settings .
- Set CPU to the chosen level of throttling.
Throttling is relative to your computer's capabilities. For example, the 2x slowdown option makes your CPU operate 2 times slower than its usual ability. DevTools can't truly simulate the CPUs of mobile devices, because the architecture of mobile devices is very different from that of desktops and laptops.
In the drop-down menu, the Performance panel may also recommend a default throttling preset or a preset that approximates the experience of your users based on field data .
Enable CSS selector stats
To view the statistics of your CSS rule selectors during long-running Recalculate Style events:
- Open the Capture settings menu. See Show recording settings .
- Check the Enable CSS selector stats checkbox.
For more details, see how to Analyze CSS selector performance during Recalculate Style events .
Enable advanced paint instrumentation
To view detailed paint instrumentation:
- Open the Capture settings menu. See Show recording settings .
- Check the Enable advanced paint instrumentation checkbox.
To learn how to interact with the paint information, see View layers and View paint profiler .
Annotate a recording and share it
Once a performance trace is recorded , you can analyze it, and annotate it to share your findings.
To annotate a recording, open the Annotations tab in the sidebar on the left of the Performance panel. There are several ways to add an annotation:
- Label item : To add a label to an item, double-click it and type a label.
- Connect two items : To connect two items with an arrow, double-click the first item, click an arrow next to it, then click the second item.
- Label a time range : To label an arbitrary time range, shift-drag from the start of a time range to its end, then type a label.
In this example, in the Network track, there are two annotated requests, a connection between them, and an annotated time range highlighted in pink. The Annotations tab shows the number of annotations next to its tab name, in this example, 4.
To delete an annotation, hover over it in the Annotations tab and click the Delete button next to it.
To hide annotations from the performance trace, check Hide annotations at the bottom of the Annotations tab.
Save and share a recording
To save a recording and later share it with your annotated performance findings, in the action bar at the top of the Performance panel, click Download and select Save trace .
Alternatively, select Save trace without annotations .
Load a recording
To load a recording, click Upload in the action bar at the top of the Performance panel.
The Performance panel will show annotations if they are present in the trace.
Clear the previous recording
After making a recording, press Clear recording ![]() to clear that recording from the Performance panel.
to clear that recording from the Performance panel.
Analyze a performance recording
After you record runtime performance or record load performance , the Performance panel provides a lot of data for analyzing the performance of what just happened.
Get actionable insights
The Performance panel consolidates performance insights from the Lighthouse report and the now deprecated Performance insights panel. These insights can suggest ways to improve performance and provide guided analysis on the following performance issues, including but not limited to:
- LCP and INP by subpart
- LCP request discovery
- Layout shift culprits
- Render blocking requests
- Third parties
- Image delivery
- Document request latency
- Viewport optimization for mobile
- CSS selector costs
To make use of insights:
- Make a performance recording .
- In the left sidebar of the Performance panel, open the Insights tab, expand different sections, and hover over and click items. The Performance panel will highlight the corresponding events in the trace.
Navigate the recording
To help you navigate, as you hover over performance trace, the Performance panel does the following:
- Shows you a vertical marker that spans the entire performance trace when you hover over the Timeline overview .
- Highlights a range in the Timeline overview when you hover over items in the Main track.
To closely inspect your performance recording, you can select a portion of a recording, scroll a long flame chart, zoom in and out, and use breadcrumbs to jump between zoom levels.
Use keyboard shortcuts to navigate
To use keyboard shortcuts to quickly navigate the recording, first, choose your preferred style of keyboard navigation.
In the top-right corner of the panel, click Show shortcuts and select one of the following:
- Classic : Zoom with mouse wheel (touchpad up or down) and vertical scroll with Shift + mouse wheel.
- Modern : Vertical scroll with mouse wheel, horizontal scroll with Shift + mouse wheel, and zoom with Command/Control + mouse wheel.
The shortcuts dialog also provides you with a cheatsheet of the available shortcuts.
Select a portion of the recording
Under the action bar of the Performance panel and at the top of the recording, you can see the Timeline overview section with the CPU and NET charts.
To select a portion of a recording, click and hold, then drag left or right across the Timeline overview .
To select a portion using the keyboard:
- Focus the Main track or any of its neighbors.
- Use the W , A , S , D keys to zoom in, move left, zoom out, and move right, respectively.
To select a portion using a trackpad:
- Hover over the Timeline overview section or any of the tracks ( Main and its neighbors).
- Using two fingers, swipe up to zoom out, swipe left to move left, swipe down to zoom in, and swipe right to move right.
Create breadcrumbs and jump between zoom levels
The Timeline overview lets you create multiple nested breadcrumbs in succession, increasing zoom levels, and then jump freely between zoom levels.
To create and use breadcrumbs:
- In Timeline overview , select a portion of the recording .
- Hover over the selection and click the N ms button. The selection expands to fill the Timeline overview . A chain of breadcrumbs starts building at top of the Timeline overview .
- Repeat the previous two steps to create another nested breadcrumb. You can continue to nest breadcrumbs as long as the selection range is greater than 5 milliseconds.
- To jump to a chosen zoom level, click the corresponding breadcrumb in the chain at top of the Timeline overview .
To remove the childs of a breadcrumb, right-click the parent breadcrumb and select Remove child breadcrumbs .
Scroll a long flame chart
To scroll a long flame chart in the Main track or any of its neighbors, click and hold, then drag in any direction until what you are looking for comes into view.
Ignore irrelevant scripts in the flame chart
To better focus on your code, you can add irrelevant scripts to ignore list.
To ignore scripts, do one of the following:
- Click Show ignore list settings dialog in the top action bar and type a regular expression in the input field. The flame chart will apply the new rule as you type.
- Right-click a script and select Add script to ignore list . The Performance panel adds this script to the list in the Show ignore list settings dialog .
The panel will automatically collapse excessive nesting for such scripts and mark them as On ignore list ( REGULAR_EXPRESSION ) .
In the Show ignore list settings dialog , you can turn the ignore list rules on and off.
To remove a script from ignore list, right-click it in the flame chart and select Remove script from ignore list or hover over it in the Show ignore list settings dialog and click Remove .
DevTools saves the ignore list rules you add in Settings > Ignore list .
Additionally, to focus on first-party scripts only, check Dim 3rd parties . The Performance panel will gray out third-party scripts.
Search activities
You can search across the activities in the Main track and requests in the Network track.
To open a search box at the bottom of the Performance panel, press:
- macOS: Command + F
- Windows, Linux: Control + F
This example shows a regular expression in the search box at the bottom that finds any activity that begins with E .
To cycle through activities that match your query:
- Click Previous or Next buttons.
- Press Shift + Enter to select the previous or Enter to select the next.
The Performance panel shows a tooltip over the activity selected in the search box.
To modify query settings:
- Click Match case to make the query case sensitive.
- Click Regular expression to use a regular expression in your query.
To hide the search box, click Cancel .
Change the order of tracks and hide them
To declutter the performance trace, you can change the order of tracks and hide the irrelevant ones in track configuration mode.
To move and hide tracks:
- To enter the configuration mode, right-click a track name and select Configure tracks .
- Click up or down to move a track up or down. Click to hide it.
- When finished, click Finish configuring tracks at the bottom to exit the configuration mode.
Watch the video to see this workflow in action.
The Performance panel saves track configuration for new traces but not in next DevTools sessions.
View main thread activity
Use the Main track to view activity that occurred on the page's main thread.
Click an event to view more information about it in the Summary tab, including but not limited to: timings, stack traces, links to corresponding scripts, and third-party names, if any. The Performance panel outlines the selected event in blue.
This example shows more information about the get function call event in the Summary tab.
Read the flame chart
The Performance panel represents main thread activity in a flame chart. The x-axis represents the recording over time. The y-axis represents the call stack. The events on top cause the events below.
This example shows a flame chart in the Main track. A click event caused an anonymous function call. This function, in turn, called onEndpointClick_ , which called handleClick_ , and so on.
The Performance panel assigns scripts random colors to break up the flame chart and make it more readable. In the earlier example, function calls from one script are colored light blue. Calls from another script are colored light pink. The darker yellow represents scripting activity, and the purple event represents rendering activity. These darker yellow and purple events are consistent across all recordings.
Long tasks are also highlighted with a red triangle, and with the part over 50 milliseconds shaded in red:
In this example, the task took more than 400 milliseconds, so the part representing the last 350 milliseconds is shaded in red, while the initial 50 milliseconds is not.
Additionally, the Main track shows information on CPU profiles started and stopped with profile() and profileEnd() console functions.
To hide the detailed flame chart of JavaScript calls, see Disable JavaScript samples . When JS samples are disabled, you see only the high-level events such as Event (click) and Function Call .
Track event initiators
The Main track can show arrows that connect the following initiators and the events they caused:
- Style or layout invalidation -> Recalculate styles or Layout
- Request Animation Frame -> Animation Frame Fired
- Request Idle Callback -> Fire Idle Callback
- Install Timer -> Timer Fired
- Create WebSocket -> Send... and Receive WebSocket Handshake or Destroy WebSocket
- Schedule postTask -> Fire postTask or Abort postTask
To see the arrows, find either an initiator or the event it caused in the flame chart and select it.
When selected, the Summary tab shows Initiator for links for initiators and Initiated by links for the events they caused. Click them to jump between the corresponding events.
Hide functions and their children in the flame chart
To declutter the flame chart in the Main thread, you can hide selected functions or their children:
In the Main track, right-click a function and choose one of the following options or press the corresponding shortcut:
- Hide function (
H) - Hide children (
C) - Hide repeating children (
R) - Reset children (
U) - Reset trace (
T) - Add script to ignore list (
I)
A drop-down button appears next to the function name with hidden children.
- Hide function (
To see the number of hidden children, hover over the drop-down button.
To reset a function with hidden children or the whole flame chart, select the function and press
Uor right-click any function and select Reset trace respectively.
Ignore scripts in the flame chart
To add a script to the ignore list, right-click a script in the chart and select Add script to ignore list .
The chart collapses ignored scripts, marks them as On ignore list , and adds them to the Custom exclusion rules in Settings > Ignore list . Ignored scripts are saved until you remove them either from the trace or from the Custom exclusion rules .
View activities in a table
After recording a page, you don't need to rely solely on the Main track to analyze activities. DevTools also provides three tabular views for analyzing activities. Each view gives you a different perspective on the activities:
- When you want to view the root activities that cause the most work, use the Call Tree tab .
- When you want to view the activities where the most time was directly spent, use the Bottom-Up tab .
- When you want to view the activities in the order in which they occurred during the recording, use the Event Log tab .
To help you find what you are looking for faster, all three tabs have buttons for advanced filtering next to the Filter bar:
- Match case .
- Regular expression .
- Match whole word .
Each tabular view in the Performance panel shows links for activities such as functions calls. To help you debug, DevTools finds the corresponding function declarations in source files. Additionally, if the appropriate source maps are present and enabled, DevTools automatically finds the original files.
Click a link to open a source file in the Sources panel.
Root activities
Here's an explanation of the root activities concept that's mentioned in the Call Tree tab, Bottom-Up tab, and Event Log sections.
Root activities are those which cause the browser to do some work. For example, when you click a page, the browser fires an Event activity as the root activity. That Event then might cause a handler to execute.
In the Main track's flame chart, root activities are at the top of the chart. In the Call Tree and Event Log tabs, root activities are the top-level items.
See The Call Tree tab for an example of root activities.
The Call Tree tab
Use the Call Tree tab to view which root activities cause the most work.
The Call Tree tab only displays activities during the selected portion of the recording. See Select a portion of a recording to learn how to select portions.
In this example, the top-level of items in the Activity column, such as Event , Paint , and Composite Layers are root activities. The nesting represents the call stack. In this example, the Event caused the Function Call , which caused button.addEventListener , which caused b , and so on.
Self Time represents the time directly spent in that activity. Total Time represents the time spent in that activity or any of its children.
Click Self Time , Total Time , or Activity to sort the table by that column.
Use the Filter box to filter events by activity name.
By default the Grouping menu is set to No Grouping . Use the Grouping menu to sort the activity table based on various criteria.
Click Show Heaviest Stack ![]() to reveal another table to the right of the Activity table. Click an activity to populate the Heaviest Stack table. The Heaviest Stack table shows you which children of the selected activity took the longest time to execute.
to reveal another table to the right of the Activity table. Click an activity to populate the Heaviest Stack table. The Heaviest Stack table shows you which children of the selected activity took the longest time to execute.
The Bottom-Up tab
Use the Bottom-Up tab to view which activities directly took up the most time in aggregate.
The Bottom-Up tab only displays activities during the selected portion of the recording. See Select a portion of a recording to learn how to select portions.
In the Main track flame chart of this example, you can see that almost all of the time was spent executing the three calls to wait() . Accordingly, the top activity in the Bottom-Up tab is wait . In the flame chart, the yellow below the calls to wait are actually thousands of Minor GC calls. Accordingly, you can see that in the Bottom-Up tab, the next most expensive activity is Minor GC .
The Self Time column represents the aggregated time spent directly in that activity, across all of its occurrences.
The Total Time column represents aggregated time spent in that activity or any of its children.
The Event Log tab
Use the Event Log tab to view activities in the order in which they occurred during the recording.
The Event Log tab only displays activities during the selected portion of the recording. See Select a portion of a recording to learn how to select portions.
The Start Time column represents the point at which that activity started, relative to the start of the recording. The start time of 1573.0 ms for the selected item in this example means that activity started 1573 ms after the recording started.
The Self Time column represents the time spent directly in that activity.
The Total Time columns represents time spent directly in that activity or in any of its children.
Click Start Time , Self Time , or Total Time to sort the table by that column.
Use the Filter box to filter activities by name.
Use the Duration menu to filter out any activities that took less than 1 ms or 15 ms. By default the Duration menu is set to All , meaning all activities are shown.
Disable the Loading , Scripting , Rendering , or Painting checkboxes to filter out all activities from those categories.
View performance markers
In an overlay with vertical lines across the performance trace, you can see important performance markers, such as:
- First Paint (FP)
- First Contentful Paint (FCP)
- Largest Contentful Paint (LCP)
- DOMContentLoaded Event (DCL)
- Onload Event (L)
Hover over the marker names at the bottom of the trace to see their timestamp.
View custom timings
On the Timings track, view your custom performance markers such as:
-
performance.mark()calls. An individual mark with tooltip is shown below at 813.44 ms, labelled Starting to run JavaScript . -
performance.measure()calls. A yellow span is shown below, labelled Slow Interaction .
Select a marker to see more details in the Summary tab, including its timestamp, total time, self time, and the detail object . For performance.mark() and performance.measure() calls, the tab also shows stack traces.
View interactions
View user interactions on the Interactions track to track down potential responsiveness issues.
To view interactions:
- Open DevTools , for example, on this demo page .
- Open the Performance panel and start a recording .
- Click an element (coffee) and stop the recording.
- Find the Interactions track in the timeline.
In this example, the Interactions track shows the Pointer interaction. Interactions have whiskers that indicate input and presentation delays at processing time boundaries. Hover over the interaction to see a tooltip with input delay, processing time, and presentation delay.
The Interactions track also shows Interaction to Next Paint (INP) warnings for interactions longer than 200 milliseconds in the Summary tab and in a tooltip on hover:
The Interactions track marks the interactions over 200 milliseconds with a red triangle in the top right corner.
View layout shifts
View layout shifts on the Layout shifts track. Shifts are shown as purple diamonds and are grouped in clusters (purple lines) based on their proximity on the timeline.
To highlight an element that caused a layout shift in the viewport, hover over the corresponding diamond.
To see more information about a layout shift or shifts in the Summary tab with timings, scores, elements, and potential culprits, click the corresponding diamond or cluster.
For more information, see Cumulative Layout Shift (CLS) .
View animations
View animations on the Animations track. Animations are named as corresponding CSS properties or elements if any, for example, transform or my-element . Non-compositing animations are marked with red triangles in the top right corner.
Select an animation to see more details in the Summary tab, including reasons for compositing failures.
View GPU activity
View GPU activity in the GPU section.
View raster activity
View raster activity in the Thread Pool section.
Analyze frames per second (FPS)
DevTools provides numerous ways to analyze frames per second:
- Use the Frames section to view how long a particular frame took.
- Use the FPS meter for a real time estimate of FPS as the page runs. See View frames per second in real time with the FPS meter .
The Frames section
The Frames section tells you exactly how long a particular frame took.
Hover over a frame to view a tooltip with more information about it.
This example shows a tooltip when you hover over a frame.
The Frames section can show four types of frames:
- Idle frame (white) . No changes.
- Frame (green) . Rendered as expected and in time.
- Partially presented frame (yellow with a sparse wide dash-line pattern) . Chrome did its best to render at least some visual updates in time. For example, in case the work of the main thread of the renderer process (canvas animation) is late but the compositor thread (scrolling) is in time.
- Dropped frame (red with a dense solid-line pattern) . Chrome can't render the frame in reasonable time.
This example shows a tooltip when you hover over a partially presented frame.
Click a frame to view even more information about the frame in the Summary tab. DevTools outlines the selected frame in blue.
View network requests
Expand the Network section to view a waterfall of network requests that occurred during the performance recording.
Next to the Network track name, there's a legend with color-coded request types.
Render blocking requests are marked with a red triangle in the upper right corner.
Hover over a request to see a tooltip with:
- Request's URL and the total time it took to execute it.
- Priority or a change of priority, for example,
Medium -> High. - Whether the request is
Render blockingor not. - A breakdown of request timings, described later.
When you click a request, the Network track draws an arrow from its initiator to the request.
Additionally, the Performance panel shows you the Summary tab with more information about the request, including but not limited to Initial Priority and (final) Priority fields. If their values differ, the fetch priority of the request has changed during the recording. For more information, see Optimizing resource loading with the Fetch Priority API .
The Summary tab also shows a breakdown of the request's timings.
The request for www.google.com is represented by a line on the left ( |– ), a bar in the middle with a dark portion and a light portion, and a line on the right ( –| ).
You can find another timings breakdown in the Network tab. Right-click the request in the Network track or its URL in the Summary tab and click Reveal in Network panel . DevTools takes you to the Network panel and selects the corresponding request. Open its Timing tab.
Here's how these two breakdowns map to each other:
- The left line (
|–) is everything up to theConnection startgroup of events, inclusive. In other words, it's everything beforeRequest Sent. - The light portion of the bar is
Request sentandWaiting for server response. - The dark portion of the bar is
Content download. - The right line (
–|) is the time spent waiting for the main thread. The Network > Timing tab doesn't show it.
View memory metrics
Enable the Memory checkbox to view memory metrics from the last recording.
DevTools displays a new Memory chart, above the Summary tab. There's also a new chart below the NET chart, called HEAP . The HEAP chart provides the same information as the JS Heap line in the Memory chart.
This example shows memory metrics above the Summary tab.
The colored lines on the chart map to the colored checkboxes above the chart. Disable a checkbox to hide that category from the chart.
The chart only displays the region of the recording that is selected. In the earlier example, the Memory chart shows only the memory usage for the start of the recording, up to around the 1000ms mark.
View the duration of a portion of a recording
When analyzing a section like Network or Main , sometimes you need a more precise estimate of how long certain events took. Hold Shift, click and hold, and drag left or right to select a portion of the recording. At the bottom of your selection, DevTools shows how long that portion took.
In this example, the 488.53ms timestamp at the bottom of the selected portion indicates how long that portion took.
View a screenshot
See Capture screenshots while recording to learn how to enable screenshots.
Hover over the Timeline overview to view a screenshot of how the page looked during that moment of the recording. The Timeline overview is the section that contains the CPU , FPS , and NET charts.
You can also view screenshots by clicking a frame in the Frames section. DevTools displays a small version of the screenshot in the Summary tab.
This example shows the screenshot for the 195.5ms frame in the Summary tab when you click it in the Frames section.
Click the thumbnail in the Summary tab to zoom in on the screenshot.
This example shows a zoomed-in screenshot after you click its thumbnail in the Summary tab.
View layers information
To view advanced layers information about a frame:
- Enable advanced paint instrumentation .
- Select a frame in the Frames section. DevTools displays information about its layers in the new Layers tab, next to the Event Log tab.
Hover over a layer to highlight it in the diagram.
This example shows the layer #39 highlighted as you hover over it.
To move the diagram:
- Click Pan Mode to move along the X and Y axes.
- Click Rotate Mode to rotate along the Z axis.
- Click Reset Transform to reset the diagram to its original position.
See layer analysis in action:
View paint profiler
To view advanced information about a paint event:
- Enable advanced paint instrumentation .
- Select a Paint event in the Main track.
Analyze rendering performance with the Rendering tab
Use the Rendering tab's features to help visualize your page's rendering performance.
View frames per second in real time with the FPS meter
The Frame rendering stats is an overlay that appears in the top-right corner of your viewport. It provides a real time estimate of FPS as the page runs.
See Frame rendering stats .
View painting events in real time with Paint Flashing
Use Paint Flashing to get a real time view of all paint events on the page.
See Paint flashing .
View an overlay of layers with Layer Borders
Use Layer Borders to view an overlay of layer borders and tiles on top of the page.
See Layer borders .
Find scroll performance issues in real time
Use Scrolling Performance Issues to identify elements of the page that have event listeners related to scrolling that may harm the performance of the page. DevTools outlines the potentially-problematic elements in teal.