
Use the WebMCP panel in Chrome DevTools to inspect, debug, and test the client-side AI tools your website exposes to AI agents. The panel provides full end-to-end visibility into the tool lifecycle, including registration, schema validation, and invocation history.
Open the WebMCP pane
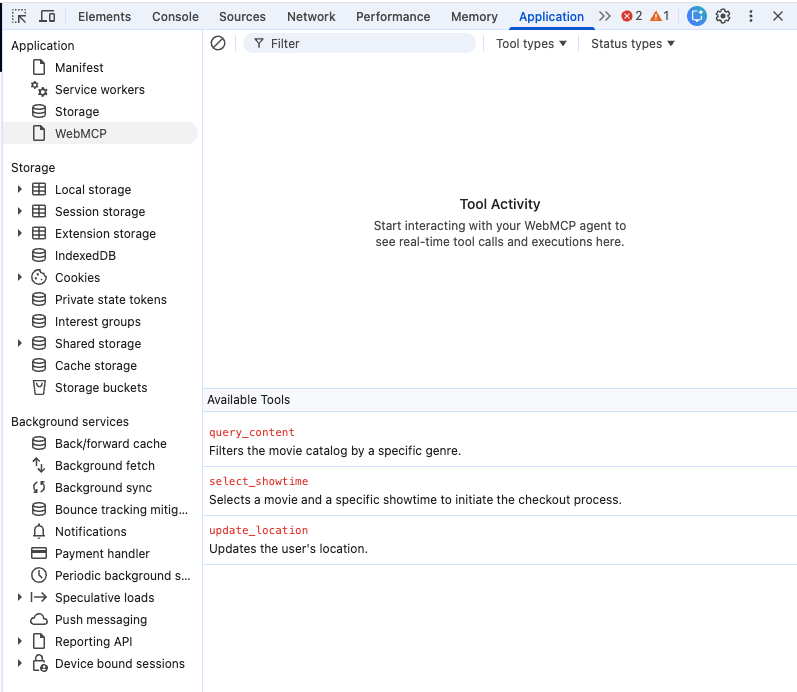
The WebMCP pane is located within the Application panel. To open it, follow these steps:
- Open Chrome DevTools on a page that uses WebMCP tools.
- Click the Application tab.
- In the top level of the sidebar, select the WebMCP pane.
Interface overview
The WebMCP panel uses a dual-pane layout to help you manage and monitor your tools:
- Invoked Tools: A chronological log of interactions between the AI agent and the page.
- Available Tools: A live list of all WebMCP tools detected on the active tab.
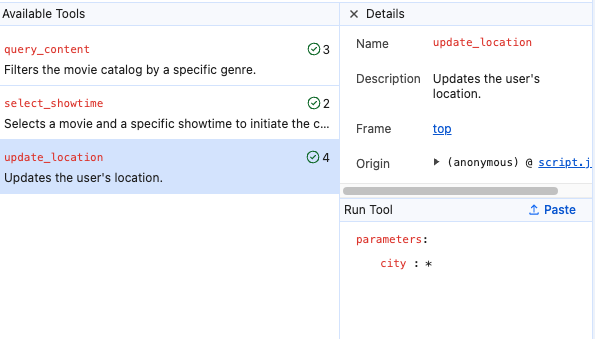
Available tools
The Available tools section displays the tool names and descriptions as they appear to the AI agent. It also includes an invocation counter for each tool, which shows how many times a tool was called during the current session.
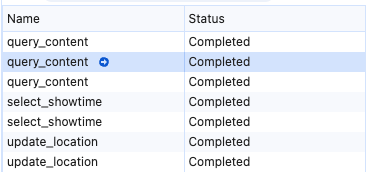
Invoked tools
The Invoked tools log provides a persistent record of tool interactions. When you select an entry in the log, you can inspect the following details:
- Status: The result of the invocation (Completed, Canceled, In Progress, or Error.)
- Input: The exact parameters the agent predicted and sent to the tool.
- Output: The return value or error message provided by the tool.
Filter the log
Use the Filter bar to narrow down the list of invoked tools based on the following criteria:
- Name or description: Enter text to find tools matching a specific name or purpose.
- Status type: Filter calls by their current state, such as Completed, Error, Cancelled, or In Progress.
- Tool type: Select to filter Declarative tools defined in HTML and Imperative tools defined in JavaScript. To see all tool types, ensure neither filter is active.
Test tools manually
You can bypass the AI agent's decision logic to test your tool's reliability independently. This is useful for verifying function logic without waiting for a specific agent prompt.
In the Available Tools list, click the tool you want to test. Alternatively, in the Invoked Tools log, hover over a tool to reveal the Play (➜) icon and click it. The manual test area opens.
In the manual test area, enter or adjust parameters in the input fields.
Click Run tool.
Troubleshoot integration issues
The WebMCP panel helps you diagnose common integration failures:
- Schema violations: The output pane displays error messages if the tool parameters or return values don't match the defined schema.
- Agent rejection: Check the invocation counter in the Available Tools list to see if the agent ever considered your tool for a given prompt.
Automation and agents
WebMCP is designed for the agentic web, where AI agents can discover and interact with your site's tools. For agent-assisted development, the Chrome DevTools for agents project provides a specialized interface that uses this protocol to help AI agents test and use your WebMCP tools.
Command-line flags
To interact with certain agentic interfaces, you must enable the
--categoryWebMCP flag explicitly.
Related resources
To learn more about WebMCP and the agentic web, see the following resources: