

发布时间:2024 年 9 月 17 日
在上一篇博文中,我们介绍了三项新功能,可帮助您在开发者工具中自定义性能工作流。这些人体工学改进只是我们多年努力的开端,我们希望让开发者工具在优化 Core Web Vitals 方面变得更加简单、更强大。今天,我们将推出下一批功能:全新设计的“效果”面板着陆页,可实时查看本地 Core Web Vitals 性能。
在本博文中,我们将详细介绍每项新功能:
实时本地 Core Web Vitals 性能
能够衡量本地体验的表现是任何 Core Web Vitals 调试工作流程的关键部分。这可能会决定能否重现真实用户问题。不过,衡量本地广告效果并不总是如此简单。
过去,DevTools 中的“性能”面板会显示网络请求和 CPU 活动的详细时间轴,这对性能调试非常有用。不过,由于您只有在录制完成后才能知道性能是否不佳,因此很难重现性能问题。正如我们从 Web Vitals 扩展程序中了解到的那样,在 DevTools 中查看本地 Core Web Vitals 性能是一件具有开创性意义的事情。因此,我们吸取了从该扩展程序中获得的所有经验,并决定直接将这些功能内置到“效果”面板中。
首次在“效果”面板中提供所有 Core Web Vitals 指标。打开“效果”面板,您将立即看到本地体验的效果,无需录制。事实上,您甚至无需打开开发者工具;系统会在后台收集指标,并在您需要时提供。当您可能并非积极尝试调试特定问题,但某些操作感觉运行缓慢,并且您想了解原因时,这会非常有用。
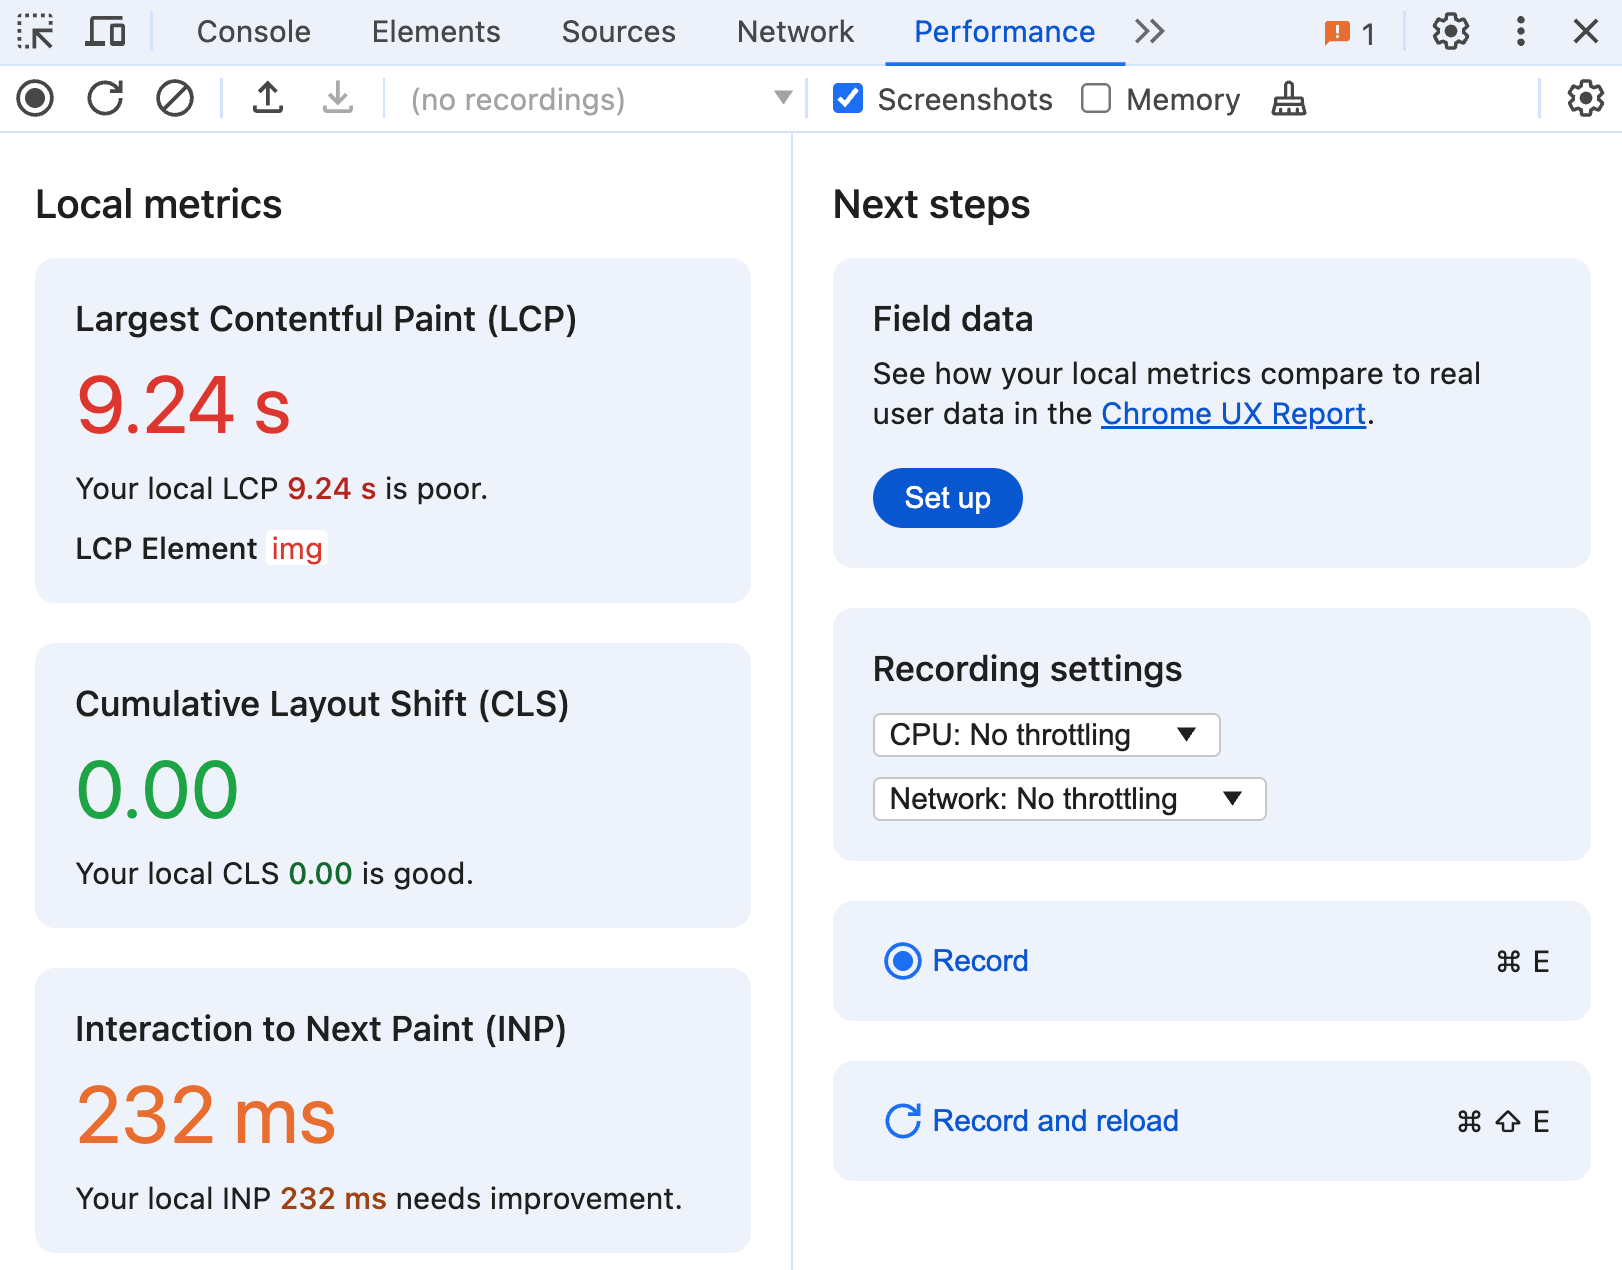
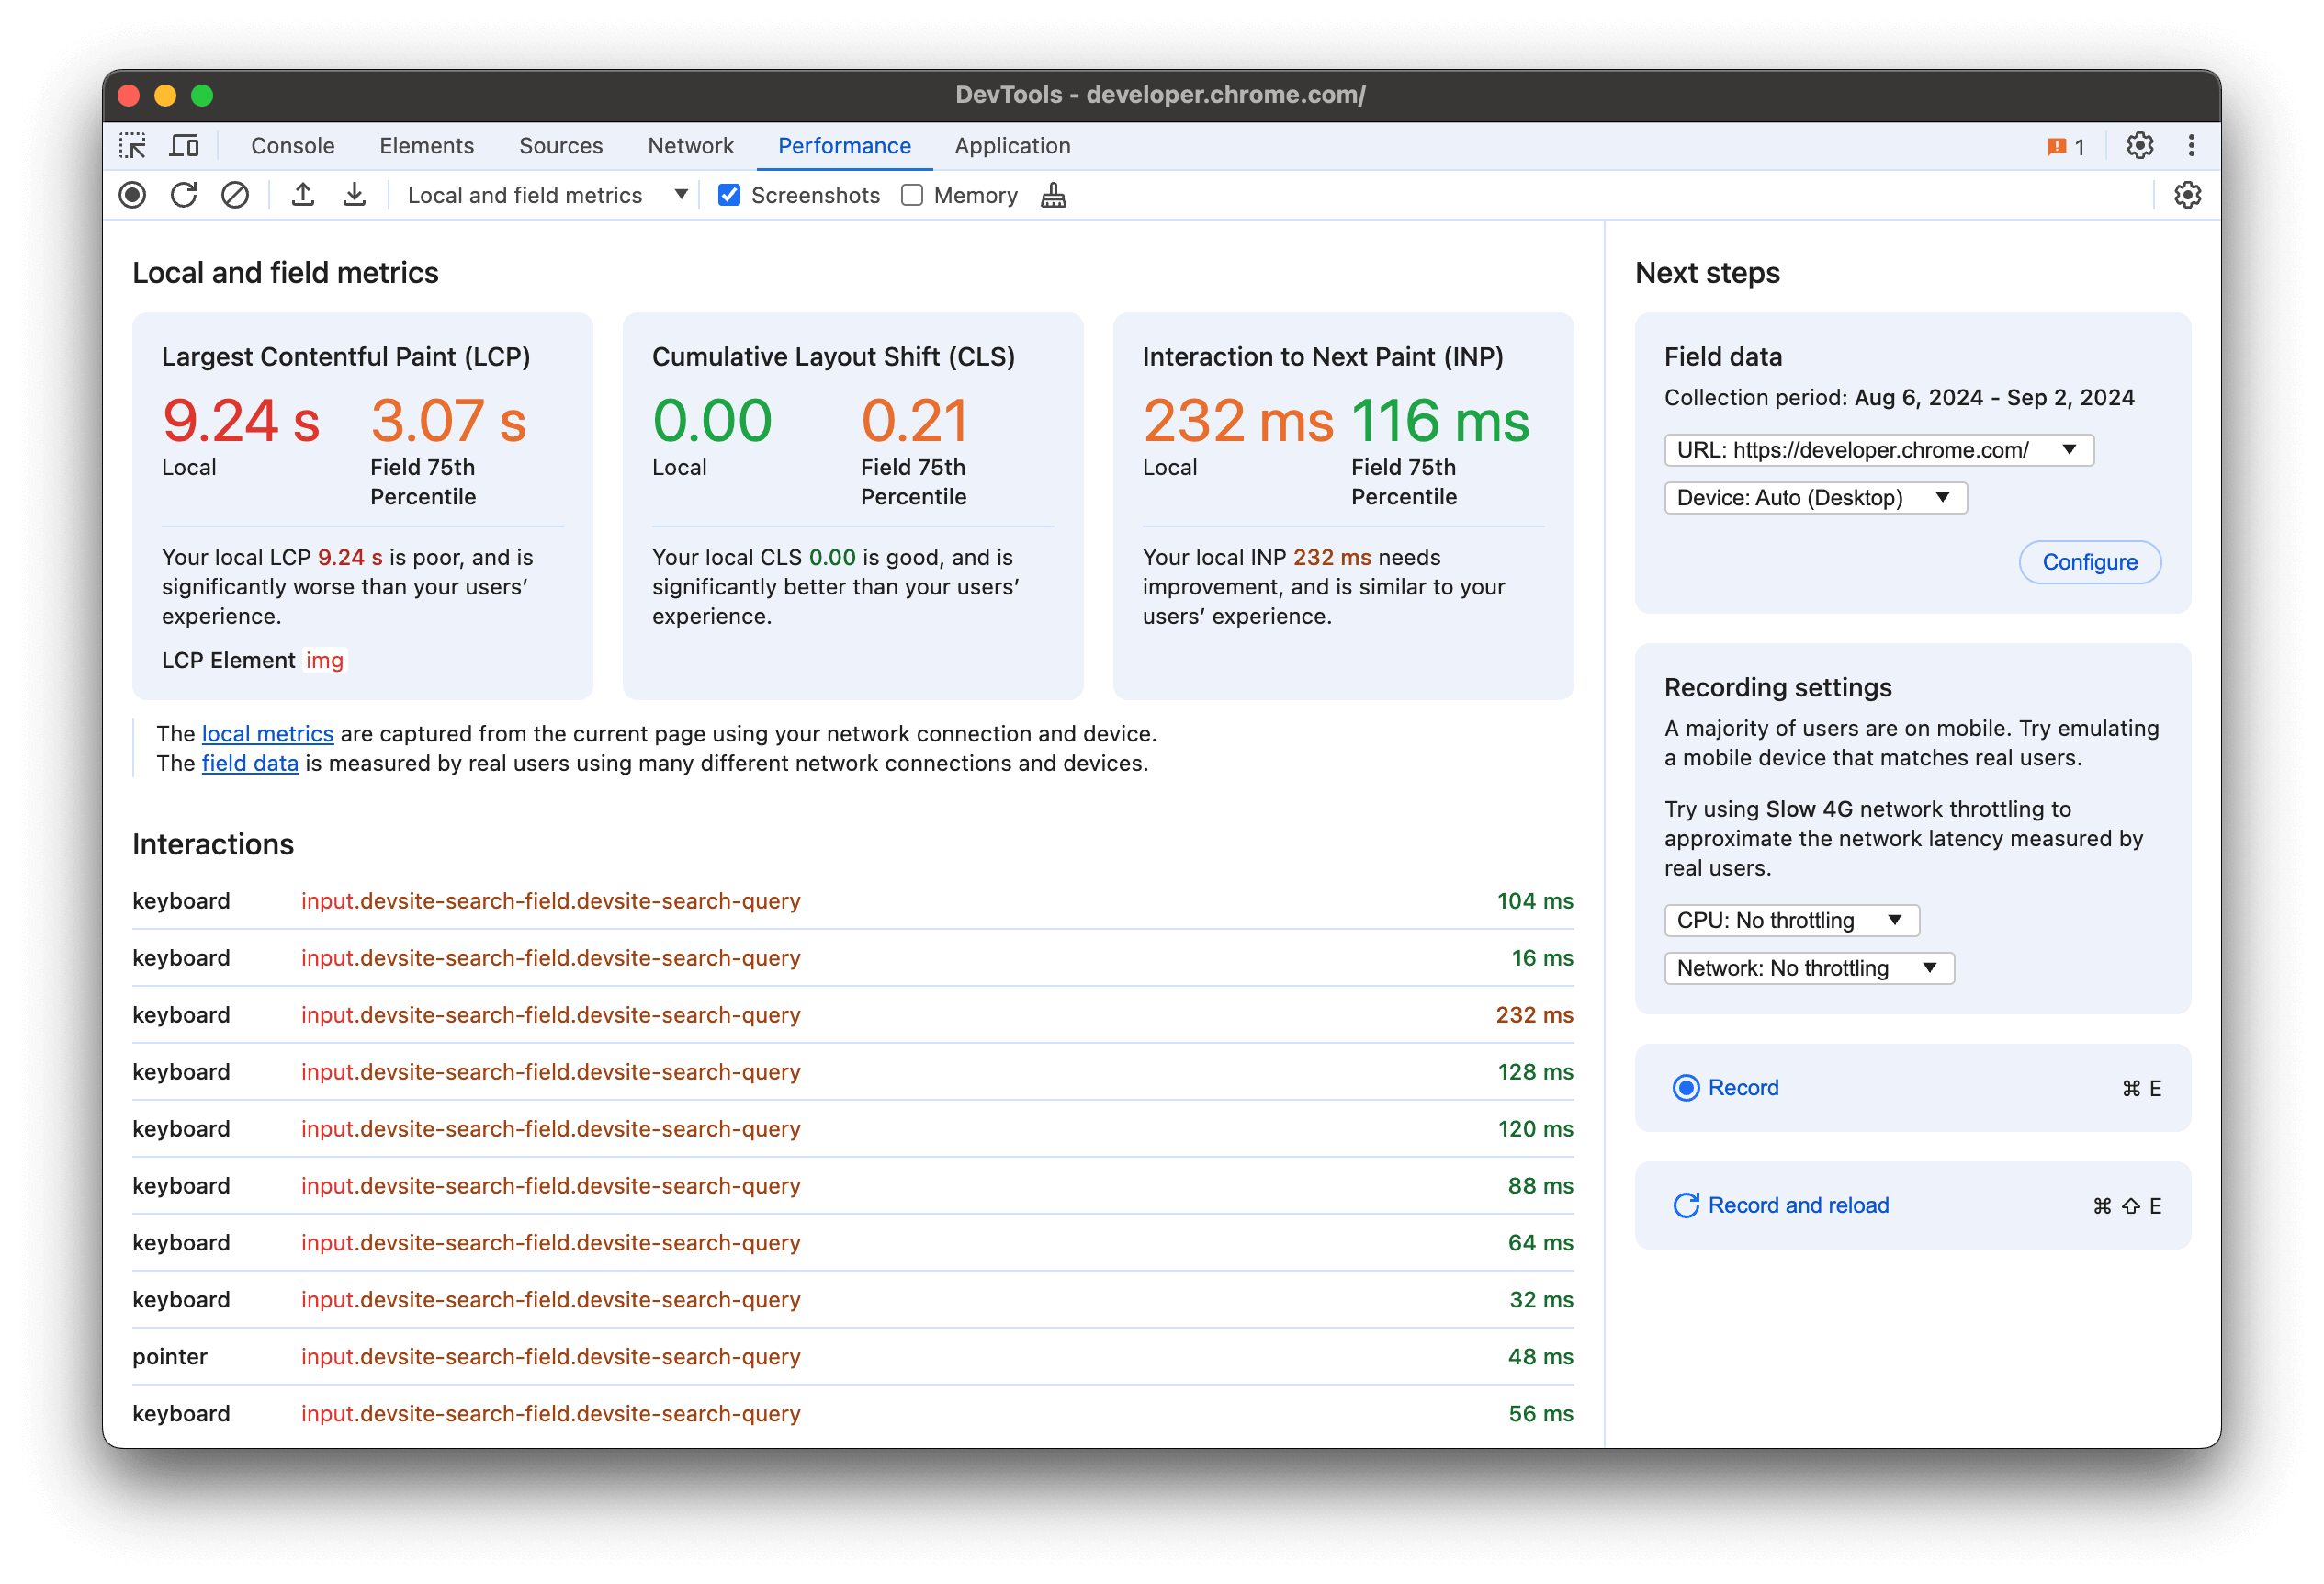
该面板的本地指标部分会实时显示本地 Core Web Vitals 指标:Largest Contentful Paint、Cumulative Layout Shift 和 Interaction to Next Paint。在您加载网页并与其互动时,这些指标会实时更新。系统还会根据良好和不良效果的各自阈值对其进行颜色编码,以便您更轻松地发现性能问题。
真实用户体验数据
优化大多数用户从未遇到的性能问题可能不是最明智的做法。同样,如果您的本地体验速度不切实际,您可能忽略了一些实际问题。因此,为了更明智地决定如何分配时间,您应将本地效果与来自现场的实际用户体验数据进行比较。

现在,您可以在“效果”面板中查看本地体验旁边的真实用户数据。这些数据由公开的 CrUX API 提供支持,该 API 会汇总特定网页和来源的真实用户体验数据,时间范围为 28 天。如需启用此功能,请点击字段数据部分中的设置,然后按照配置对话框中的说明操作。
请注意,单个网址和来源(整个网站)必须满足特定的资格条件,才能纳入 CrUX 数据集中。如果有足够的数据,系统还会按桌面设备和移动设备类型汇总用户体验。开发者工具会尽力自动显示与您的本地体验最相关的数据,并默认使用相同的网址和设备类型(如果有)。如果桌面版或移动版数据不足,系统会尝试显示汇总的所有设备类型数据。
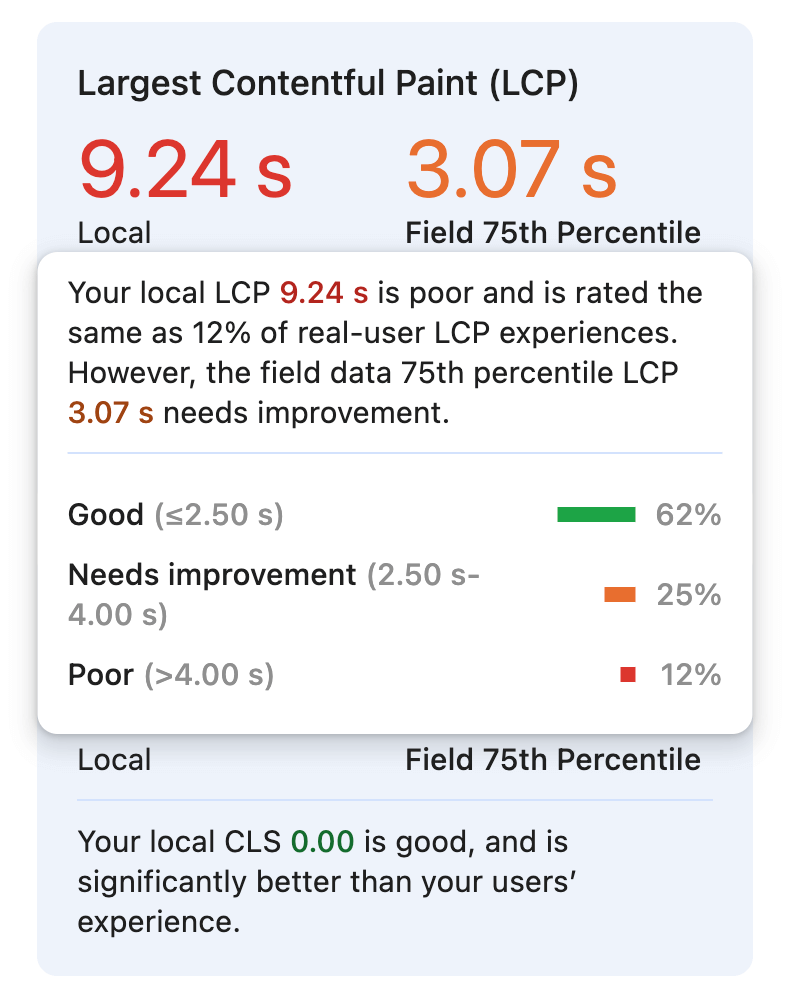
除了第 75 个百分位数值之外,您还可以将鼠标悬停在任何指标上,查看各个评分中实际用户体验的比例。在此示例中,本地 Largest Contentful Paint 体验异常缓慢,仅与 12% 的真实用户体验类似。
有了这些数据,您将更清楚地了解本地体验的代表性,并能够对其进行微调,以更贴近地模拟典型用户体验。
有关配置本地环境的建议
实验室数据与现场数据之间存在许多差异,而用户访问和与网页互动的方式多种多样,这进一步加大了差异。您可以通过配置环境来考虑其中的一些差异,并使本地体验更具代表性。

当现场数据已启用且可用时,录制设置部分会建议模拟真实用户最常用的设备类型。通过启用设备模式,您可以模拟移动设备的视口大小。响应式界面可能会更改归因于最大内容渲染时间的元素,并且具有非常不同的性能特性。移动布局可能还会显示特定元素(例如只有移动用户才能与之互动的导航菜单),或者导致在较大的视口中不会出现的独特布局转换。
此部分可能还会推荐特定的网络节流配置,例如4G 网络速度缓慢。网络建议基于第 75 百分位数的往返时间指标,该指标是从该网页或网站上的真实用户体验汇总得出的。较慢的网络速度可以让网页的加载性能特征更贴近现实(对于真实的桌面设备用户和移动设备用户而言),从而更容易发现改进机会。另请注意,只有在互动后的 500 毫秒内未发生布局偏移,系统才会将其计入累计布局偏移指标。如果用户发起的布局偏移是网络请求的结果,则限制网络流量可能是在本地显示该偏移的唯一方法。
节流 CPU 是让本地设备的表现更接近真实用户的另一种方式。CPU 节流功能可以更好地模拟移动设备通常运行速度较慢的方式,速度较快的机器需要进行更严格的节流。开发者工具最近新增了将 CPU 节流 20 倍的功能,这对于开发者经常使用的高性能桌面设备尤为有用。受限的 CPU 会导致脚本运行速度变慢,使其更有可能成为导致 Interaction to Next Paint 问题的长任务。出于同样的原因,其他 Core Web Vitals 指标也可能会受到脚本执行速度缓慢的影响,尤其是当脚本阻止渲染最大的内容或会使布局发生变化的元素时。
使用更逼真的视口、网络和 CPU 设置配置本地环境后,您应该会发现更多可能之前未知的性能问题。借助基于真实用户数据的建议,您可以省去猜测,更专注于发现和解决这些问题。
有助于您重现问题的信息
本地性能在很大程度上取决于环境的配置方式以及您与网页的互动方式。例如,在典型的网页上,在移动设备视口大小下,Largest Contentful Paint 元素不太可能是图片。在文本字段中输入一个字符可能很快,但连续快速输入多个字符可能会导致“互动到下次绘制”时间过长。为了帮助您了解这一点并获得更可重现的体验,我们提供了有关这些指标的更多信息。
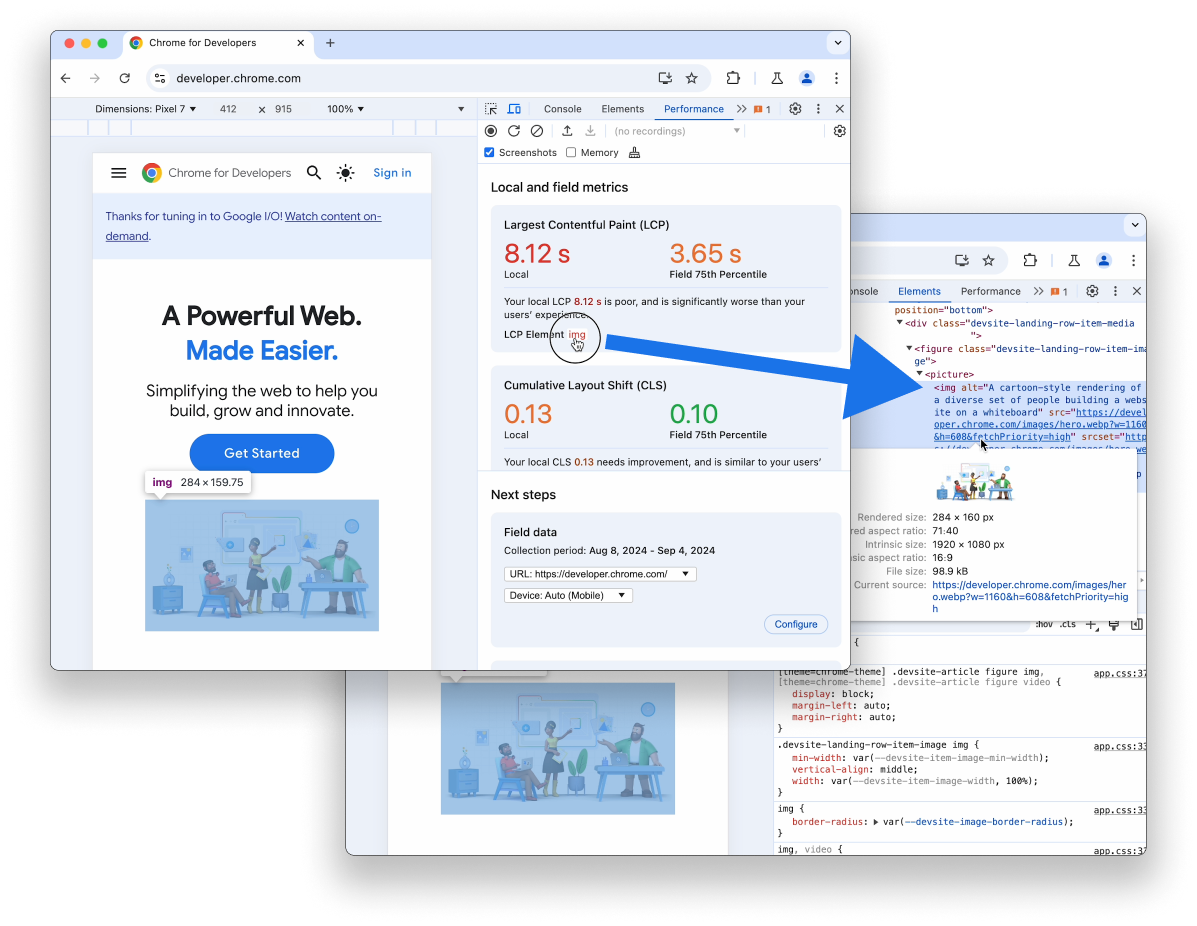
与 Largest Contentful Paint 指标关联的 LCP 元素会显示指向该元素本身的链接。将光标悬停在链接上会突出显示页面上的元素。点击该链接即可前往“元素”面板,以便在文档的完整上下文中查看相应元素。

互动部分是开发者工具处于打开状态时发生的所有符合条件的互动的实时日志。当您输入、点按或点击时,系统会将每次互动添加到日志中,并附上其他信息,以帮助您更好地了解发生了什么以及如何重现问题。
除了互动类型(指针事件或键盘事件)之外,您还会看到对互动目标的引用。与 LCP 元素类似,互动目标本身也是可互动的,您可以将鼠标悬停在其上以在页面上突出显示它,也可以点击它以在“元素”面板中查看它。系统还会显示互动延迟时间,并使用与 Interaction to Next Paint 指标阈值相同的颜色编码,以便您更轻松地发现延迟时间最长的网页。
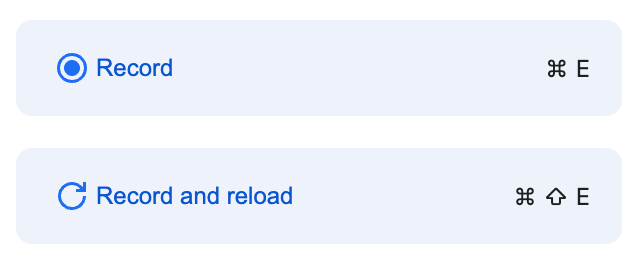
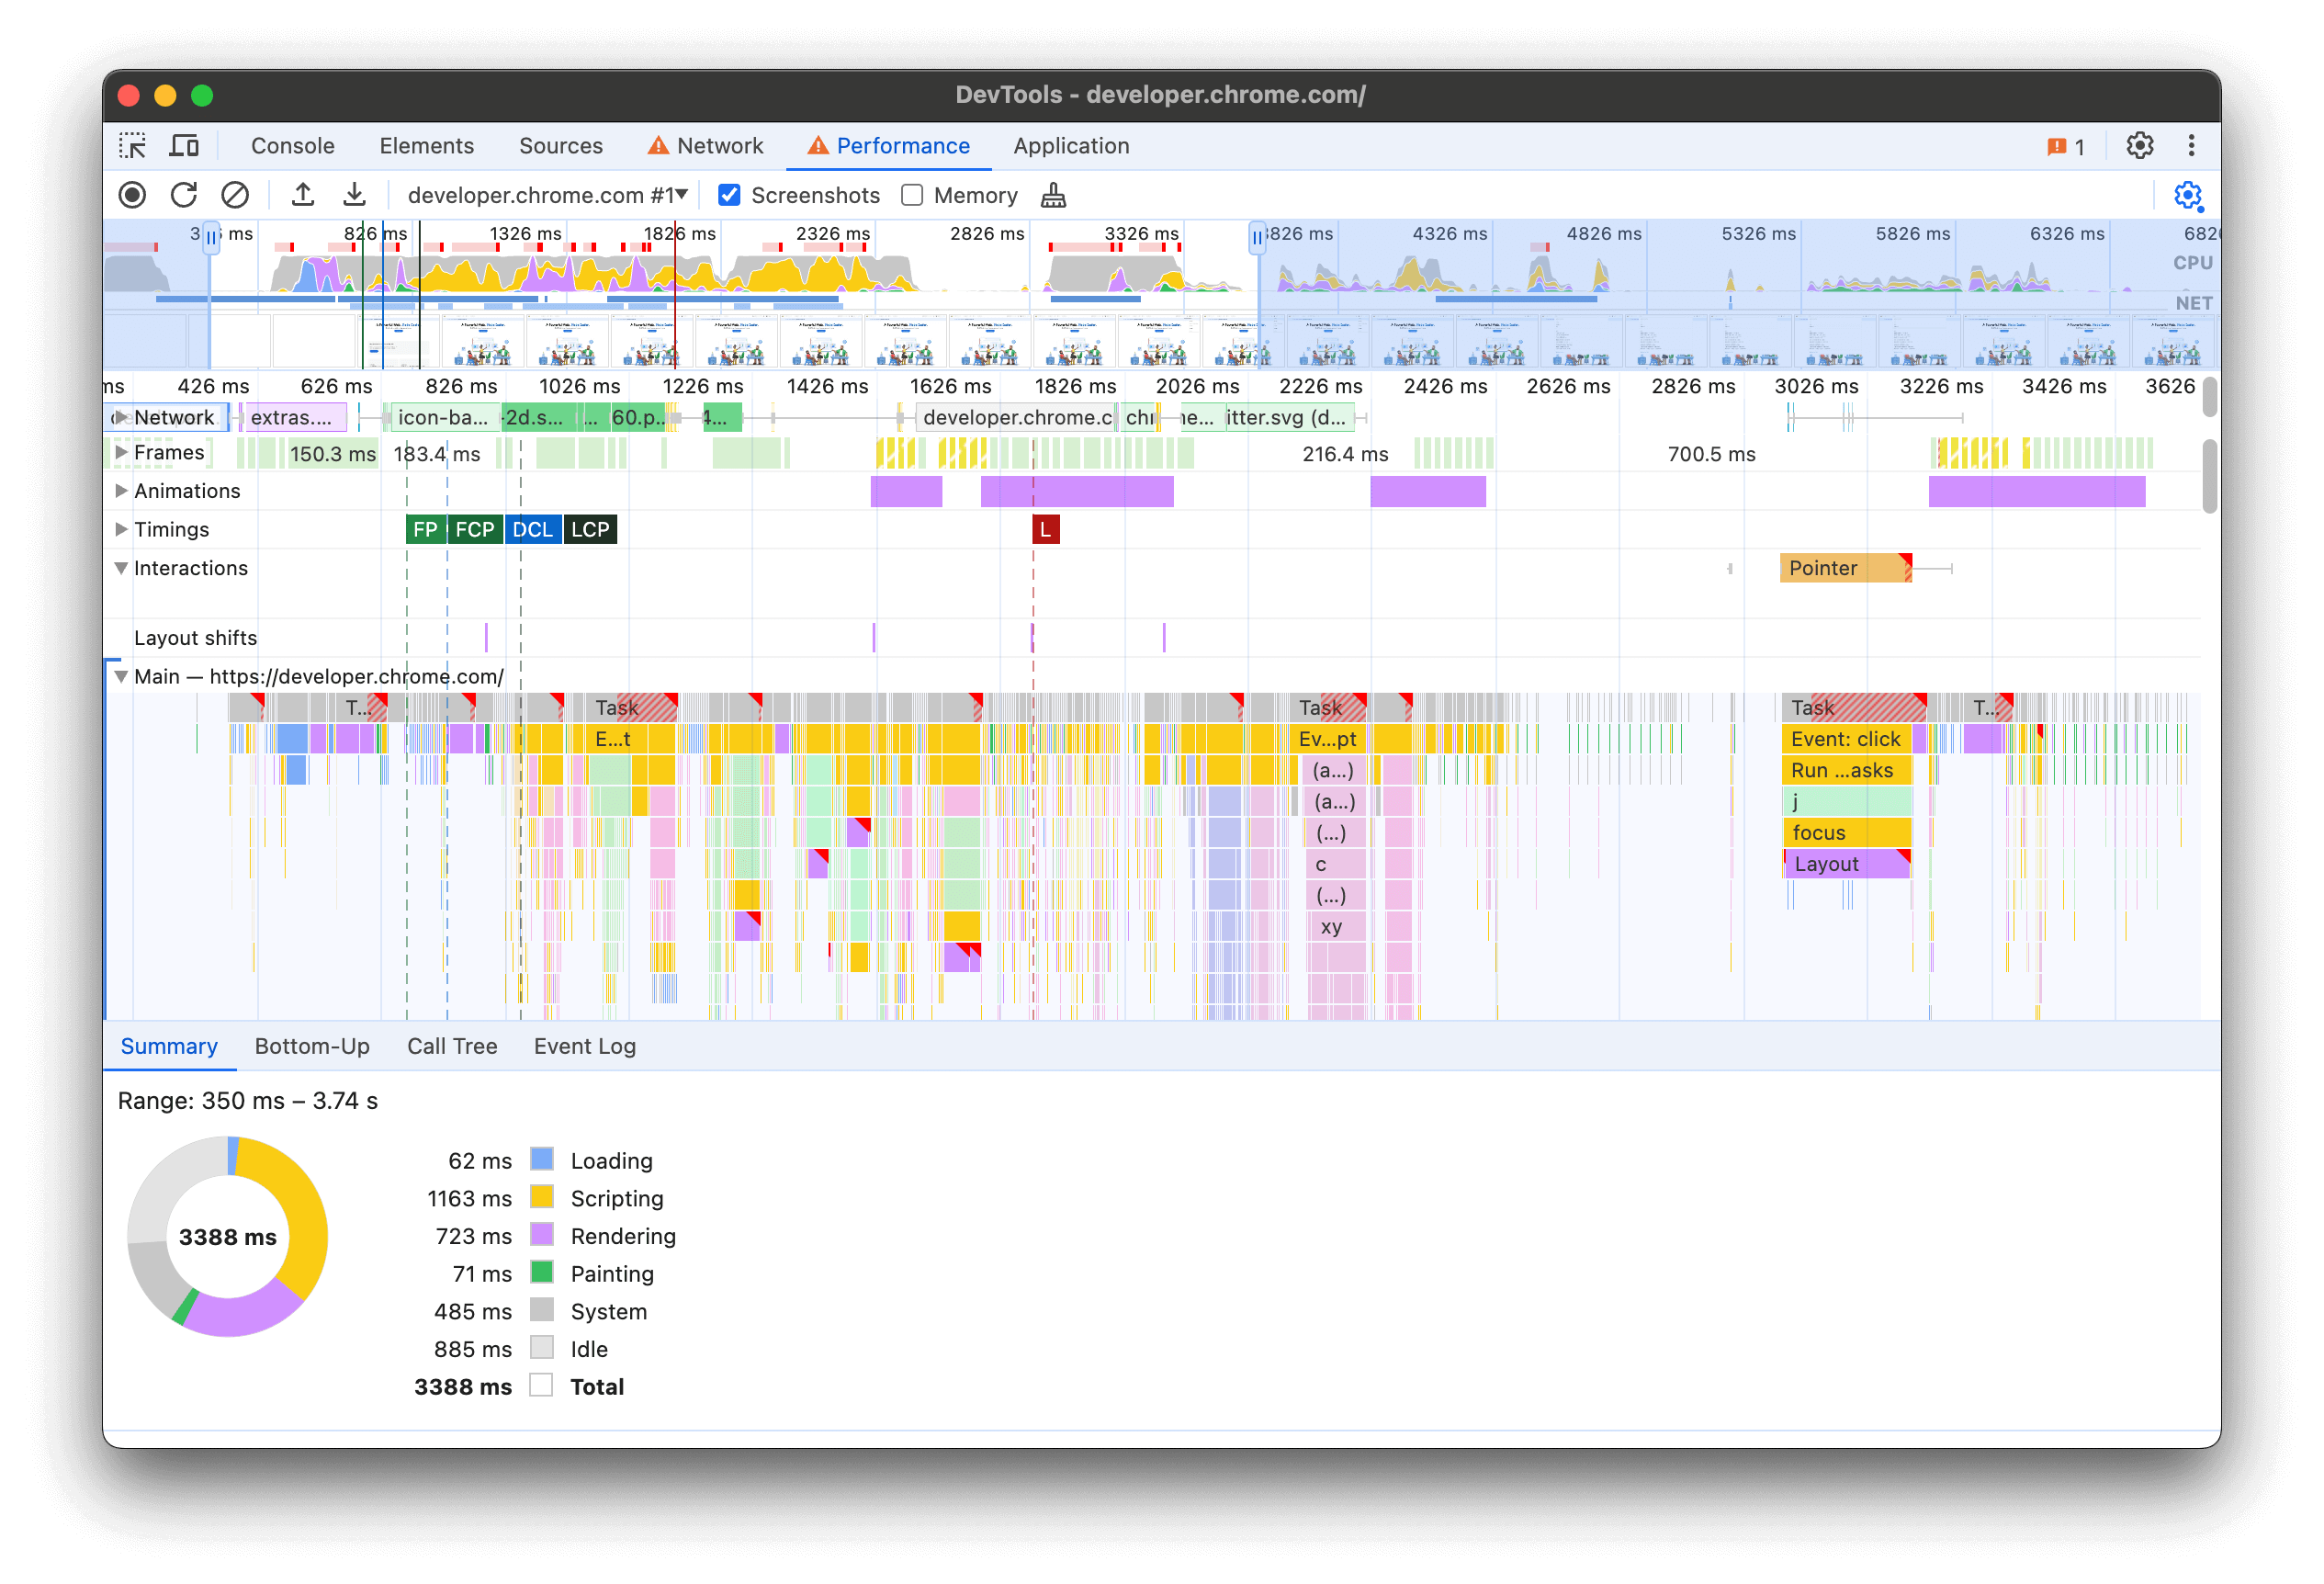
当您能够重现要调试的性能问题时,就可以开始性能分析了。在后续步骤部分下,使用记录并重新加载按钮调试加载性能问题,例如 Largest Contentful Paint 和加载时间 累积布局偏移。如需调试因用户互动而发生的问题,请使用记录按钮对网页进行性能分析,同时手动重现互动缓慢或加载后布局偏移。
后续步骤
将性能工作流基于来自现场的实时本地数据和真实用户数据,有助于您确定是否应投入更多精力来调试和优化指标。您应使用这些数据调整本地环境,以更逼真地模拟用户的设备类型、CPU 速度或网络配置,从而更好地重现用户的性能问题。
对于网页指标扩展程序的任何用户来说,您可能都熟悉其中的许多功能,因此可能会好奇这对扩展程序意味着什么。我们将在未来几周内分享更多信息,介绍这些变更对扩展程序的影响。
我们对效果面板所做的所有改进才刚刚起步,未来还会有更多改进。我们很快就会再次在此处发布最新动态,但在此之前,我们建议您试用效果面板中的所有新功能,并告诉我们您的想法。如果您有任何反馈,欢迎在公开问题中留言。