This page is a comprehensive reference of accessibility features in Chrome DevTools. It is intended for web developers who:
- Have a basic understanding of DevTools, such as how to open it.
- Are familiar with accessibility principles and best practices.
The purpose of this reference is to help you discover all of the tools available in DevTools that can help you examine a page's accessibility.
See Navigating Chrome DevTools With Assistive Technology if you're looking for help on navigating DevTools with an assistive technology like a screen reader.
See Learn Accessibility if you'd like to learn how to develop accessible websites.
Overview of accessibility features in Chrome DevTools
This section explains how DevTools fits into your overall accessibility toolkit.
When determining whether a page is accessible, you need to have 2 general questions in mind:
- Can I navigate the page with a keyboard or screen reader?
- Are the page's elements properly marked up for screen readers?
In general, DevTools can help you fix errors related to question #2, because these errors are easy to detect in an automated fashion. Question #1 is just as important, but unfortunately DevTools can't help you there. The only way to find errors related to question #1 is to try using a page with a keyboard or screen reader yourself. See How To Do An Accessibility Review to learn more.
Audit a page's accessibility
In general, use the accessibility checks under the Lighthouse panel to determine if:
- A page is properly marked up for screen readers.
- The text elements on a page have sufficient contrast ratios. See also Make your website more readable.
To audit a page:
- Go to the URL that you want to audit.
In DevTools, click the Lighthouse panel. DevTools shows you various configuration options.
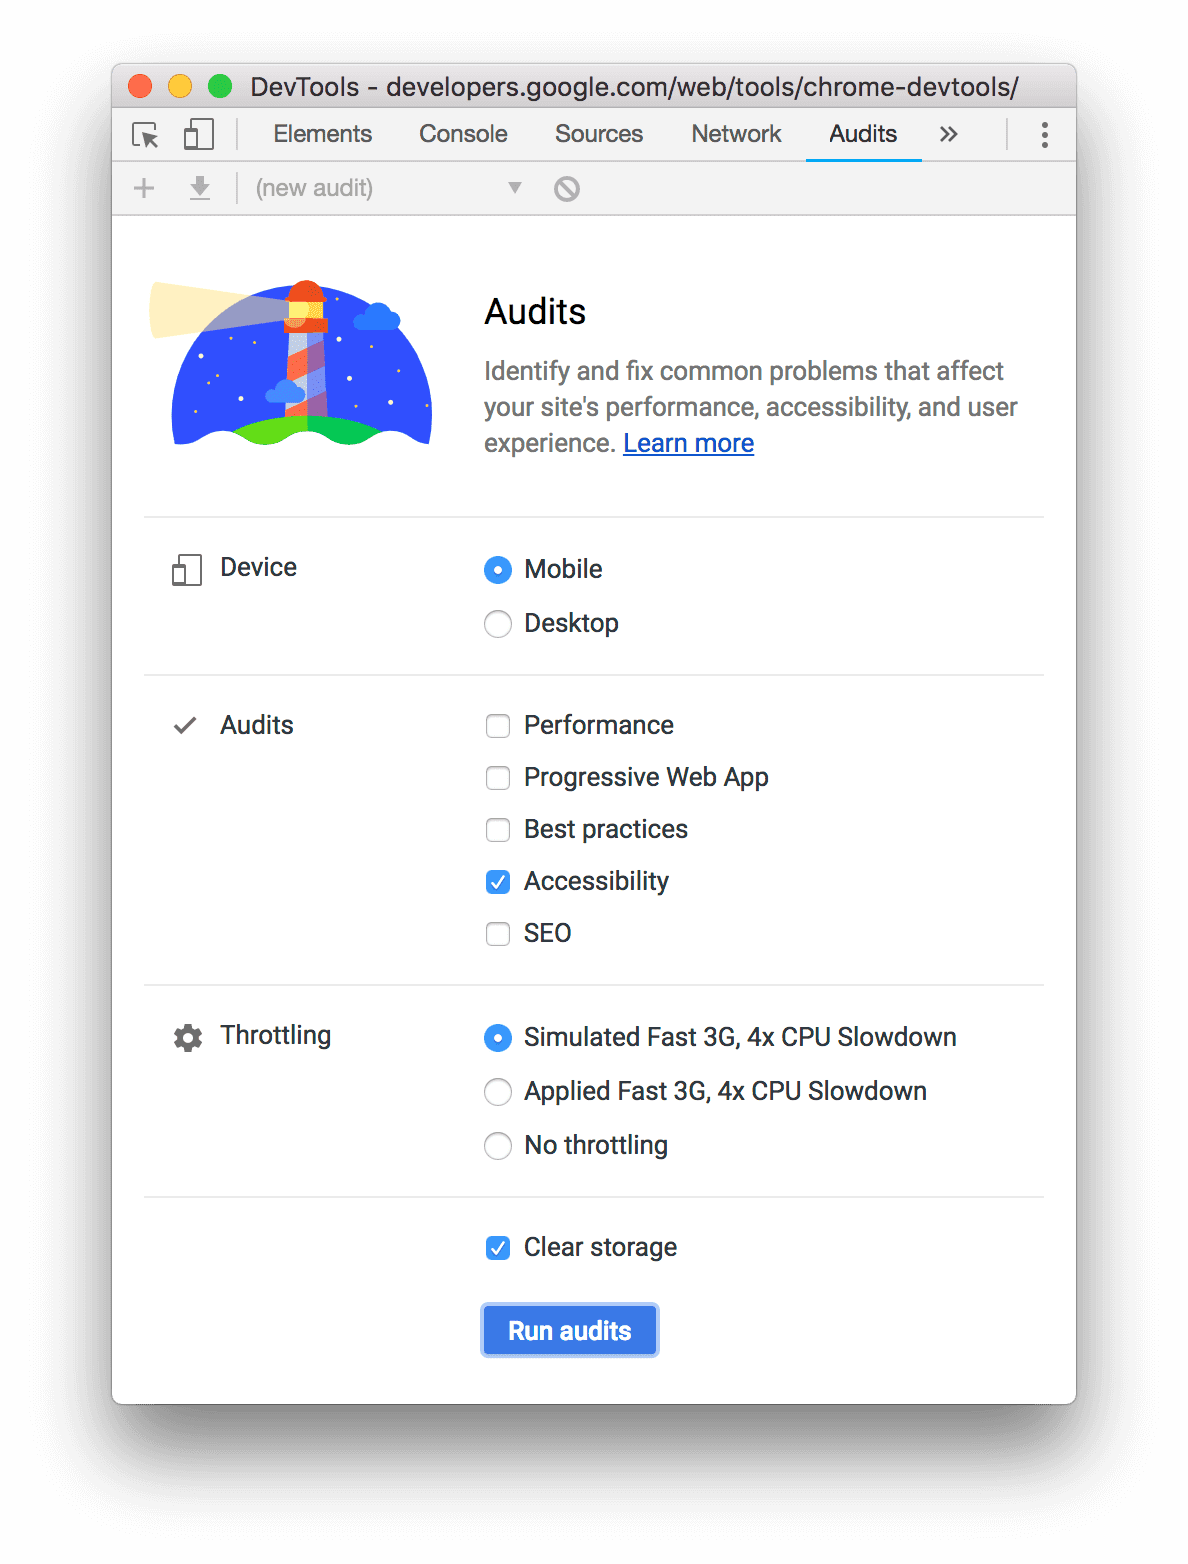
For Device, select Mobile if you want to simulate a mobile device. This option changes differently your user agent string and resizes the viewport. If the mobile version of the page displays differently than the desktop version, this option could have a significant effect on the results of your audit.
In the Lighthouse section, make sure that Accessibility is enabled. Disable the other categories if you want to exclude them from your report. Leave them enabled if you want to discover other ways to improve the quality of your page.
The Throttling section lets you throttle the network and CPU, which is useful when analyzing load performance. This option should be irrelevant to your accessibility score, so you can use whatever you prefer.
The Clear Storage checkbox lets you clear all storage before loading the page, or preserve storage between page loads. This option is also probably irrelevant to your accessibility score, so you can use whatever you prefer.
Click Generate Report. After 10 to 30 seconds, DevTools provides a report. Your report gives you various tips on how to improve the page's accessibility.
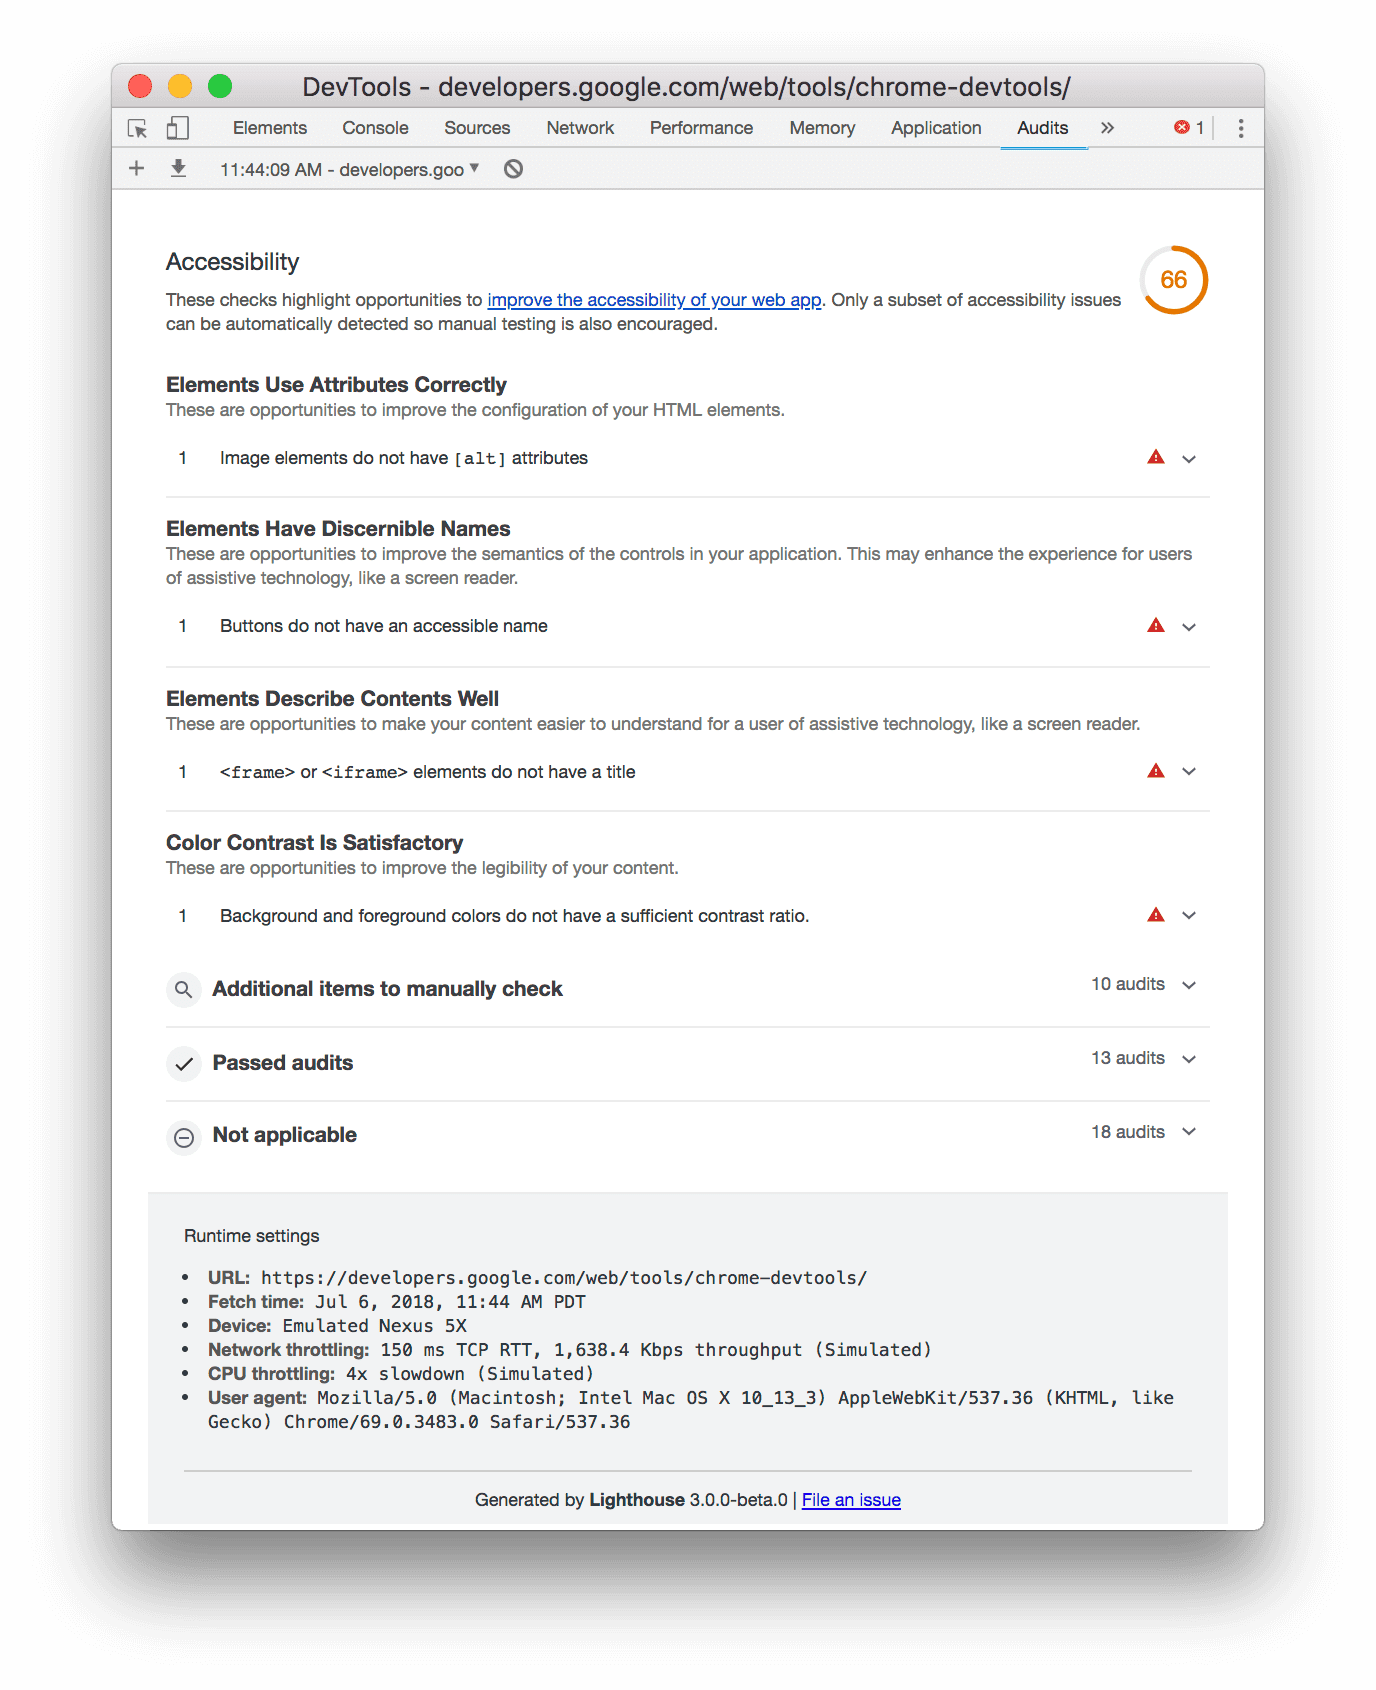
Click an audit to learn more about it.
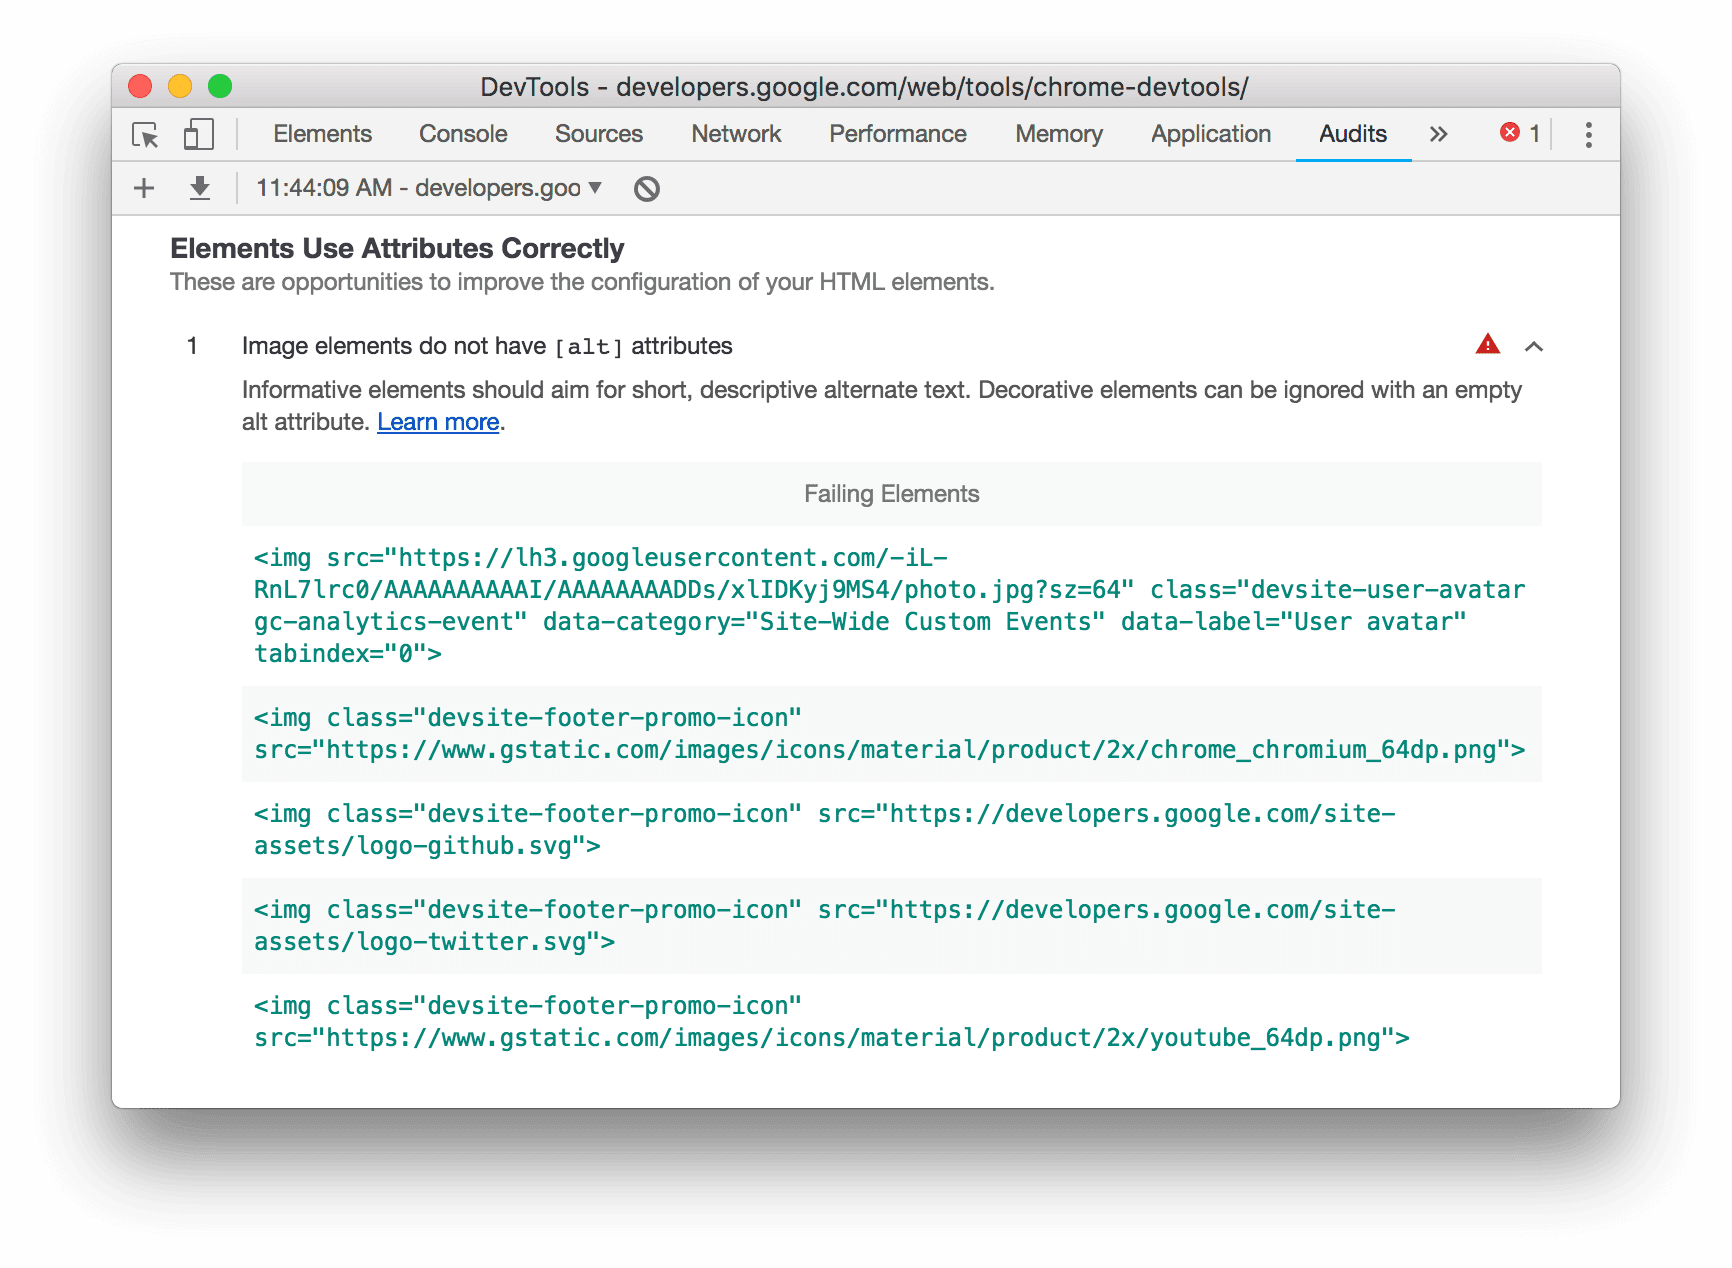
Click Learn More to view that audit's documentation.
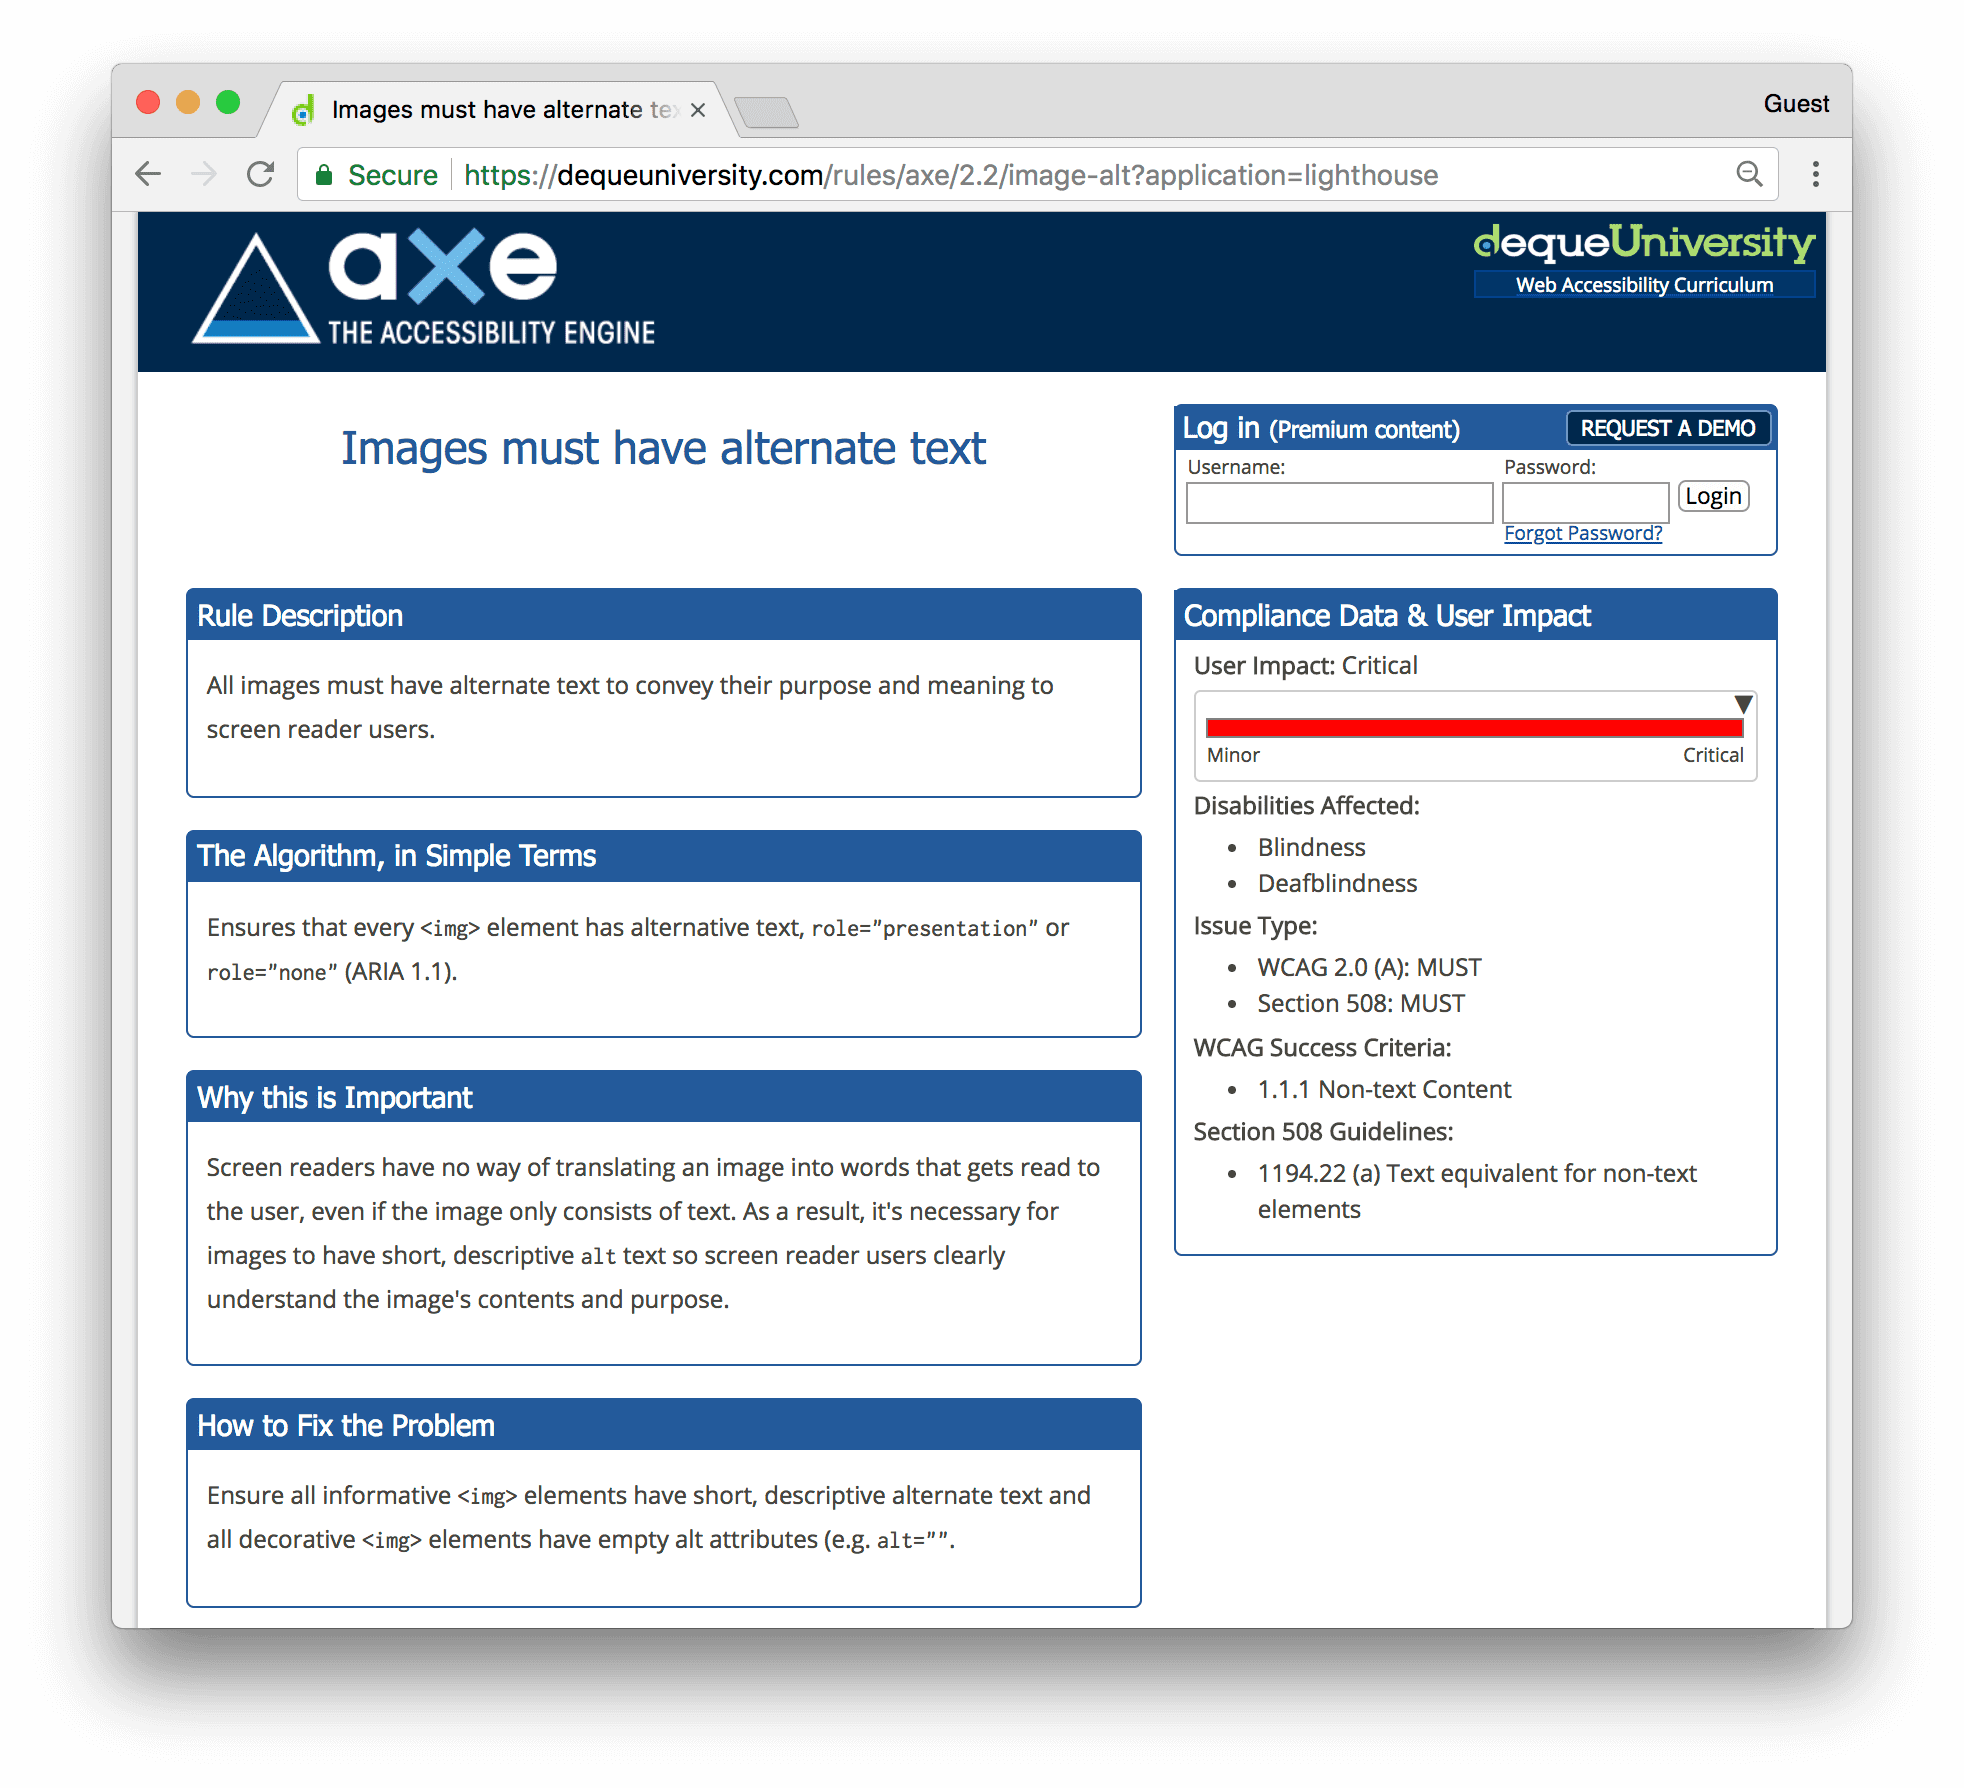
See also: aXe extension
You may prefer to use the aXe extension or Lighthouse extension rather than the Lighthouse panel that is available by default in Chrome. They generally provide the same information, since aXe is the underlying engine that powers the Lighthouse panel. The aXe extension has a different UI and describes audits slightly differently.
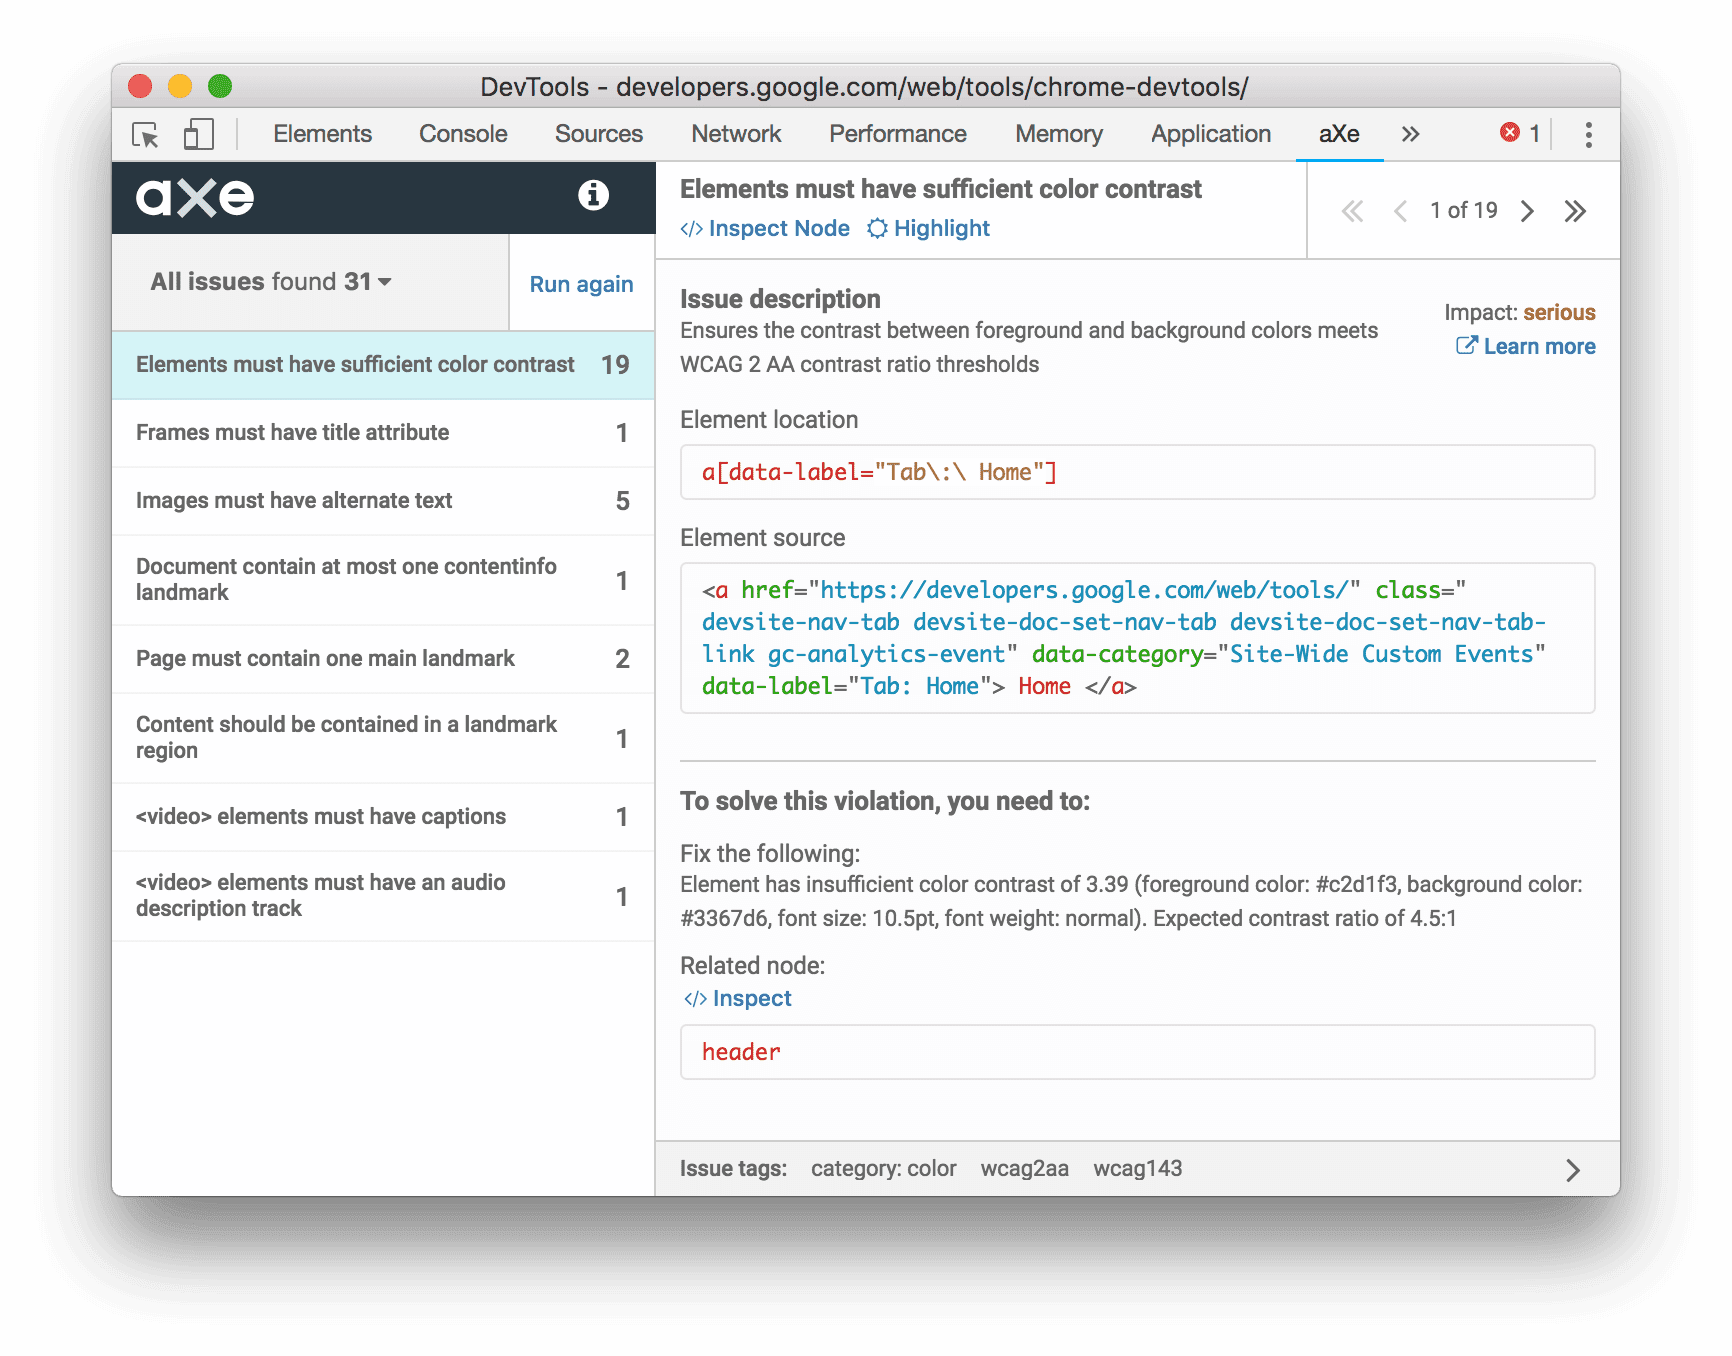
One advantage that the aXe extension has over the Audits panel is that it lets you inspect and highlight failing nodes.
Test content reflow with the Device Toolbar
The Web Content Accessibility Guidelines (WCAG) reflow criterion recommends that web content remain viewable without loss of information even when the viewport is resized or changes orientation. By aligning content to a single column, users who use enlarged text are supported. To test how your content reflows, resize the viewport dynamically with the Device toolbar in the Lighthouse panel.
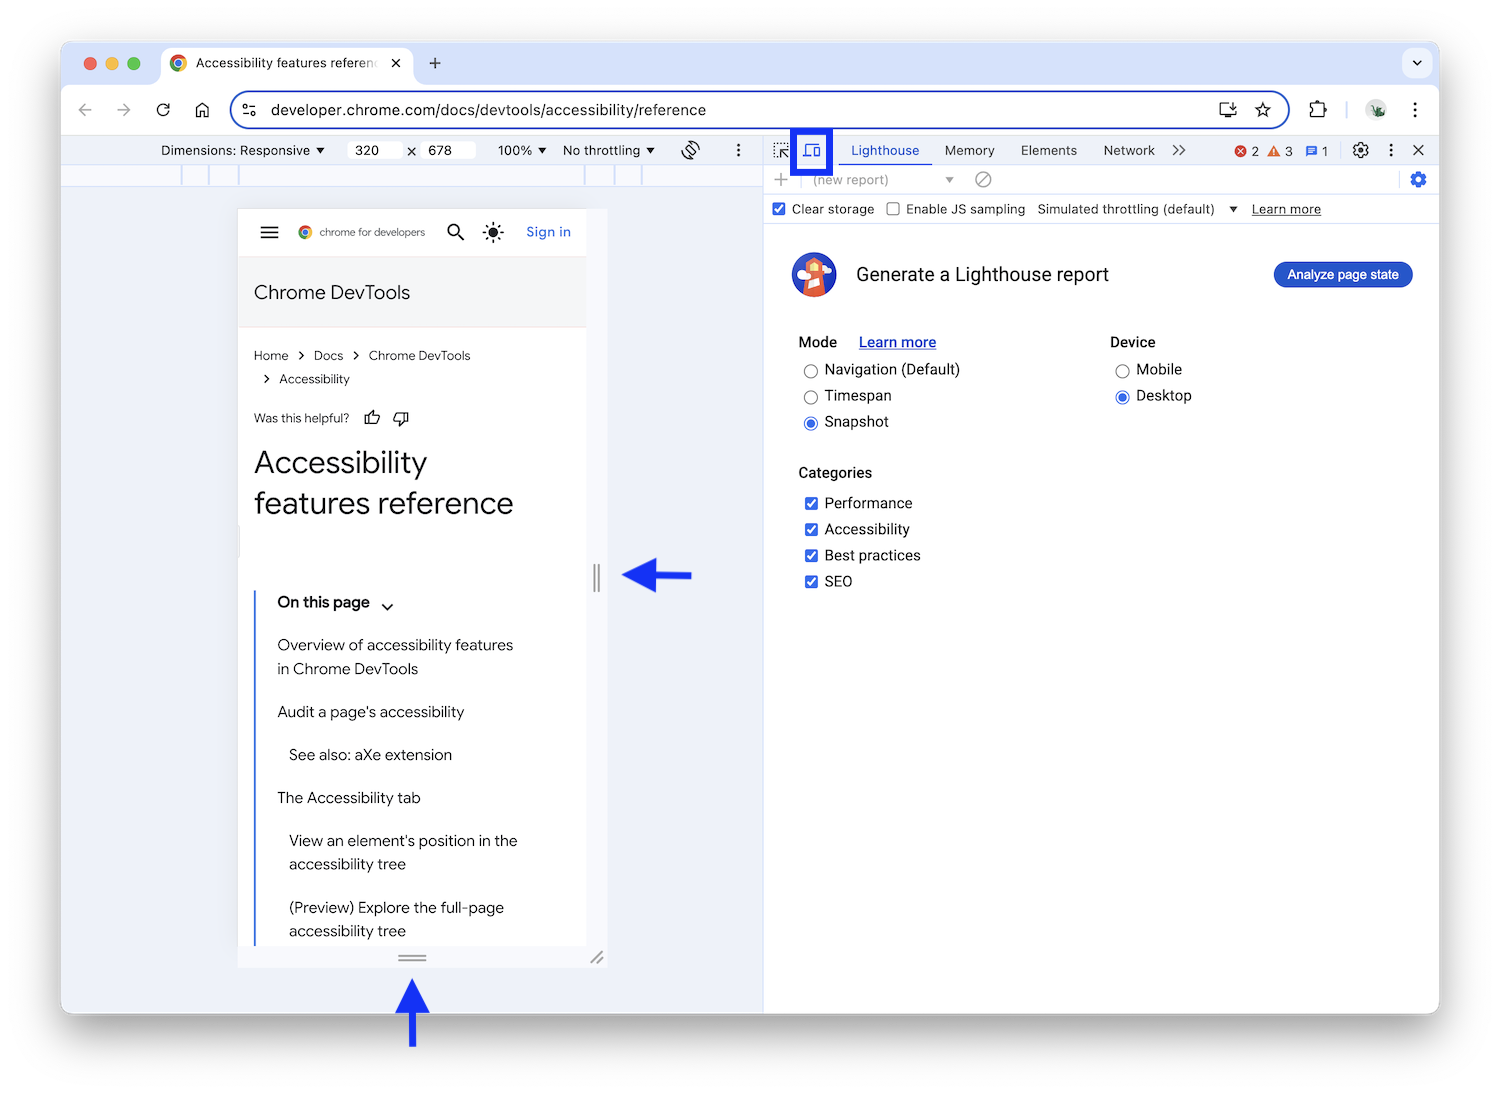
To resize the viewport, drag the handles to whatever dimensions you need. For the specific dimensions to test, see the WCAG reflow success criterion.
The Accessibility tab
The Accessibility tab is where you can view the accessibility tree, ARIA attributes, and computed accessibility properties of DOM nodes.
To open the Accessibility tab:
- Click the Elements panel.
- In the DOM Tree, select the element which you want to inspect.
- Click the Accessibility tab. This tab may be hidden behind the More Tabs keyboard_double_arrow_right button.
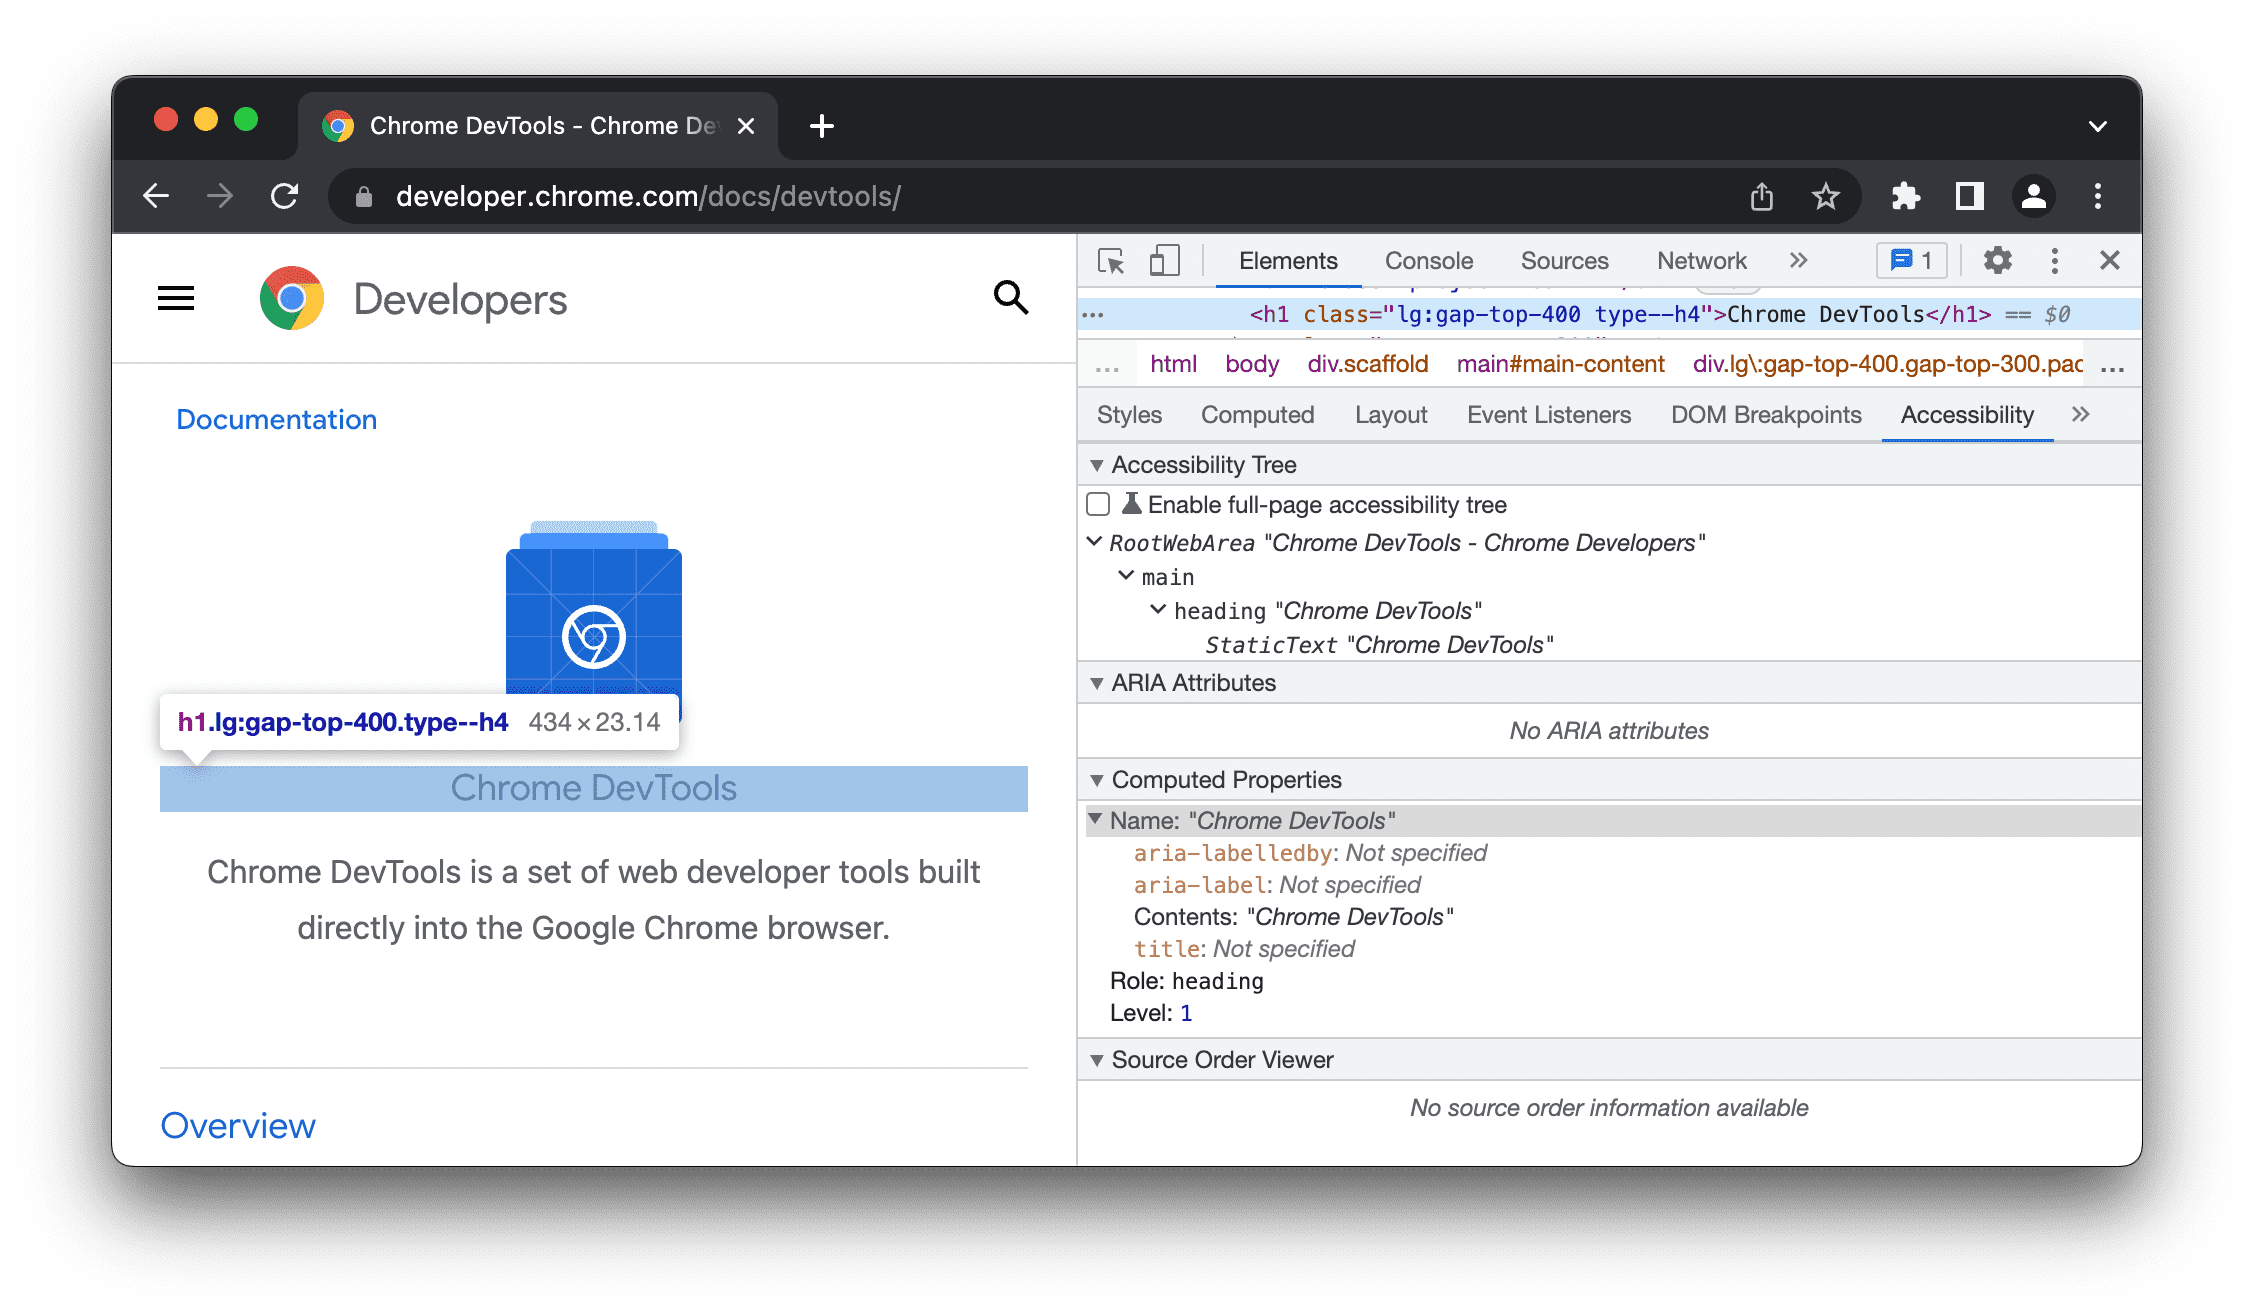
You can drag the Accessibility tab to the front for quicker access in the future.
View an element's position in the accessibility tree
The accessibility tree is a subset of the DOM tree. It only contains elements from the DOM tree that are relevant and useful for displaying the page's contents in a screen reader.
Inspect an element's position in the accessibility tree from the Accessibility tab.
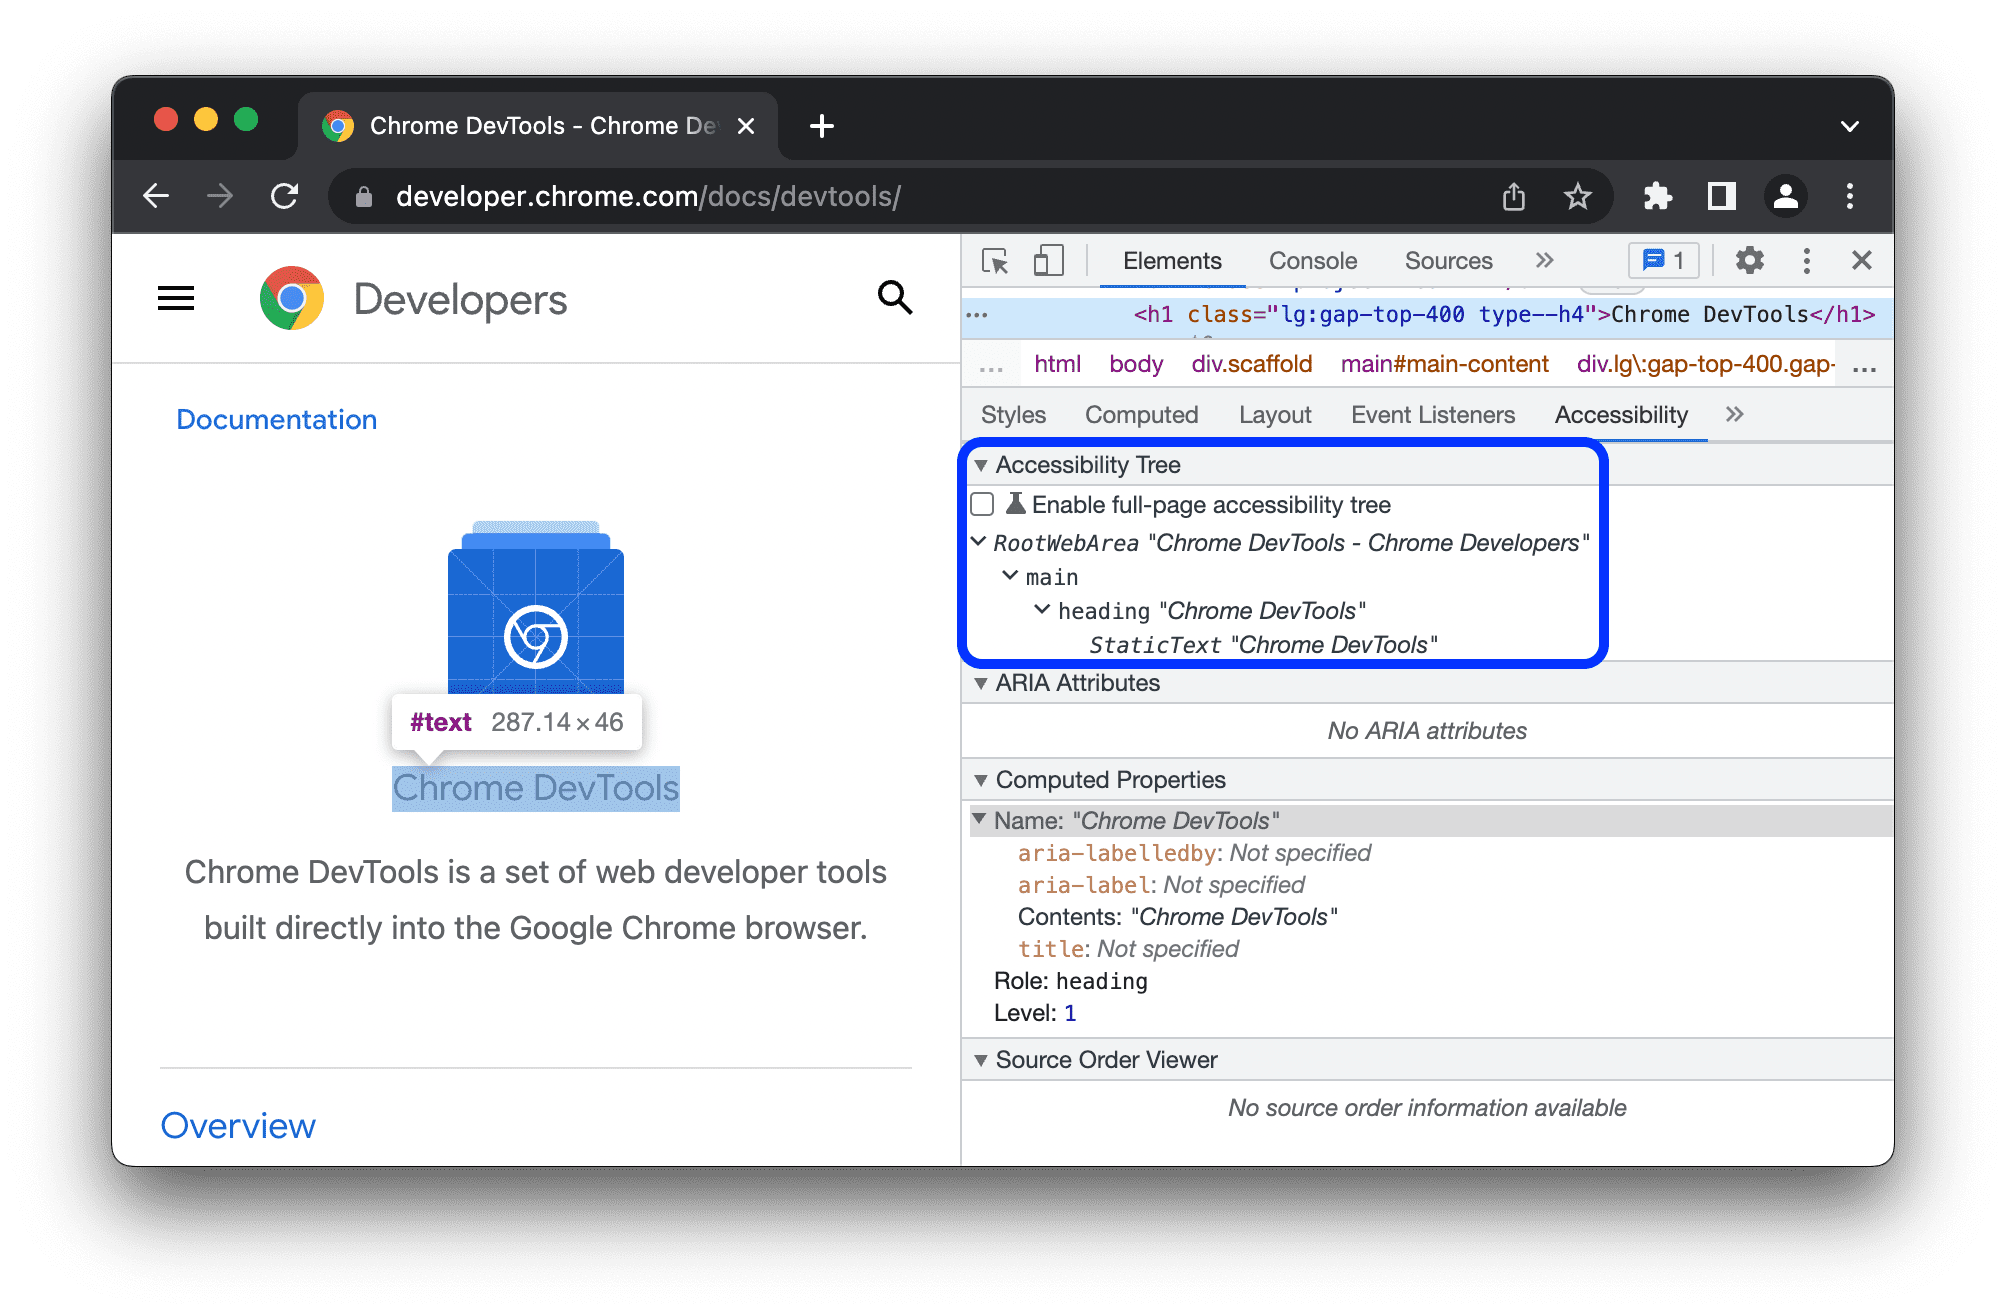
This view lets you explore only a single node and its ancestors. To explore the whole accessibility tree, follow the steps below.
(Preview) Explore the full-page accessibility tree
The full-page view of the accessibility tree lets you explore the whole tree and helps you better understand how your web content is exposed to assistive technology.
To explore the accessibility tree:
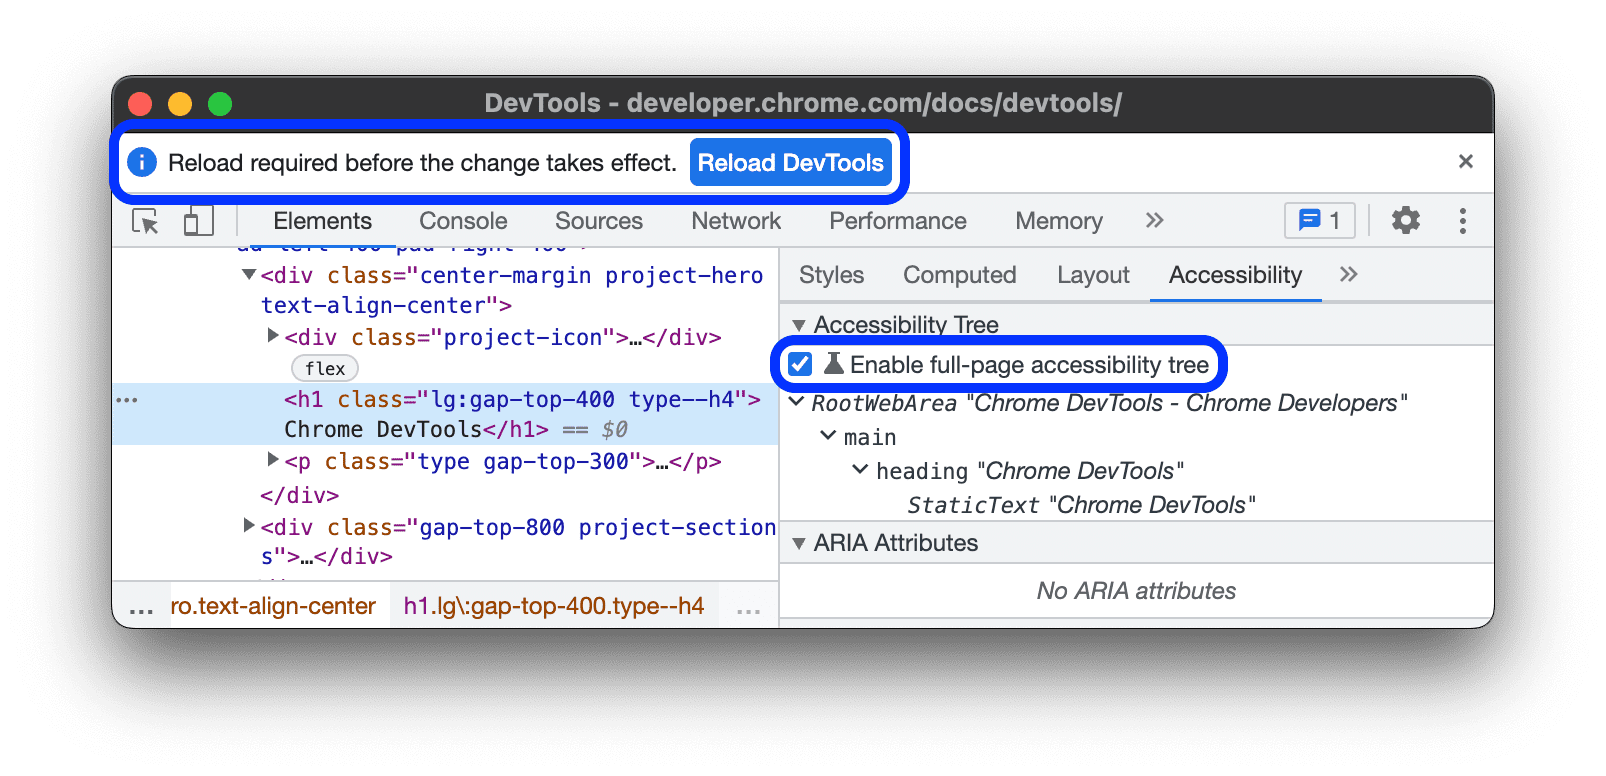
- Check science Enable full-page accessibility tree.
On the action bar at the top, click Reload DevTools.
In the upper right corner of the Elements panel, toggle the accessibility_new Switch to Accessibility Tree view button.
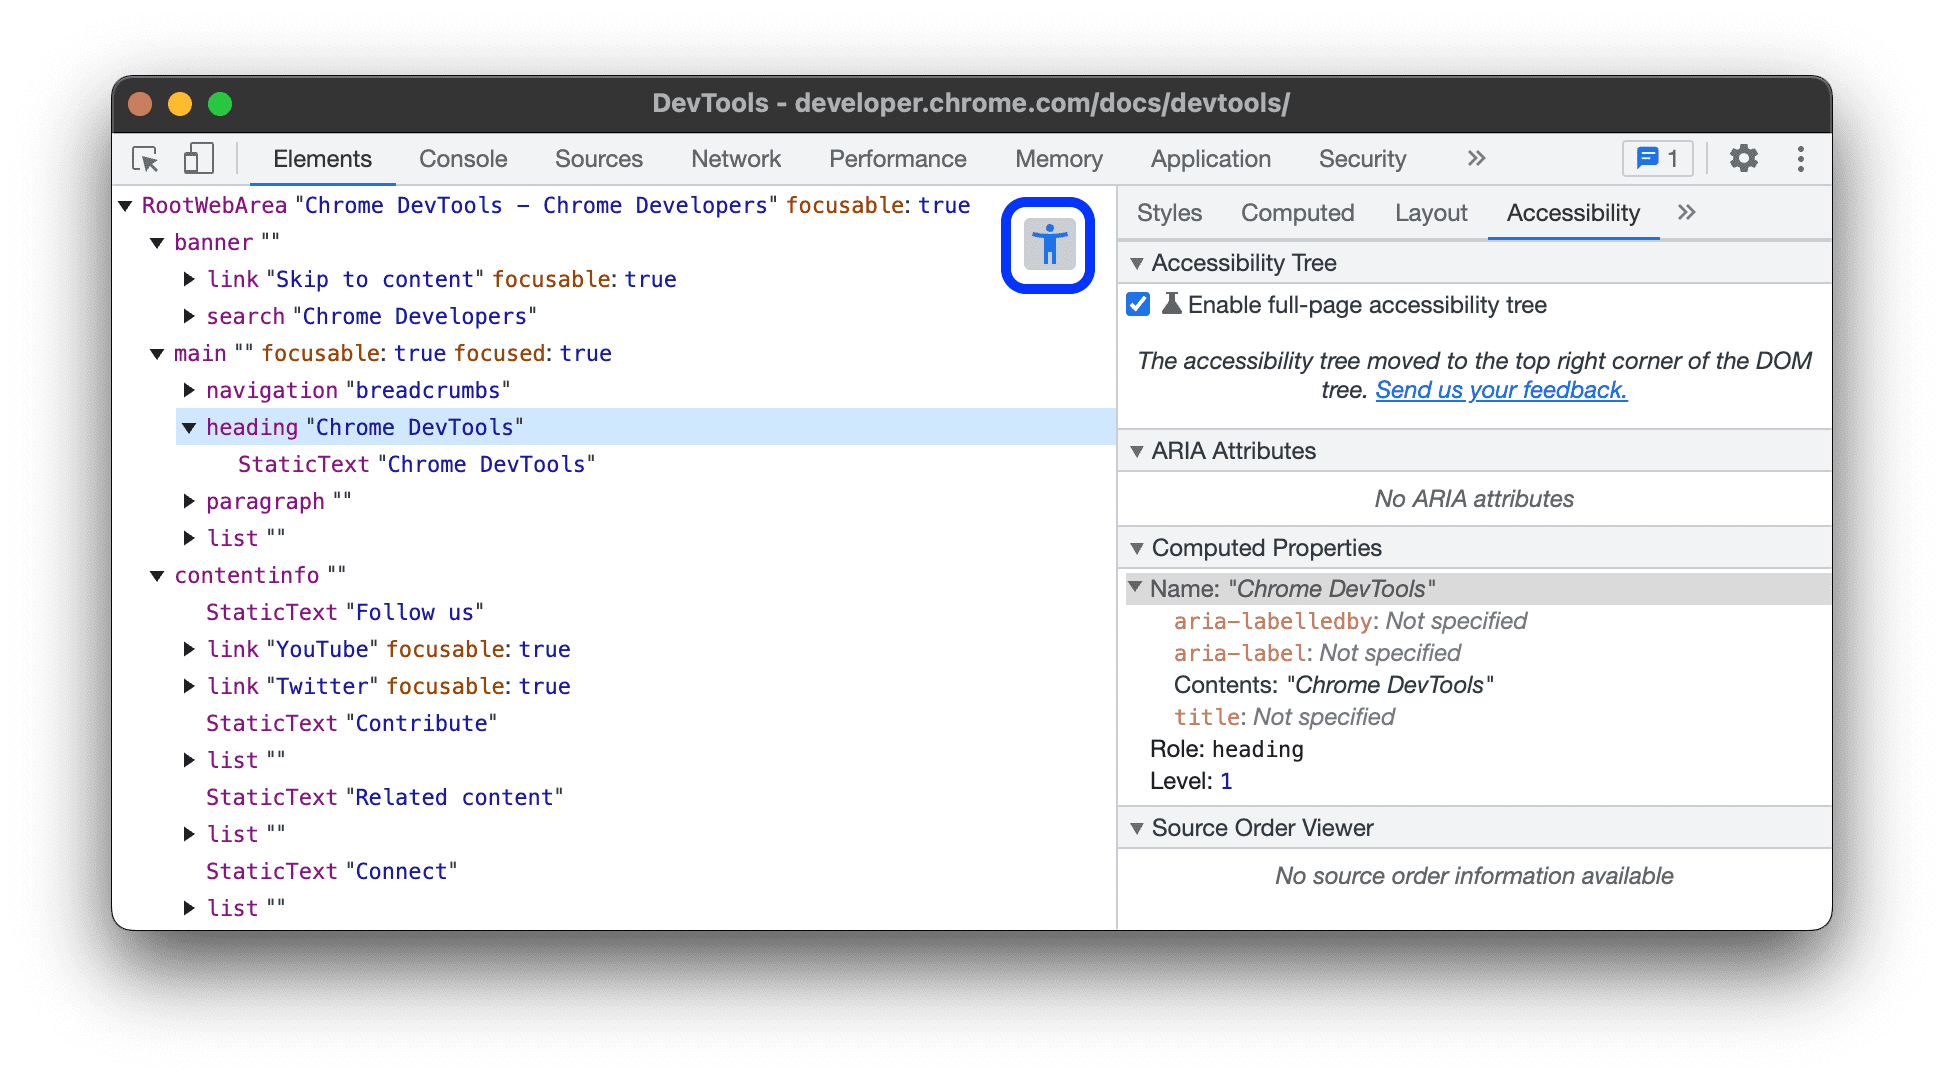
Browse the accessibility tree. You can expand nodes or click to see details under Computed properties.
Select a node and click the accessibility_new Switch to DOM tree view button to toggle back to DOM tree.
The corresponding DOM node is selected now. This is a great way to understand the mapping between the DOM node and its accessibility tree node.
View an element's ARIA attributes
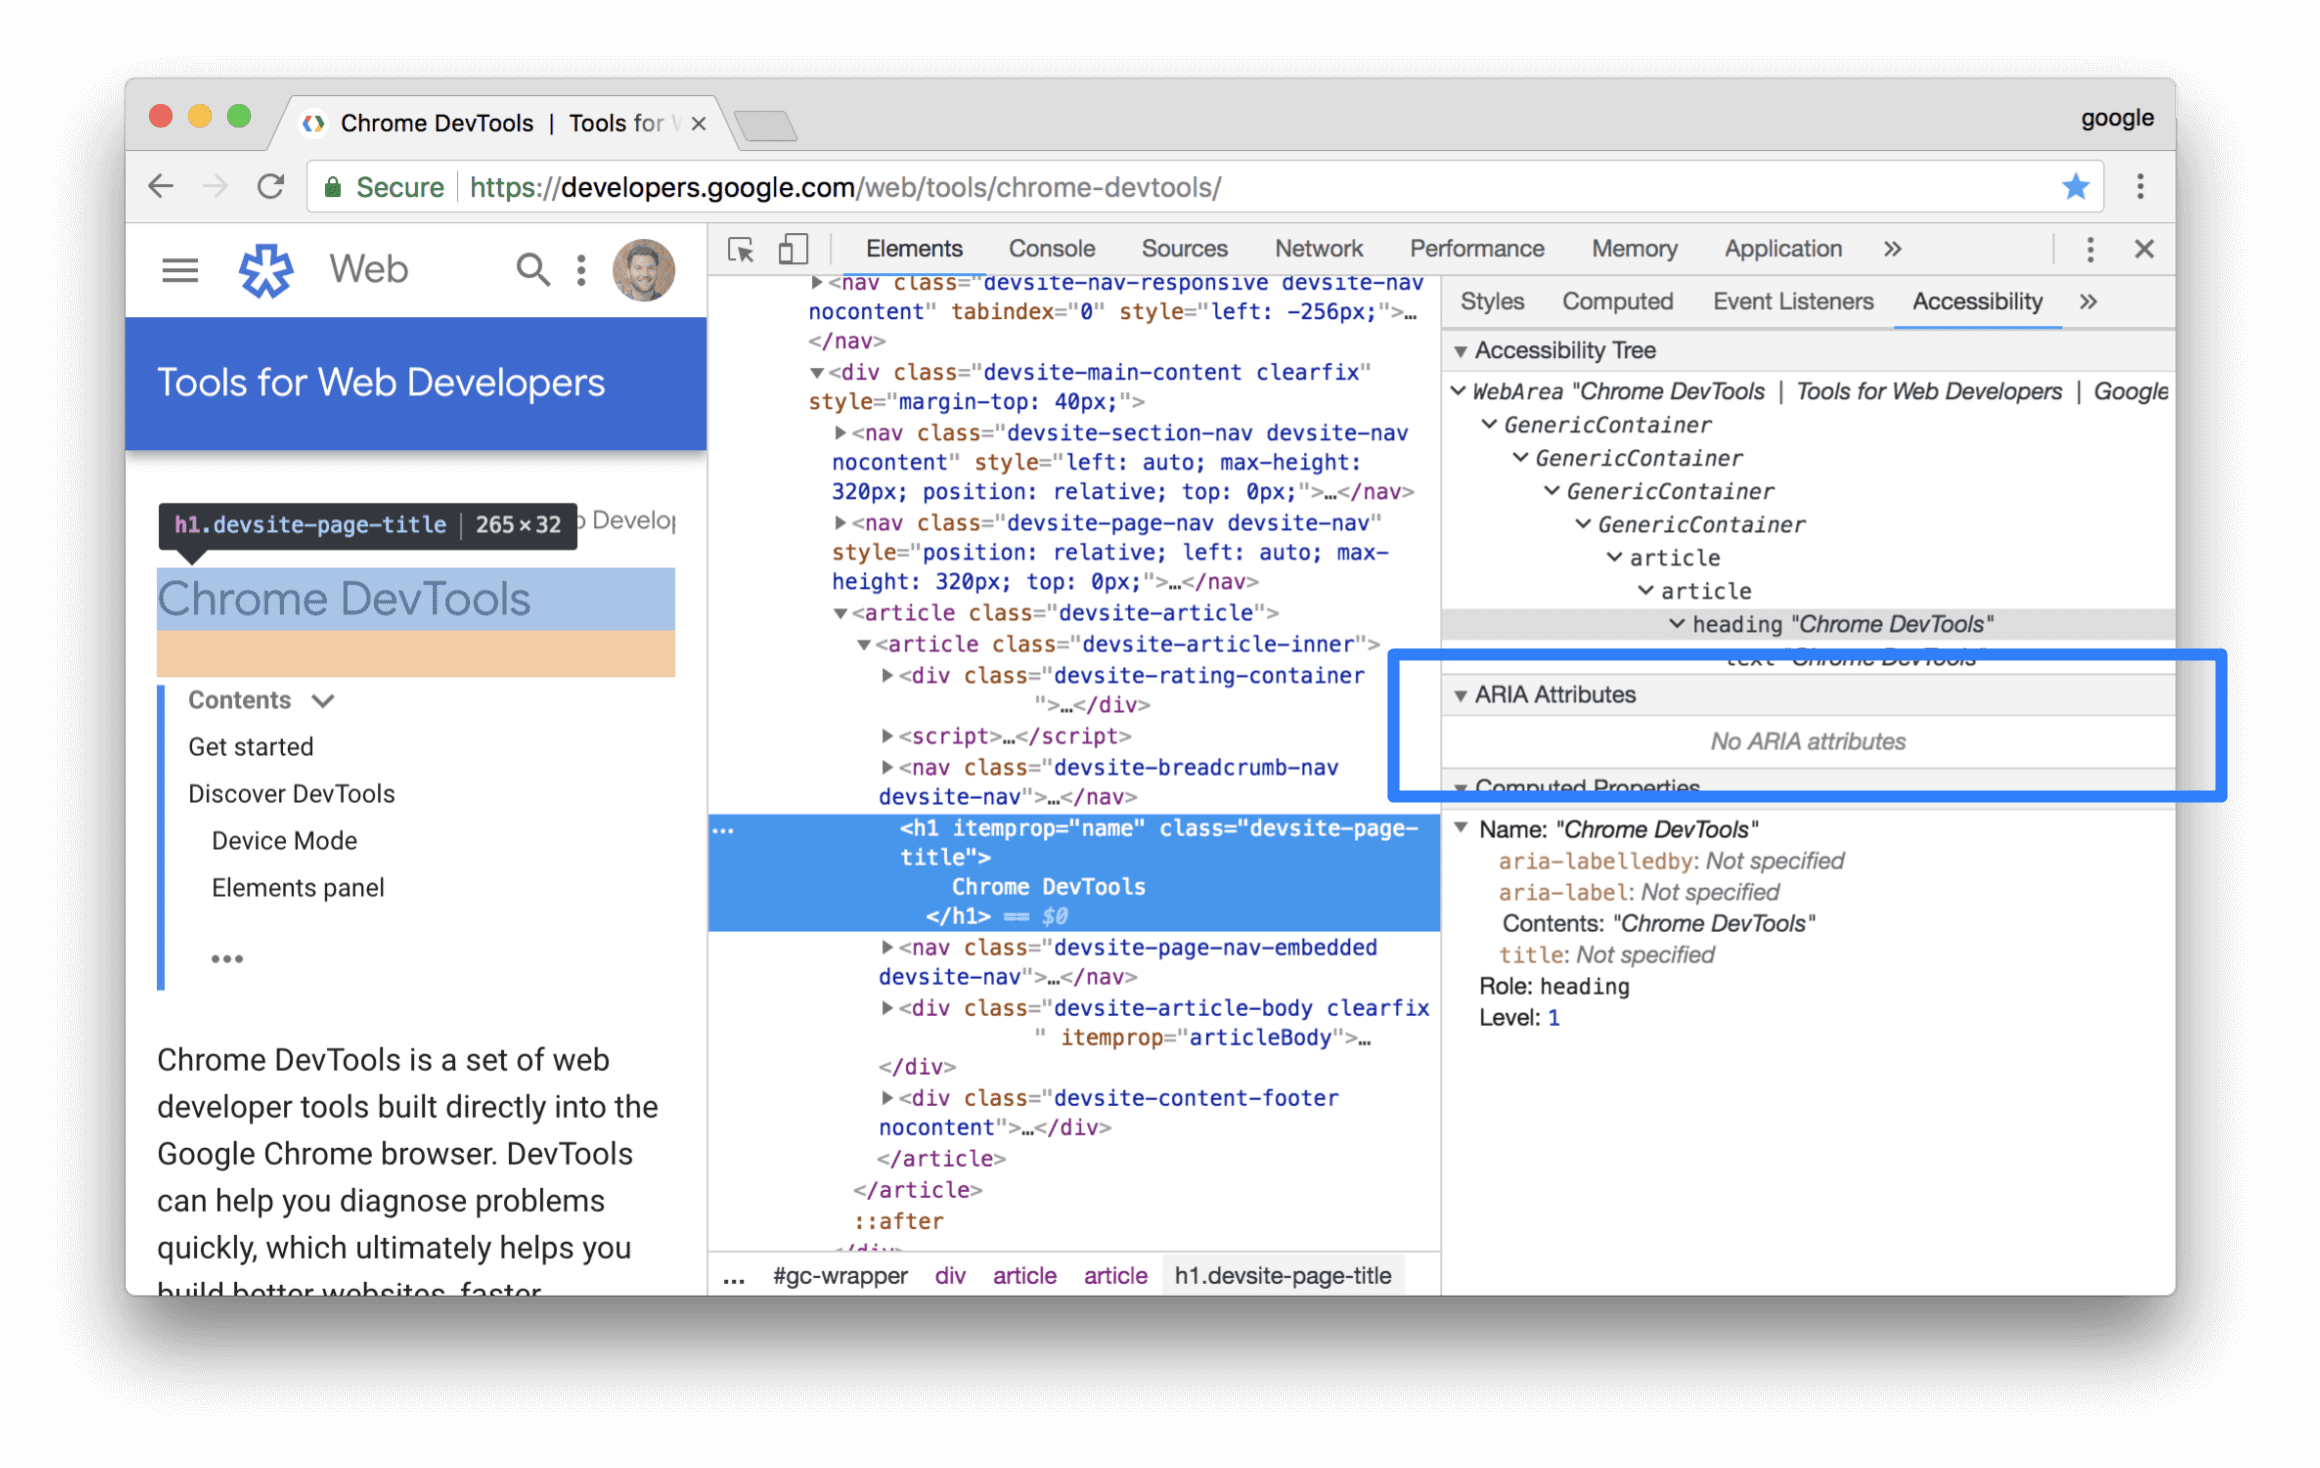
ARIA attributes ensure that screen readers have all of the information that they need in order to properly represent a page's contents.
View an element's ARIA attributes in the Accessibility tab.
View the source order of elements on screen
The elements on the page don't always appear in the order they are in the source. This might confuse users who depend on assistive technology to navigate the web.
To view and debug the source order on your website:
- Inspect an element on the page.
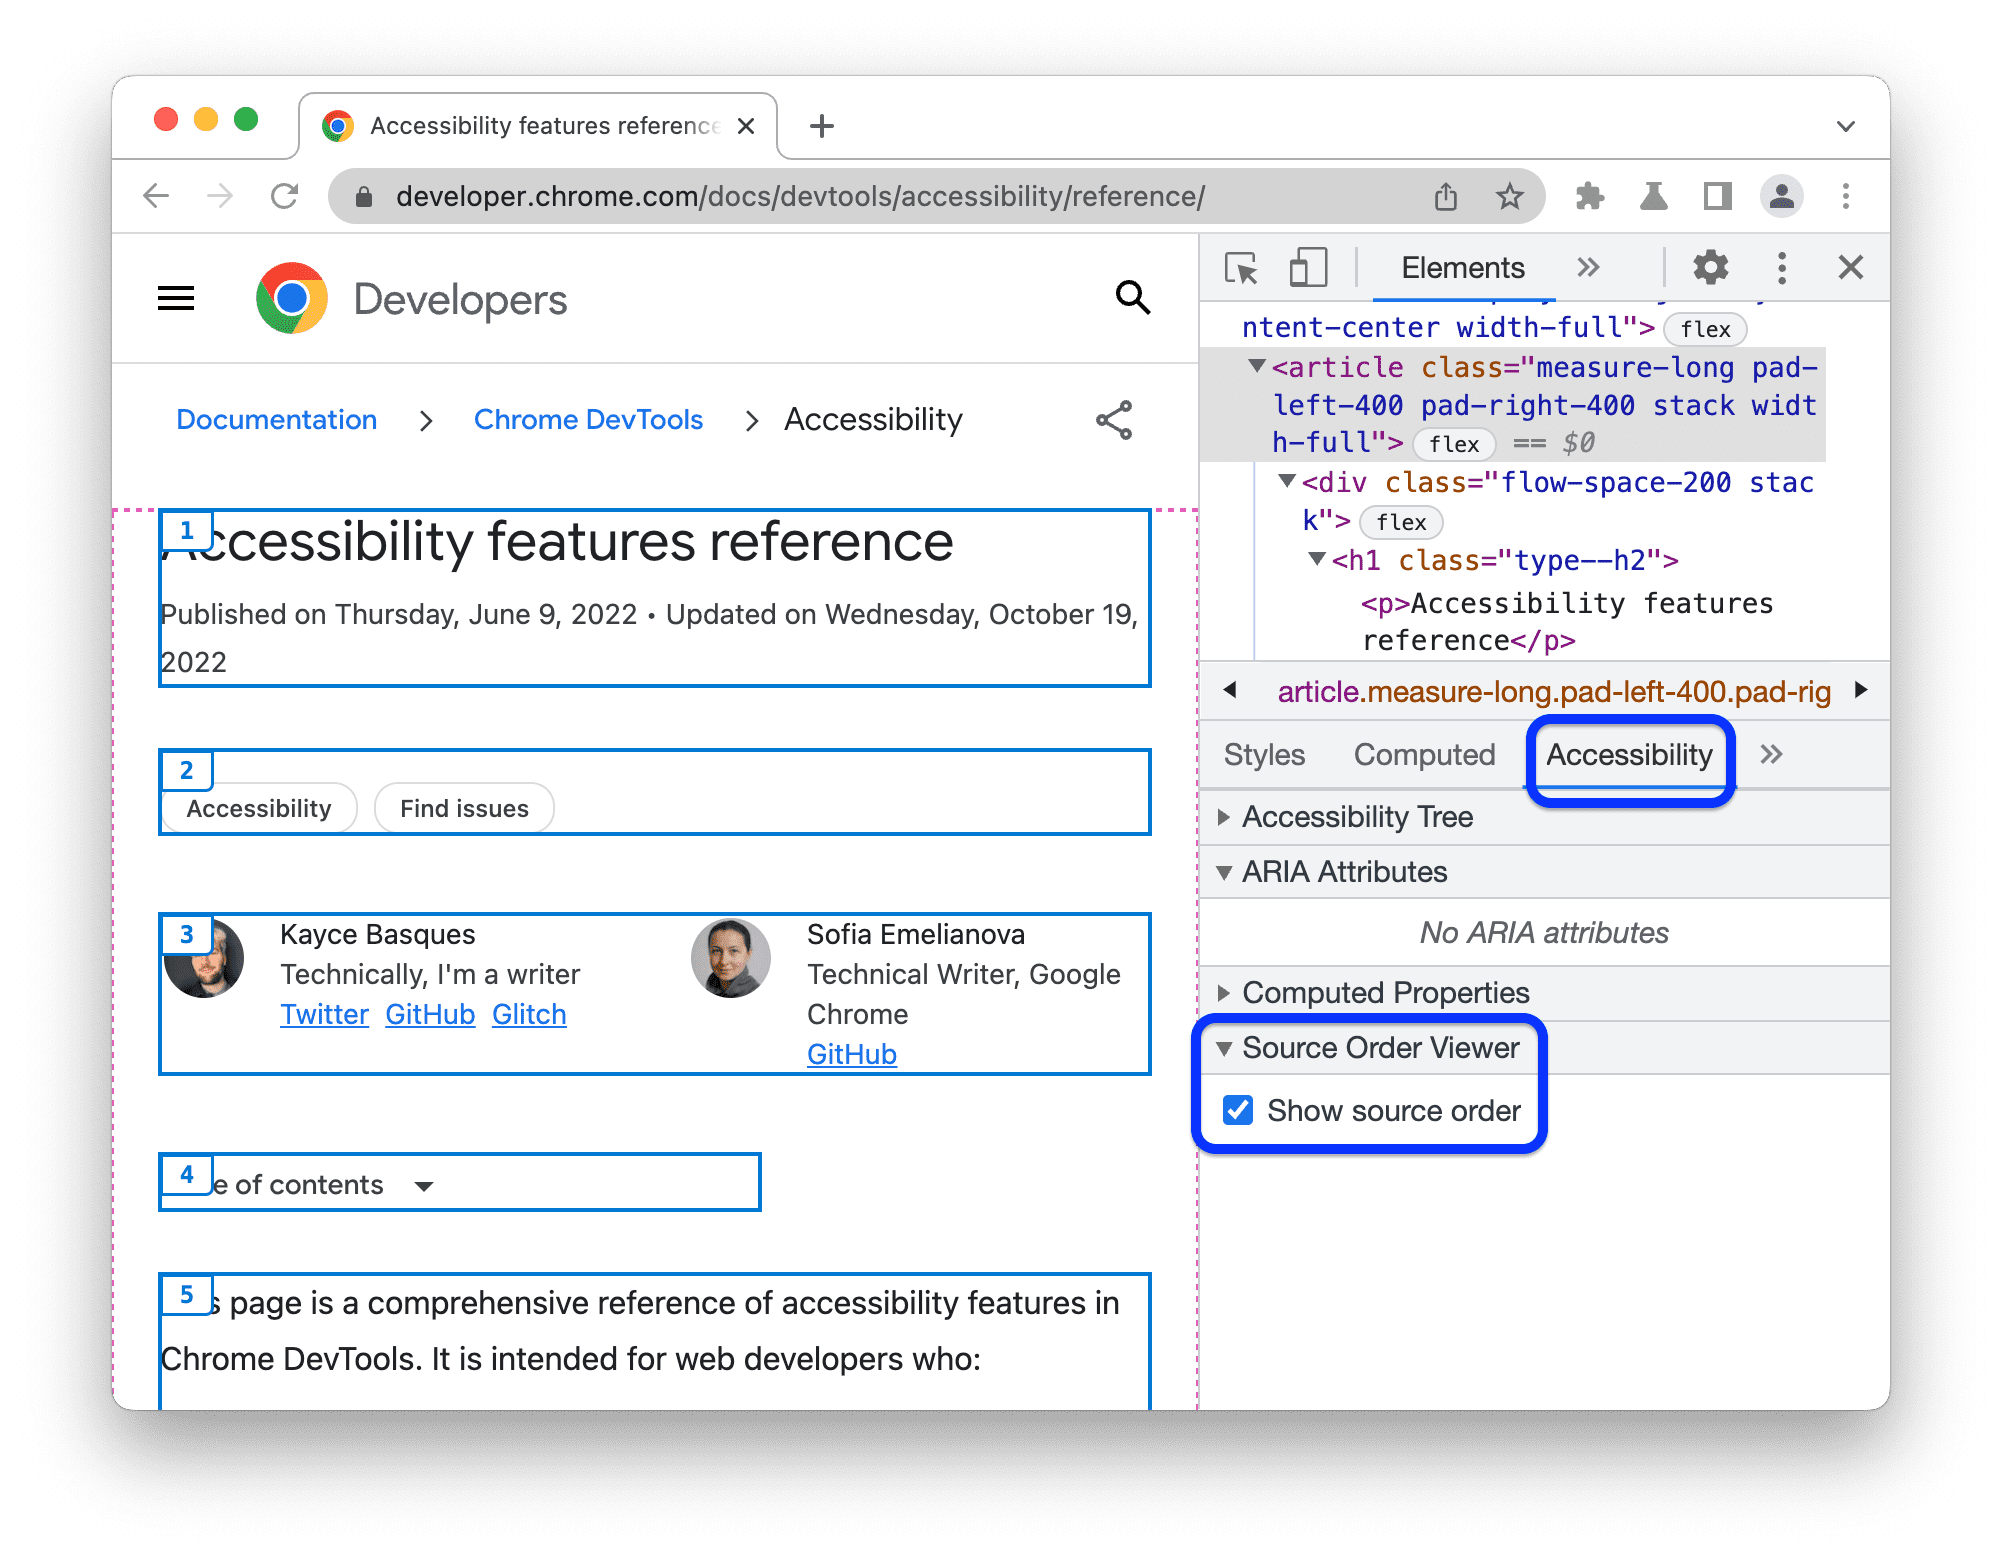
- In Elements > Accessibility > Source Order Viewer, check check_box Show source order.
In the viewport, DevTools outlines nested elements with borders and marks them with numbers corresponding to their source order.
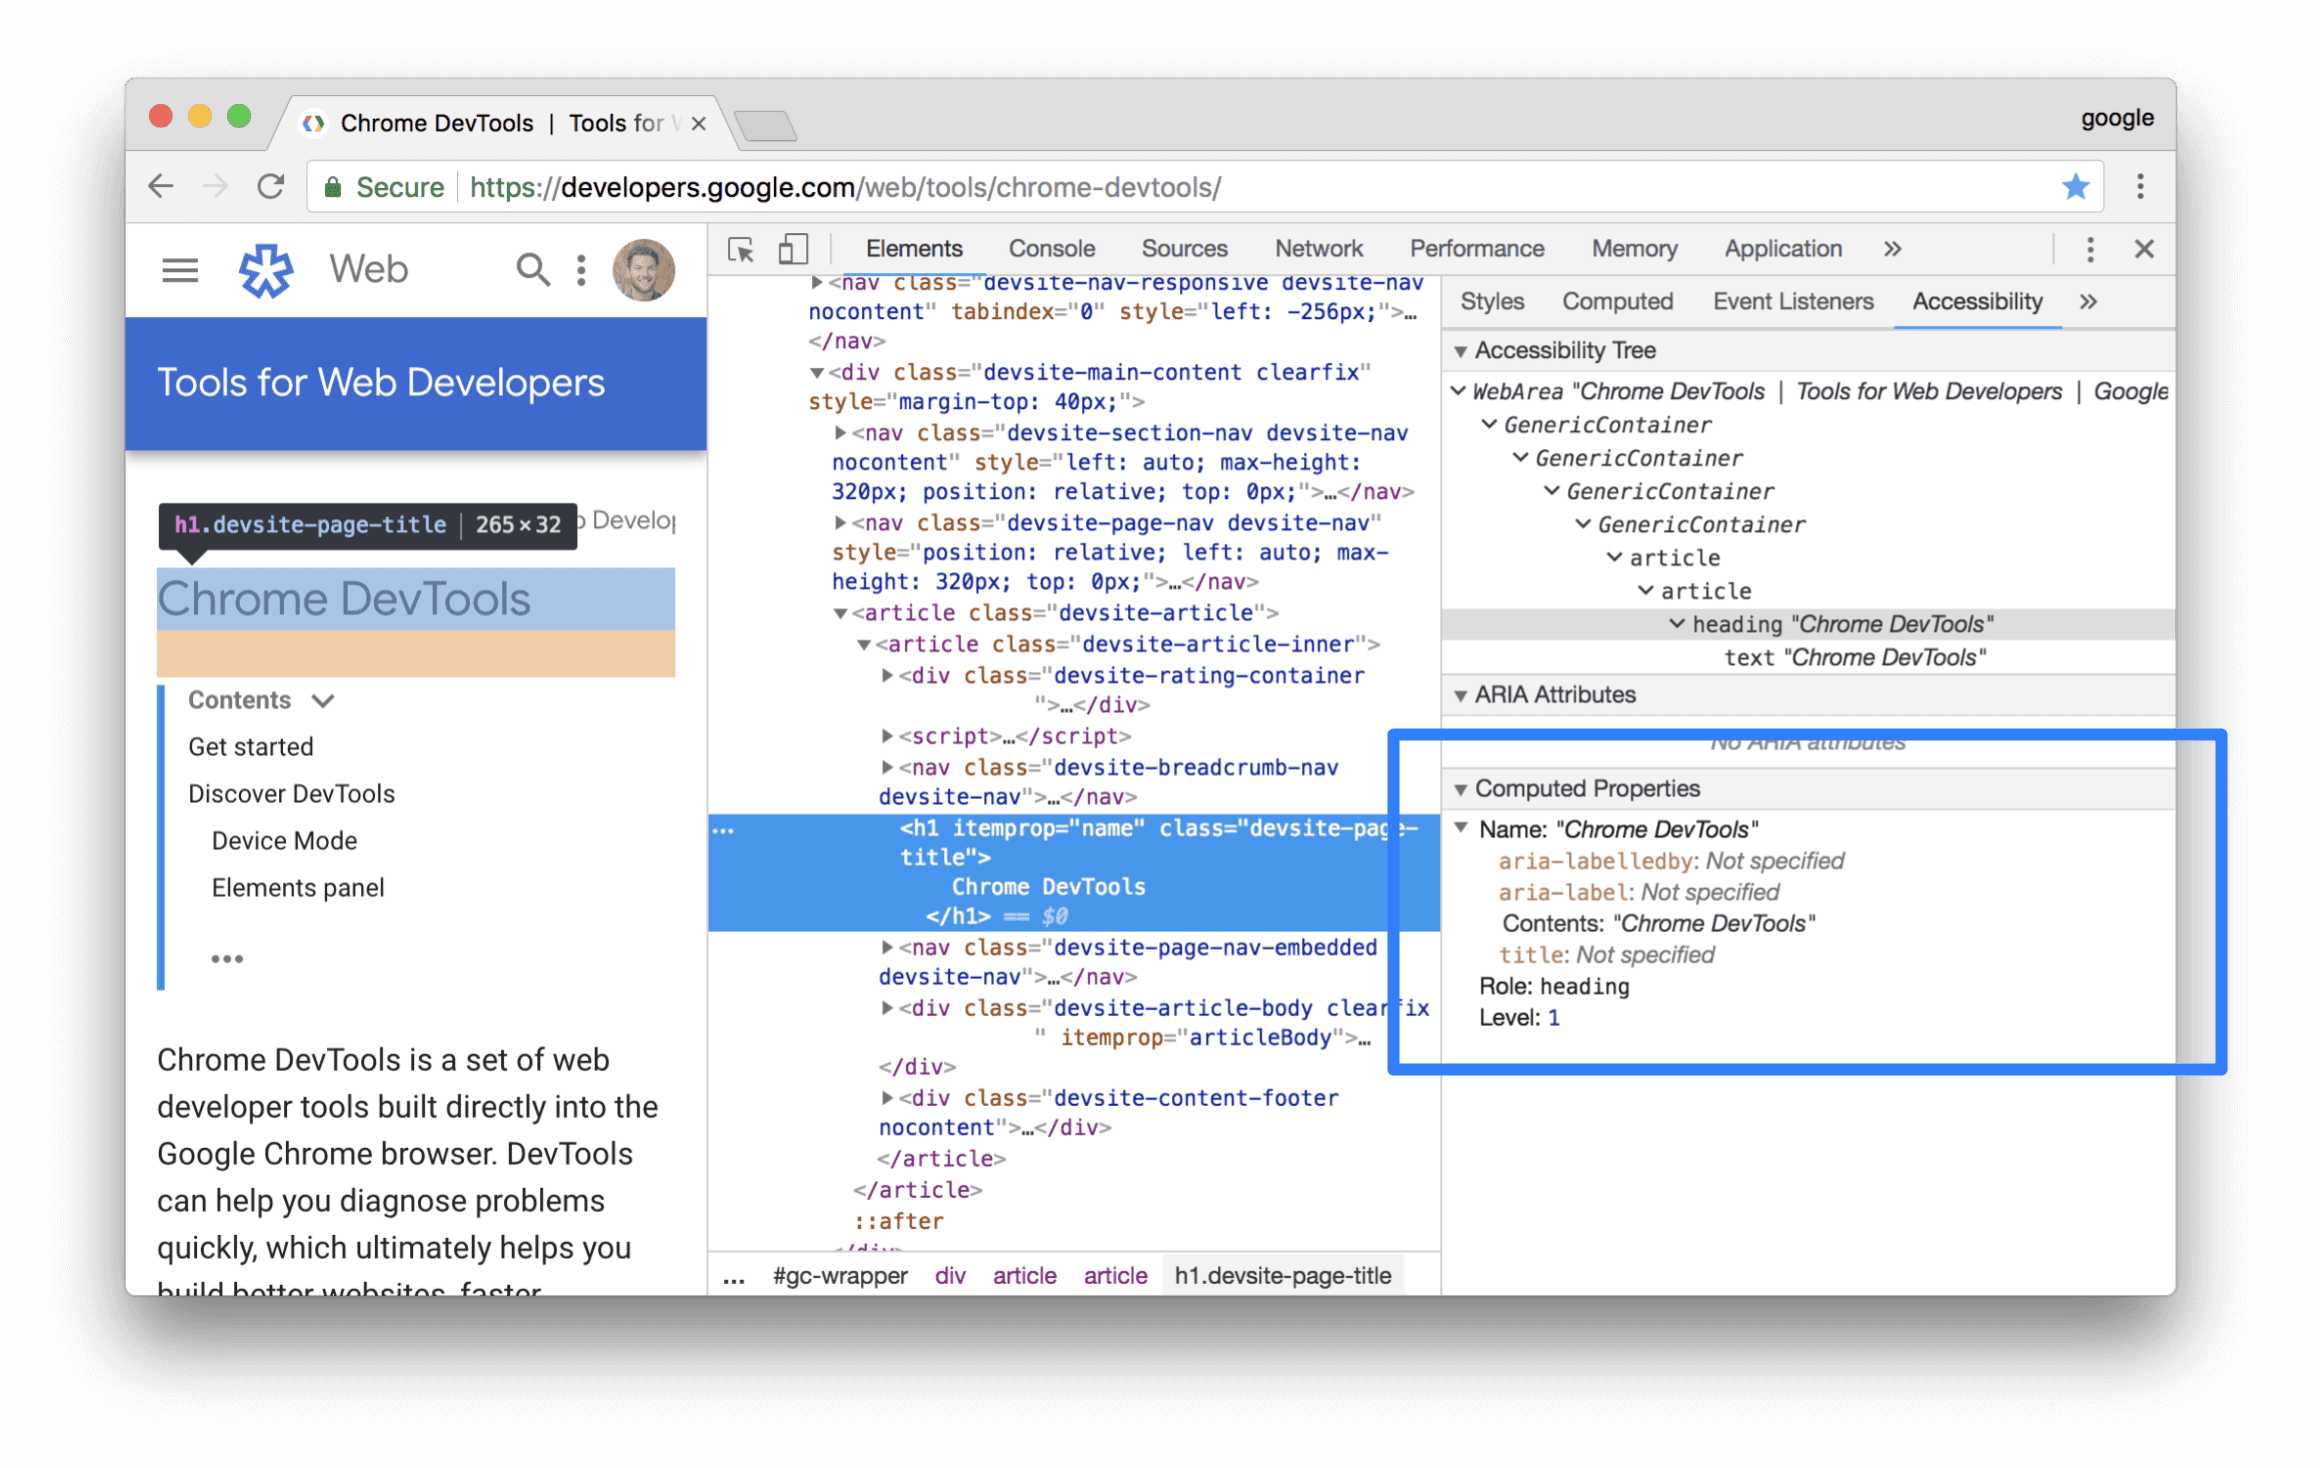
View an element's computed accessibility properties
Some accessibility properties are dynamically calculated by the browser. These properties can be viewed in the Computed Properties section of the Accessibility tab.
View an element's computed accessibility properties in the Accessibility tab.
The Rendering tab
Use the Rendering tab to emulate certain CSS media features without manually specifying them in your code or testing environment. These media features change the appearance of your web page based on the user's device preferences. To test your page's visual accessibility, open the Rendering tab and explore the following options:
- Emulate vision deficiencies to view your page through several different simulated vision deficiencies.
- Emulate CSS media feature
prefers-color-schemeto see what your page looks like with dark or light mode enabled. Many think of dark mode as an aesthetic choice, but Dark mode as an accessibility tool makes a case for its usefulness otherwise. - Emulate CSS media type to see your page in a print or screen media style.
- Emulate CSS media feature
forced-colorsto see how your page looks if the user agent enabled a forced colors mode. - Emulate CSS media feature
prefers-contrastto see your web content with a higher, lower, or specific contrast value. - Emulate CSS media feature
prefers-reduced-motionto view your web content with reduced motion. Some users experience distraction or nausea from animated content. Use this option to see how your page looks without animations or things like smooth-scrolling. - Emulate CSS media feature
prefers-reduced-transparencyto see how your web content appears if the user requests to reduce the transparent or translucent layer effects used on the device.
Discover and fix low-contrast text
DevTools can automatically find low-contrast issues and suggest better colors to help you fix them. See Make your website more readable to learn more.


