What's the User Timing API?
Making your web app fast and responsive is crucial for a good user experience. The first step in improving performance is identifying where time is being spent.
The User Timing API gives you a way to measure your app's JavaScript performance. You do that by inserting API calls in your JavaScript and then extracting detailed timing data that you can use to optimize your code. You can access those data from JavaScript using the API or by viewing them on your Chrome DevTools Timeline Recordings.
Check out the page about the User Timing API for a quick introduction to using it.
How Lighthouse reports User Timing data
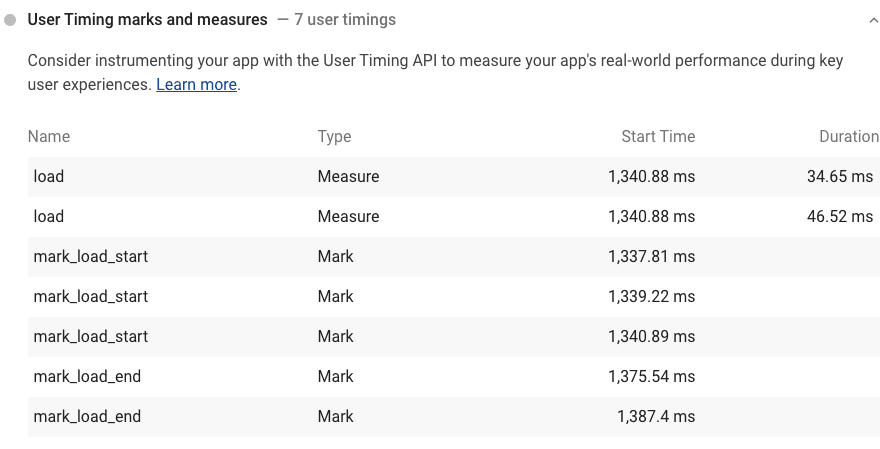
When your app uses the User Timing API to add marks (that is, time stamps) and measures (that is, measurements of the elapsed time between marks), you'll see them in your Lighthouse report:

Lighthouse extracts User Timing data from Chrome's Trace Event Profiling Tool.
This audit is not structured as a pass or fail test. It's just an opportunity to discover a useful API that can help you measure your app's performance.
Stack-specific guidance
React
Use the React DevTools Profiler, which makes use of the Profiler API, to measure the rendering performance of your components.
