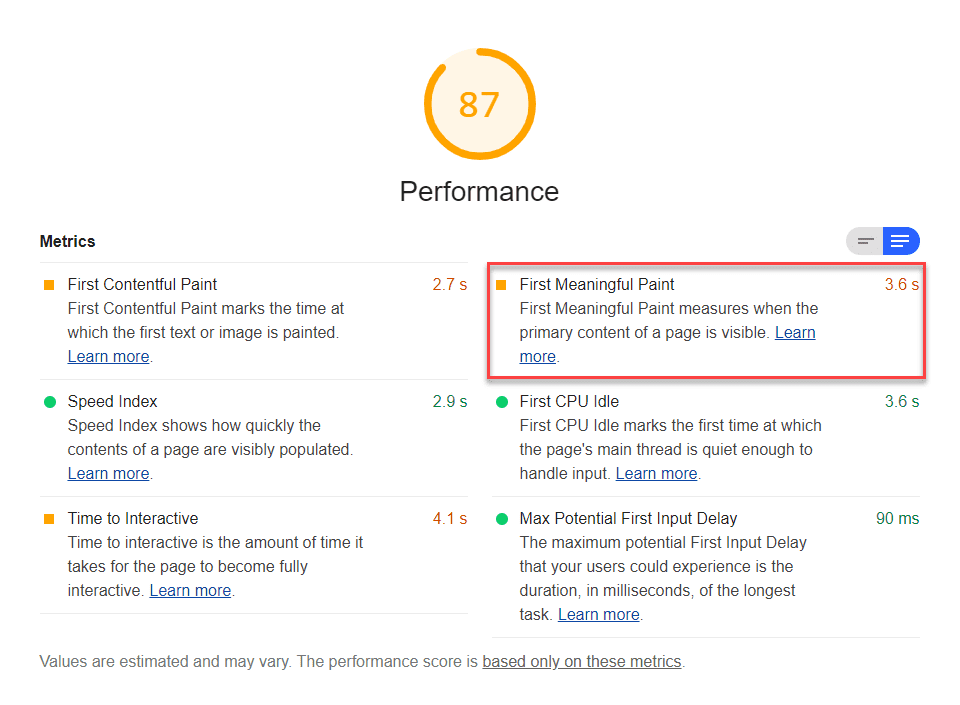
First Meaningful Paint (FMP) is one of six metrics tracked in the Performance section of the Lighthouse report. Each metric captures some aspect of page load speed.
Lighthouse displays FMP in seconds:

What FMP measures
FMP measures when the primary content of a page is visible to the user. The raw score for FMP is the time in seconds between the user initiating the page load and the page rendering the primary above-the-fold content. FMP essentially shows the timing of the paint after which the biggest above-the-fold layout change happens. Learn more about the technical details of FMP in Google's Time to First Meaningful Paint: a layout-based approach.
First Contentful Paint (FCP) and FMP are often the same when the first bit of content rendered on the page includes the content above the fold. However, these metrics can differ when, for example, there's content above the fold within an iframe. FMP registers when the content within the iframe is visible to the user, while FCP doesn't include iframe content.
How Lighthouse determines your FMP score
Just like FCP, FMP is based on real website performance data from the HTTP Archive.
When FMP and FCP are the same, their scores are identical. If FMP occurs after FCP—for example, when a page contains iframe content—the FMP score will be lower than the FCP score.
For example, let's say your FCP is 1.5 seconds, and your FMP is 3 seconds. The FCP score would be 99, but the FMP score would be 75.
This table shows how to interpret your FMP score:
| FMP metric (in seconds) |
Color-coding | FMP score (FCP HTTP Archive percentile) |
|---|---|---|
| 0–2 | Green (fast) | 75–100 |
| 2–4 | Orange (moderate) | 50–74 |
| Over 4 | Red (slow) | 0–49 |
How to improve your FMP score
See How to improve Largest Contentful Paint on your site. The strategies for improving FMP are largely the same as the strategies for improving Largest Contentful Paint.
Tracking FMP on real users' devices
To learn how to measure when FMP actually occurs on your users' devices, see Google's User-centric Performance Metrics page. The Tracking FMP using hero elements section describes how to programmatically access FCP data and submit it to Google Analytics.
See Google's Assessing Loading Performance in Real Life with Navigation and Resource Timing for more on collecting real-user metrics. The User Timing marks and measures Lighthouse audit enables you to see User Timing data in your report.
How to improve your overall Performance score
Unless you have a specific reason for focusing on a particular metric, it's usually better to focus on improving your overall Performance score.
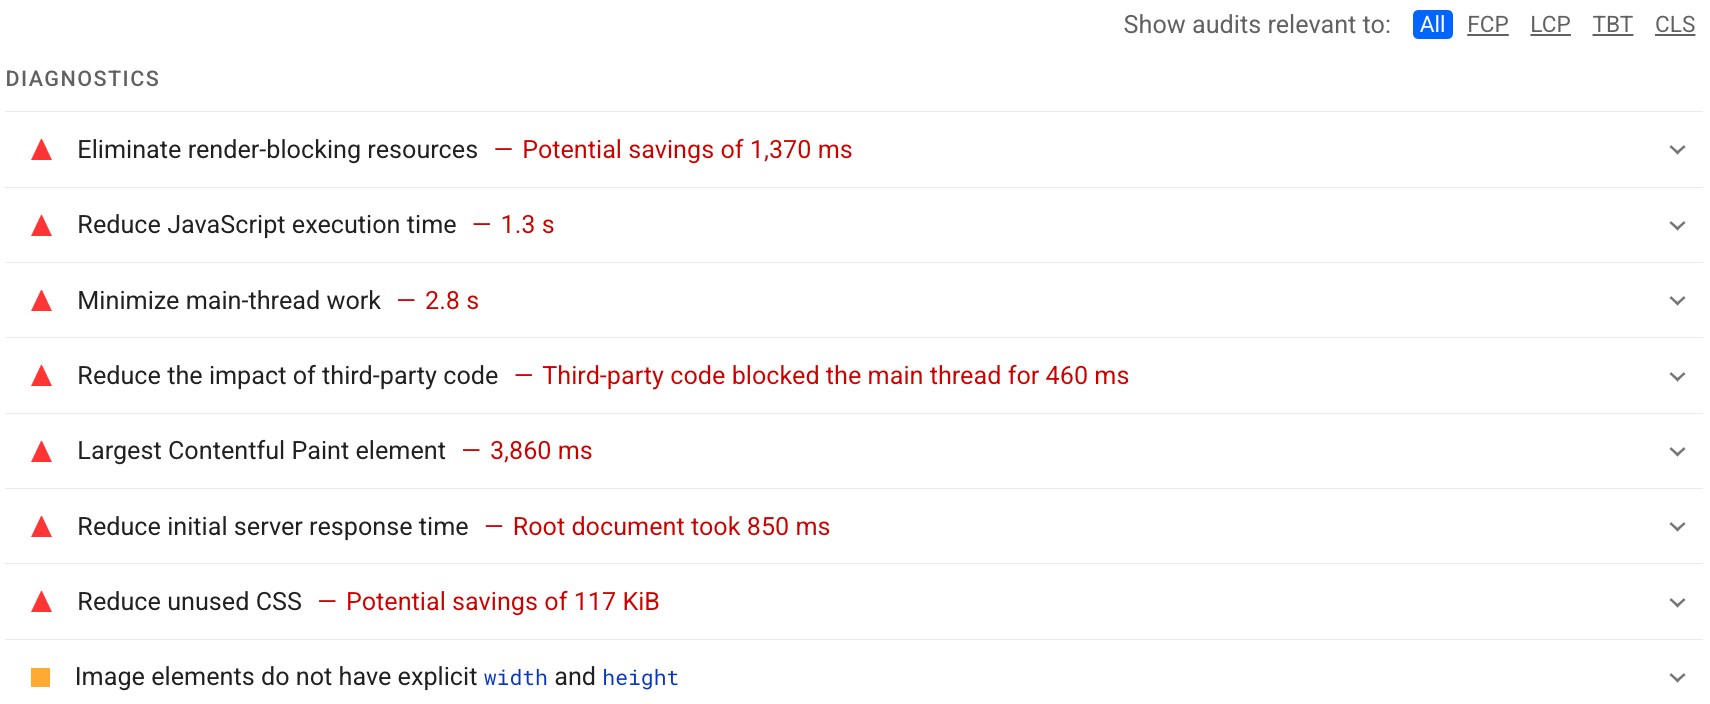
Use the Diagnostics section of your Lighthouse report to determine which improvements will have the most value for your page. The more significant the opportunity, the greater the effect it will have on your Performance score. For example, the following Lighthouse screenshot shows that eliminating render-blocking resources will yield the biggest improvement:

See the Performance audits to learn how to address the opportunities identified in your Lighthouse report.
