Let’s admit it, writing automated tests is not the most fun thing in a developer’s life. As developers, we want to write features, fix bugs, and improve the world! However, when we don’t have automated testing in our workflows, in the long term, things can get quite “buggy”. So, we also think that writing automated tests is important.
With the Recorder panel in Chrome DevTools, you can record and replay user flows, export them to various formats (for example, test scripts) through different third-party extensions and libraries, customize the user flows with Puppeteer Replay library, and integrate them with your existing workflows.
In this blog post, we’re going to discuss:
- How to export and replay user flows programmatically.
- How to customize your user flows with the help of Puppeteer Replay.
- How to integrate with your CI/CD workflows.
This blog post assumes you already know the basics of Recorder. If you are new to Recorder, follow this short introductory tutorial and video guide to get started.
Export user flows and replay programmatically
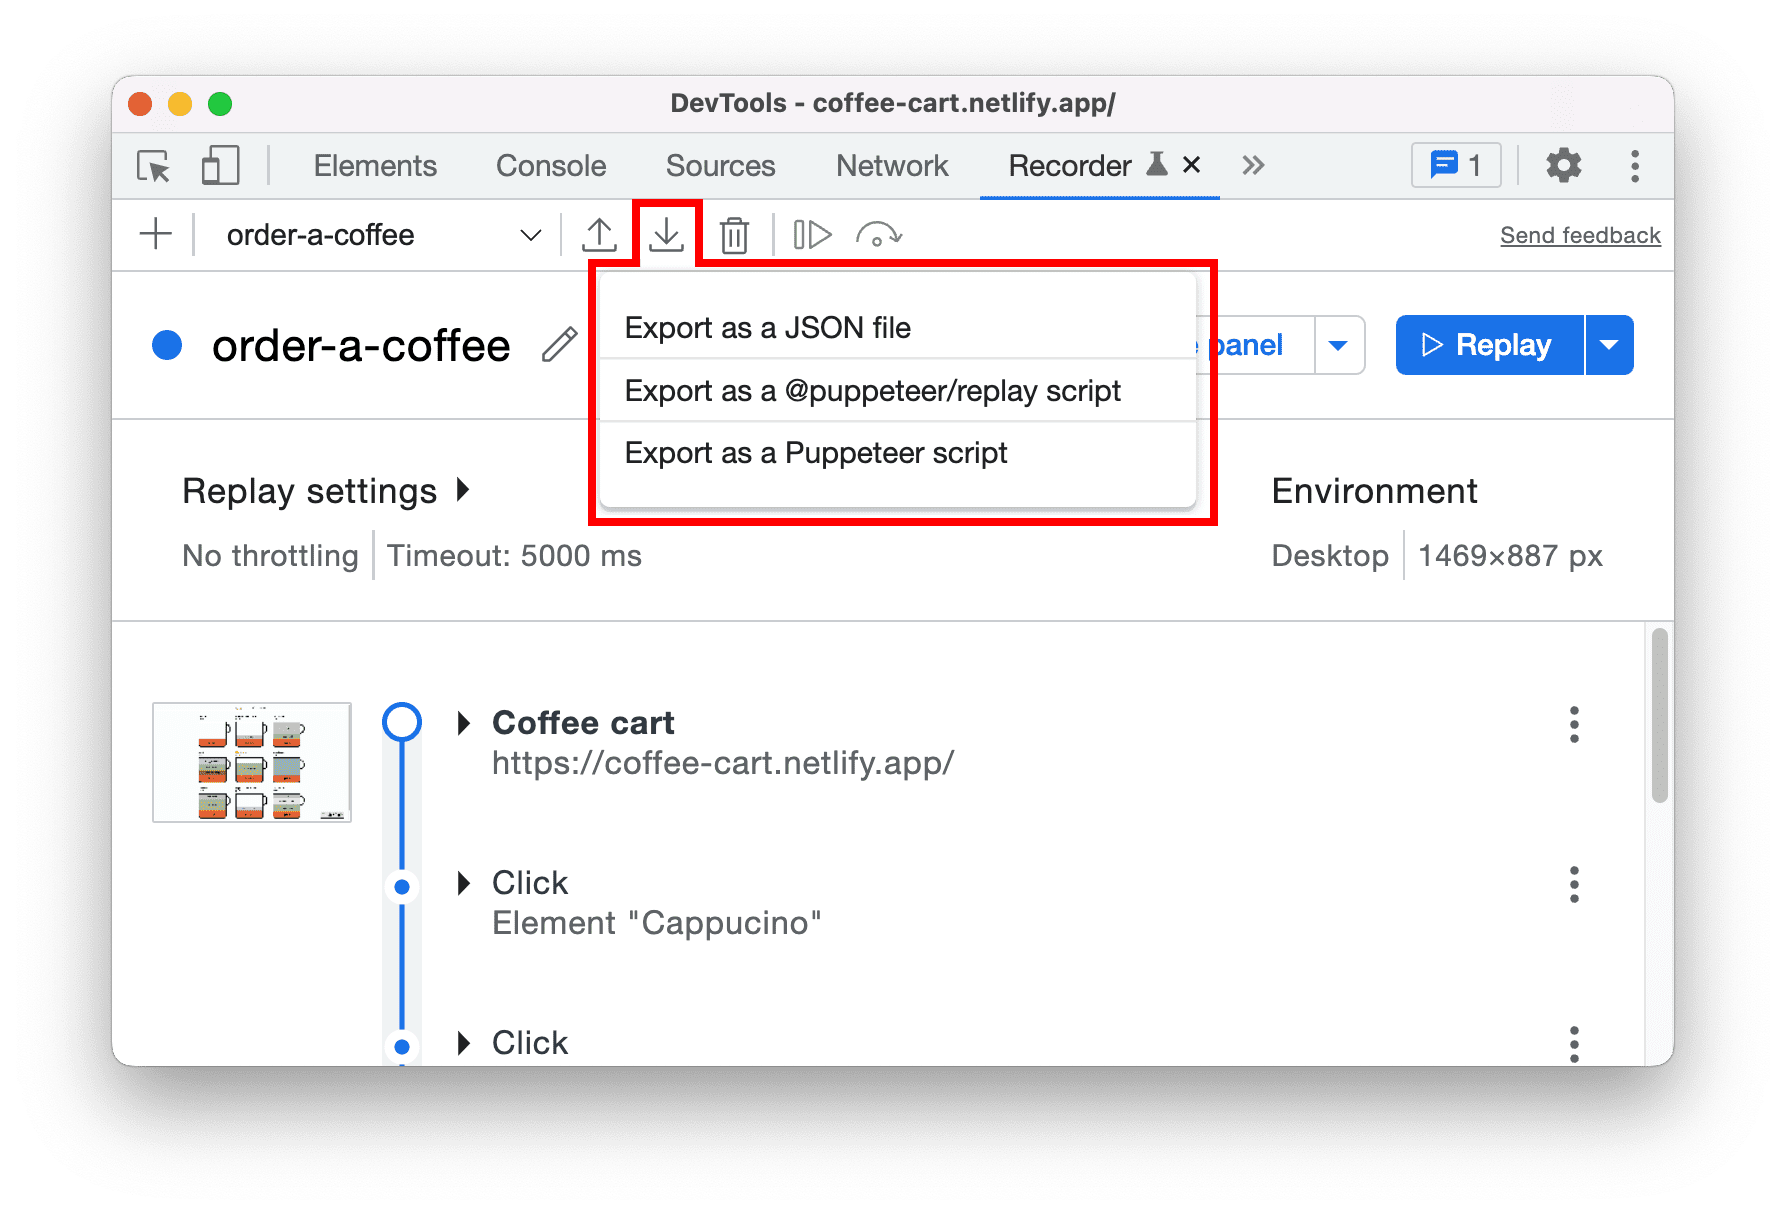
By default, the Recorder gives you the ability to export these recordings as a Puppeteer or Puppeteer Replay script, or as a plain JSON file.

Once you export the user flows as JSON files, you have the option to import it back to the Recorder panel and replay it, or to use external libraries to replay it. Puppeteer Replay library is one of the libraries available.
Replay with Puppeteer Replay
Follow the instructions on the repository to install Puppeteer Replay.
Let’s say you save your JSON user flows in the recordings folder (for example, demo project), you can use the following command to execute one or more user flows:
# replay one user flow
npx @puppeteer/replay ./recordings/order-a-coffee.json

# replay all user flows under recordings folder
npx @puppeteer/replay ./recordings/*.json
Optionally, you can add an npm script for running the recordings; add this line to the scripts field in the package.json:
"replay-all": "replay recordings"
With that, you can run npm run replay-all in the command line to replay all recordings.
User flows replay without UI by default (also known as headless mode). If you would like to see the UI, set the PUPPETEER_HEADLESS environment variable to false before running the command.
PUPPETEER_HEADLESS=false npm run replay-all
Replay with third-party libraries
There are some third-party libraries you can use to replay beyond the Chrome browser. Here is the full list of libraries.
For example, TestCafe is an end-to-end testing framework. It supports replaying JSON user flows with Safari and more!
npm install -g testcafe

# replay with selected browsers
testcafe safari ./recordings/order-one-coffee.json
testcafe firefox ./recordings/order-one-coffee.json
testcafe chrome ./recordings/order-one-coffee.json

# replay with all browsers
testcafe all ./recordings/order-one-coffee.json
On the other hand, Saucelabs is a cloud-based test platform. It supports replaying JSON user flows with different browsers and versions on the cloud.
Here is an example configuration file in Saucelabs. Check out the demo repository.
apiVersion: v1alpha
kind: puppeteer-replay
suites:
  - name: "order a coffee"
    recordings: [ "recordings/order-a-coffee.json" ]
…
Export user flows with different extensions
Apart from the default options, you can also install extensions to export user flows to different formats.

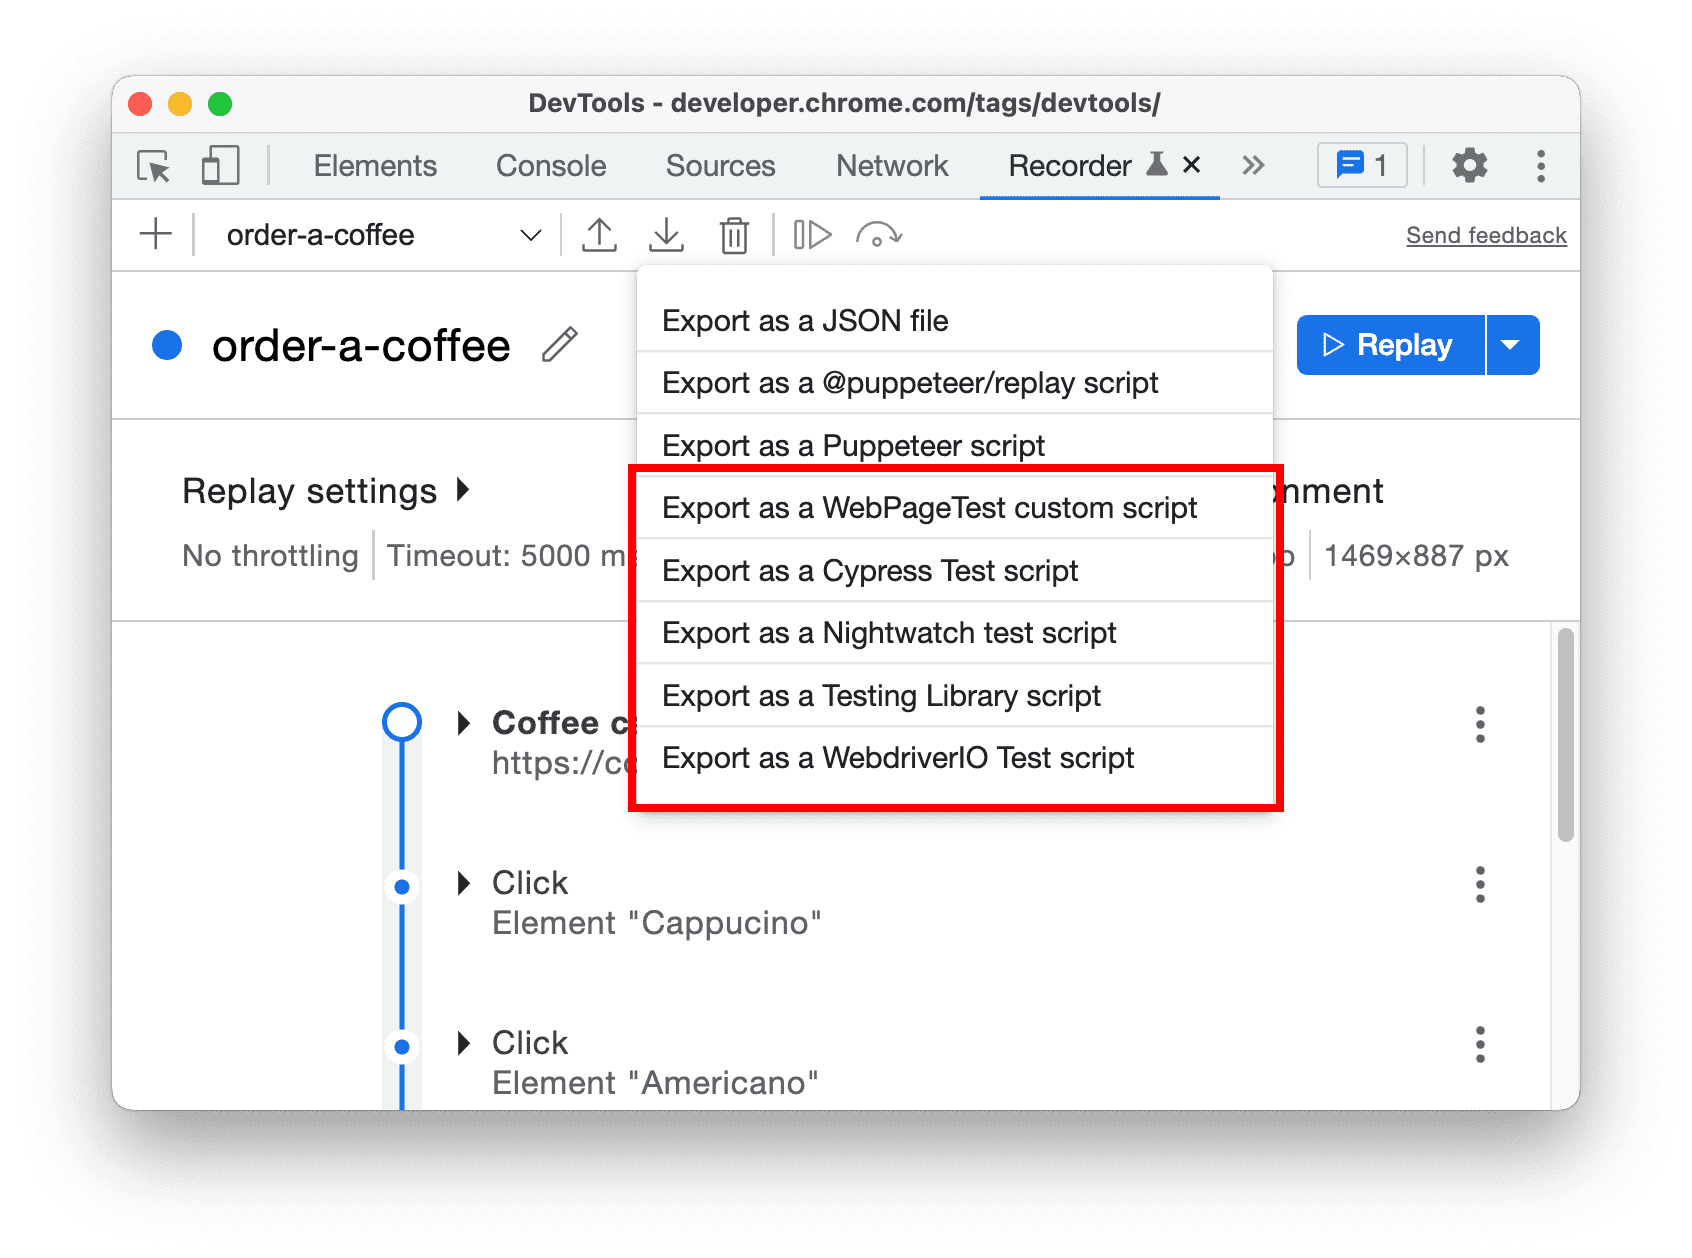
For example, you can record and export the user flows as WebPageTest custom script. With the script, you can test the performance of multi-step user flows through your applications. Writing those scripts, however, can sometimes be challenging.
Additionally, if you already have testing tools in place, there are extensions to export user flows to different test scripts such as Cypress, Nightwatch, WebdriverIO, Testing Library, and more. Here is the full list. This could help you and your team start writing tests quicker.
Transform to different test scripts programmatically
On top of the extensions, most of these test providers also publish libraries to help you to convert multiple JSON user flows programmatically.
For example, use the @cypress/chrome-recorder libraries to export user flows to Cypress tests.
npm install -g @cypress/chrome-recorder
npx @cypress/chrome-recorder ./recordings/*.json
Replay user flows with extensions
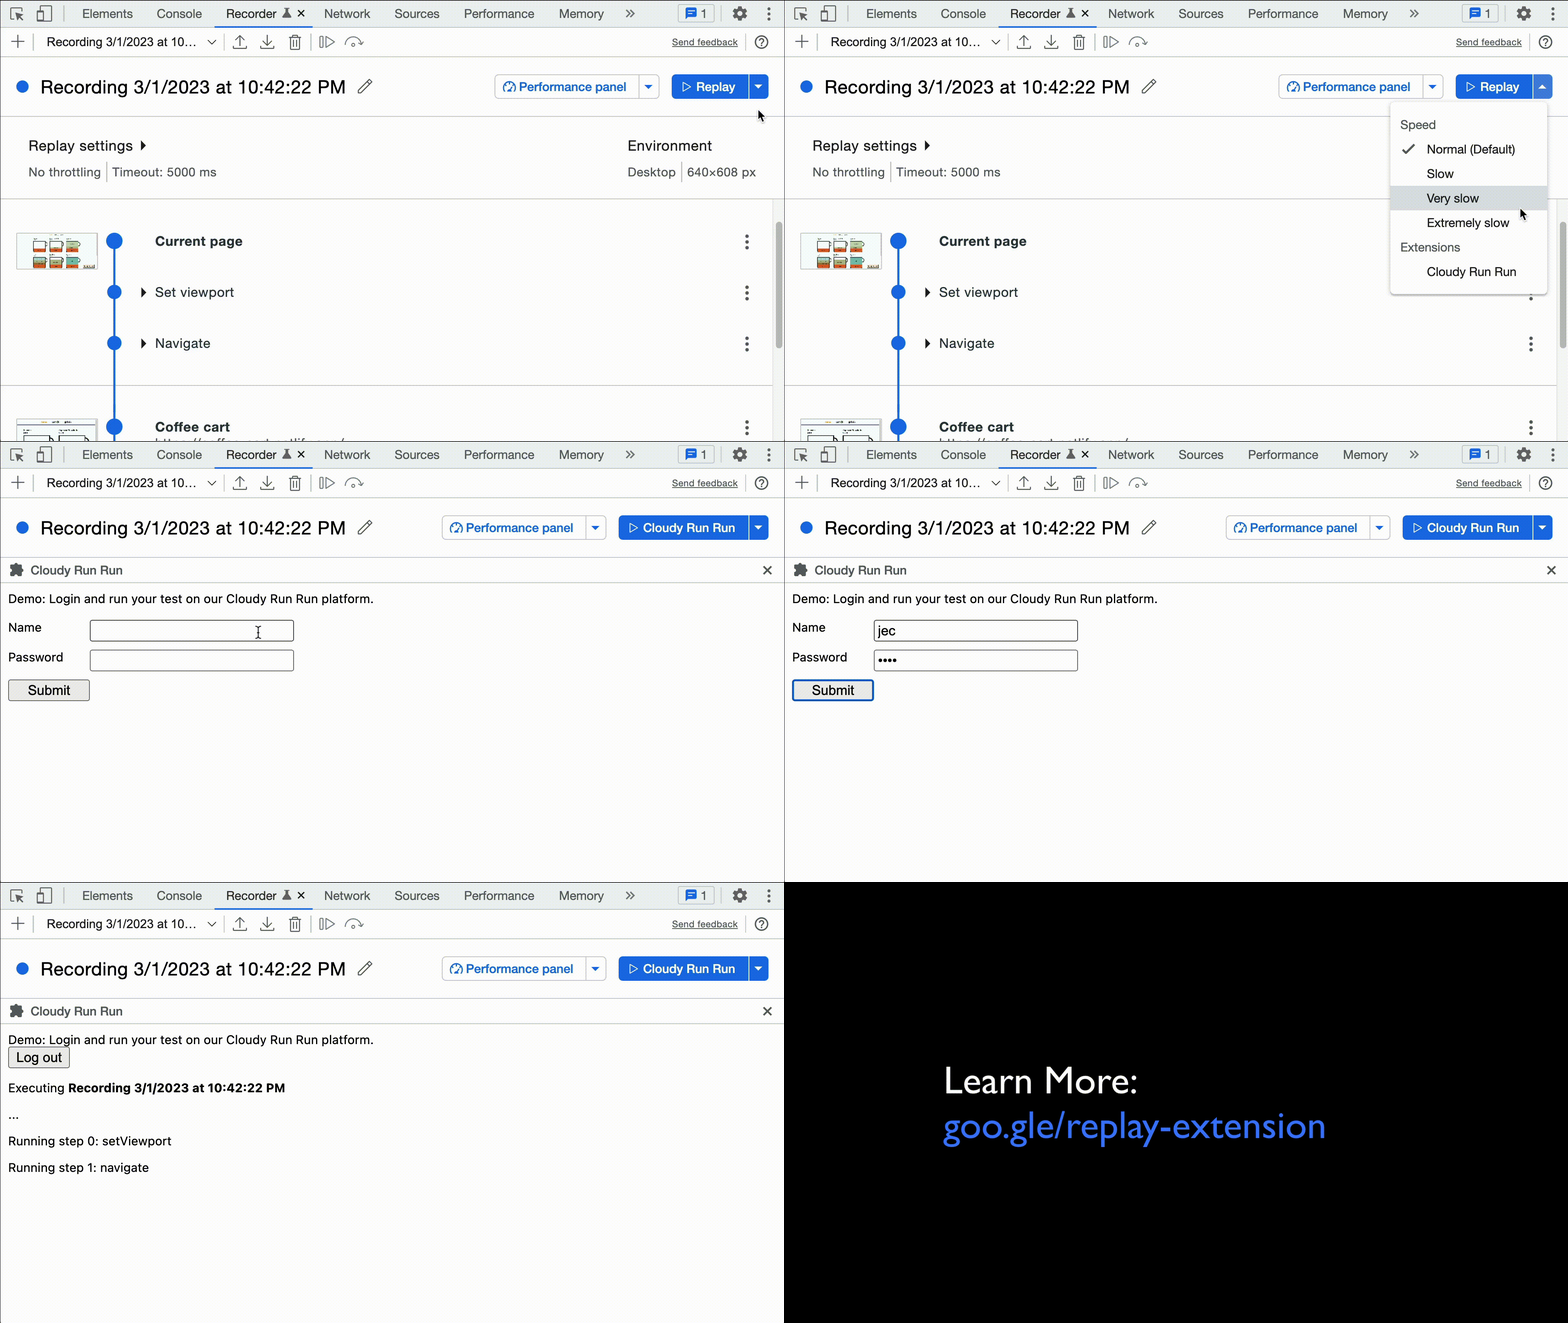
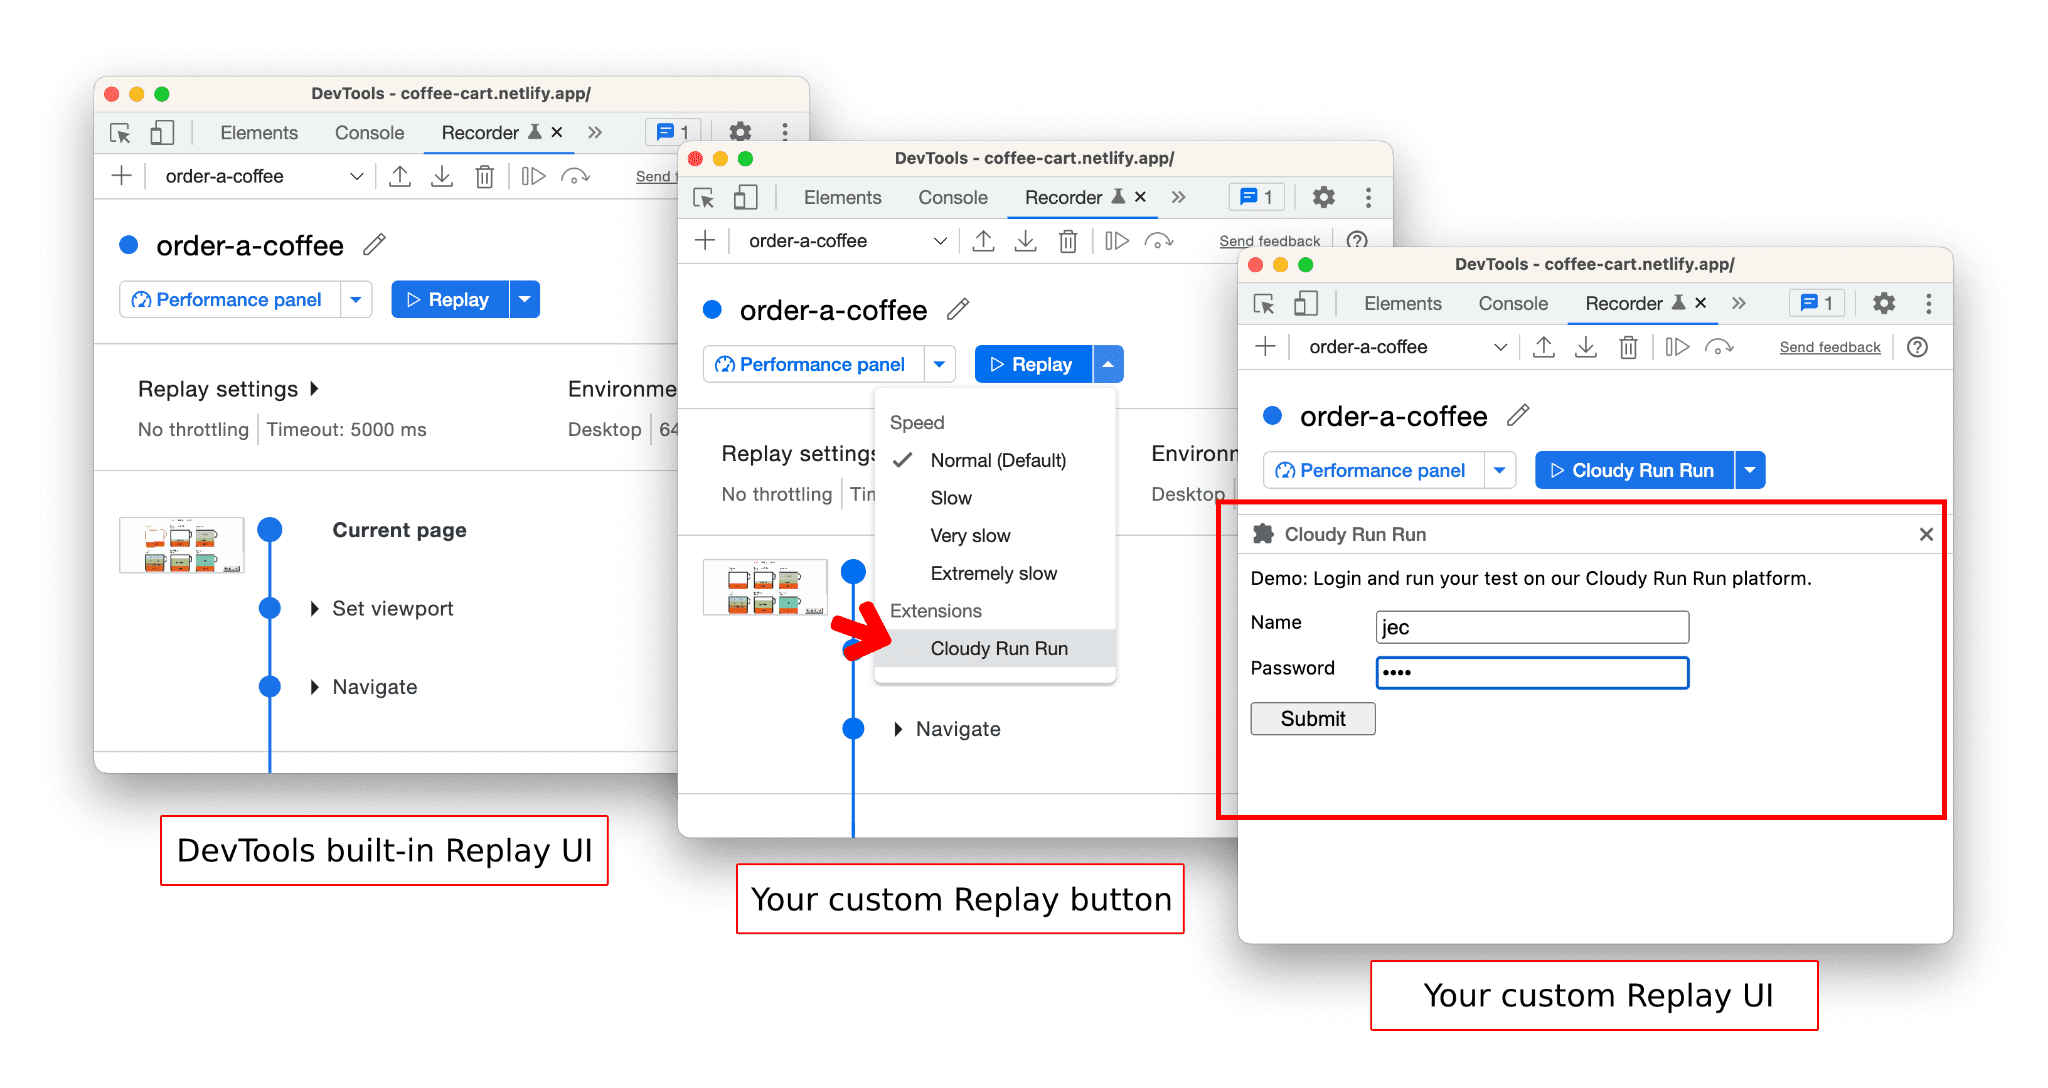
Starting from Chrome 112, you can now enhance your experience by using extensions to replay recordings. These extensions let you seamlessly integrate third-party services and infrastructure for replaying recordings without ever leaving DevTools.

To get started, explore the list of available extensions or learn how to create your own custom extension.
Build your own extensions or libraries
Behind the scenes, all extensions and libraries are built on top of the Puppeteer Replay library. Apart from allowing you to replay user flows, Puppeteer Replay offers APIs letting you customize or transform user flows replay.
Customize user flows replay
Let’s build a screenshot plugin. For each user flow, we want:
- To take a screenshot at the end of every step and save it to the
_screenshotsfolder. - To output a message when the user flow execution is completed.
Here is the code snippet. You can download this demo and play with it too.
/* screenshot-plugin.mjs */

import { mkdirSync } from "fs";
import { PuppeteerRunnerExtension } from "@puppeteer/replay";

// create folder if not exist
let screenshotFolder = "_screenshots";
mkdirSync(screenshotFolder, { recursive: true });

export default class ScreenshotPlugin extends PuppeteerRunnerExtension {
  count = 0;

  async afterEachStep(step, flow) {
    await super.afterEachStep(step, flow);
    this.count = this.count + 1;

    const path = `${screenshotFolder}/${flow.title}-${this.count}.png`;
    await this.page.screenshot({ path });

    console.log(`Saved screenshot as ${path}`);
  }

  async afterAllSteps(step, flow) {
    await super.afterAllSteps(step, flow);
    console.log("Operation completed successfully.");
  }
}
The code is pretty expressive itself. We extend the PuppeteerRunnerExtension API to save the screenshot after each step, and to log a message after all the steps.
Save the file, then we can run user flows with this extension using the following command:
# replay one user flow with plugin
npx @puppeteer/replay --extension ./screenshot-plugin.mjs  ./recordings/order-a-coffee.json

# replay all user flows with plugin under recordings folder
npx @puppeteer/replay --extension ./screenshot-plugin.mjs ./recordings/*.json
Here is the output:
Saved screenshot as _screenshots/order-a-coffee-1.png
Saved screenshot as _screenshots/order-a-coffee-2.png
Saved screenshot as _screenshots/order-a-coffee-3.png
…

Operation completed successfully.
Transform user flows
Another way to customize the user flow is to transform it into different formats (for example,Cypress, or Nightwatch test scripts).
For example, your user flow contains a step to navigate to an url. Here is what the JSON file looks like:
{
  "title": "order-a-coffee",
  "steps": [
    {
      "type": "navigate",
      "url": "https://coffee-cart.netlify.app/"
    },
    …
  ]
}
You can create a stringify plugin to transform the step to JavaScript. You can also view other existing libraries to see how they do it.
For example, the following code snippet shows how WebdriverIO transforms the navigation step:
export class StringifyPlugin extends PuppeteerStringifyExtension {

  #appendStepType(out: LineWriter, step: Step, flow: UserFlow) {
        switch (step.type) {
        case 'navigate':
    return out.appendLine(`await browser.url(${formatAsJSLiteral(step.url)})`)
        …
  }
When you run the plugin with the user flows, the navigation line translates into await browser.url(‘https://coffee-cart.netlify.app/’).
Customize DevTools replay experience
Replay extensions provide a way to replay recordings using third-party services and infrastructure, all without leaving the DevTools Recorder.

To create your own replay extension, consult the replay extension documentation and review an example extension for guidance.
Publish Chrome extensions
Once you customize and transform the user flows, you can package them as a Chrome extension and publish to the Chrome Web Store.
Check out this demo and instructions to learn how to debug locally and publish a Chrome extension.
Integrate with your CI/CD pipeline
There are multiple ways to do this and there are many tools out there. Here is an example of automating this process with GitHub Actions:
# .github/node.js.yml

name: Replay recordings

on:
  push:
    branches: [ "main" ]
  schedule:
    - cron: '30 12 * * *' # daily 12:30pm

jobs:
  build:

    runs-on: ubuntu-latest

    steps:
    - uses: actions/checkout@v3
    - name: Use Node.js
      uses: actions/setup-node@v3
      with:
        node-version: 18.x
        cache: 'npm'
    - run: npm install puppeteer
    - run: npm run replay-all
    - run: npm run start
In this example, we will replay the user flows when:
- new changes push to the
mainbranch - every day at 12:30pm
Apart from GitHub Actions, you can integrate with your favorite cloud providers too. Go to this demo to see how you can use Google Cloud Run Job to execute up to 10,000 user flows in parallel!
Conclusion
In this blog post, we’ve discussed the different options to export user flows as JSON files, customize replays with PuppeteerReplayExtension, transform user flows with PuppeteerStringifyExtension, and integrate them in your CI workflows.
I hope this blog post has given you some ideas about how you can use the Recorder panel and the tools provided to make it easier to integrate a testing workflow into your projects. Can’t wait to see what you’ll build!
Download the preview channels
Consider using the Chrome Canary, Dev, or Beta as your default development browser. These preview channels give you access to the latest DevTools features, let you test cutting-edge web platform APIs, and help you find issues on your site before your users do!
Get in touch with the Chrome DevTools team
Use the following options to discuss the new features, updates, or anything else related to DevTools.
- Submit feedback and feature requests to us at crbug.com.
- Report a DevTools issue using the More options > Help > Report a DevTools issue in DevTools.
- Tweet at @ChromeDevTools.
- Leave comments on What's new in DevTools YouTube videos or DevTools Tips YouTube videos.


