

Published: September 15, 2026
This guide describes the CrUX tools available to view ad metrics. These tools enable engineering and product teams to evaluate ad experiences of sites. To support various use cases, the CrUX dataset is made available through a variety of tools.
| Tool | Audience | Description | Example use cases |
|---|---|---|---|
| CrUX Vis | Non-technical stakeholders and developers | A web-based dashboard tool to visualize CrUX data. | High-level visual monitoring, reporting, and tracking performance trends. |
| CrUX API | Developers | A REST API providing programmatic access to the latest rolling 28-day data. | CI/CD pipeline integration, automated regression tracking and alerting. |
| CrUX History API | Developers | A REST API providing programmatic access to historical weekly time-series field data. | Performance monitoring, validating the impact of updates, and trend analysis. |
For more details on the capabilities of each tool, see the CrUX tools documentation.
Ad metrics
The following metric keys are available for CrUX API and CrUX History API payloads:
| Metric | Key | Unit | Description |
|---|---|---|---|
| Ad Density | experimental_ad_density |
Percent string | The average percentage of the viewport area occupied by ads during the user's session. |
| Ad Count | experimental_ad_count |
Unitless | The average number of ad frames visible in the viewport during the user's session. |
| Ad Weight: CPU | experimental_ad_cpu |
Milliseconds | The cumulative CPU execution time of ad frames and workers. |
| Ad Weight: Network | experimental_ad_kilobytes |
Kilobytes | The cumulative network kilobytes transferred by ad frames and resources. |
All ad metrics are reported at the 75th percentile (p75) to reflect the vast majority of real-world user experiences while filtering out outlier sessions. Also, note that CrUX ad metrics don't have thresholds like Core Web Vitals such as "Good", "Needs improvement", or "Poor".
For details on how the metrics are measured, see the methodology guide.
CrUX Vis
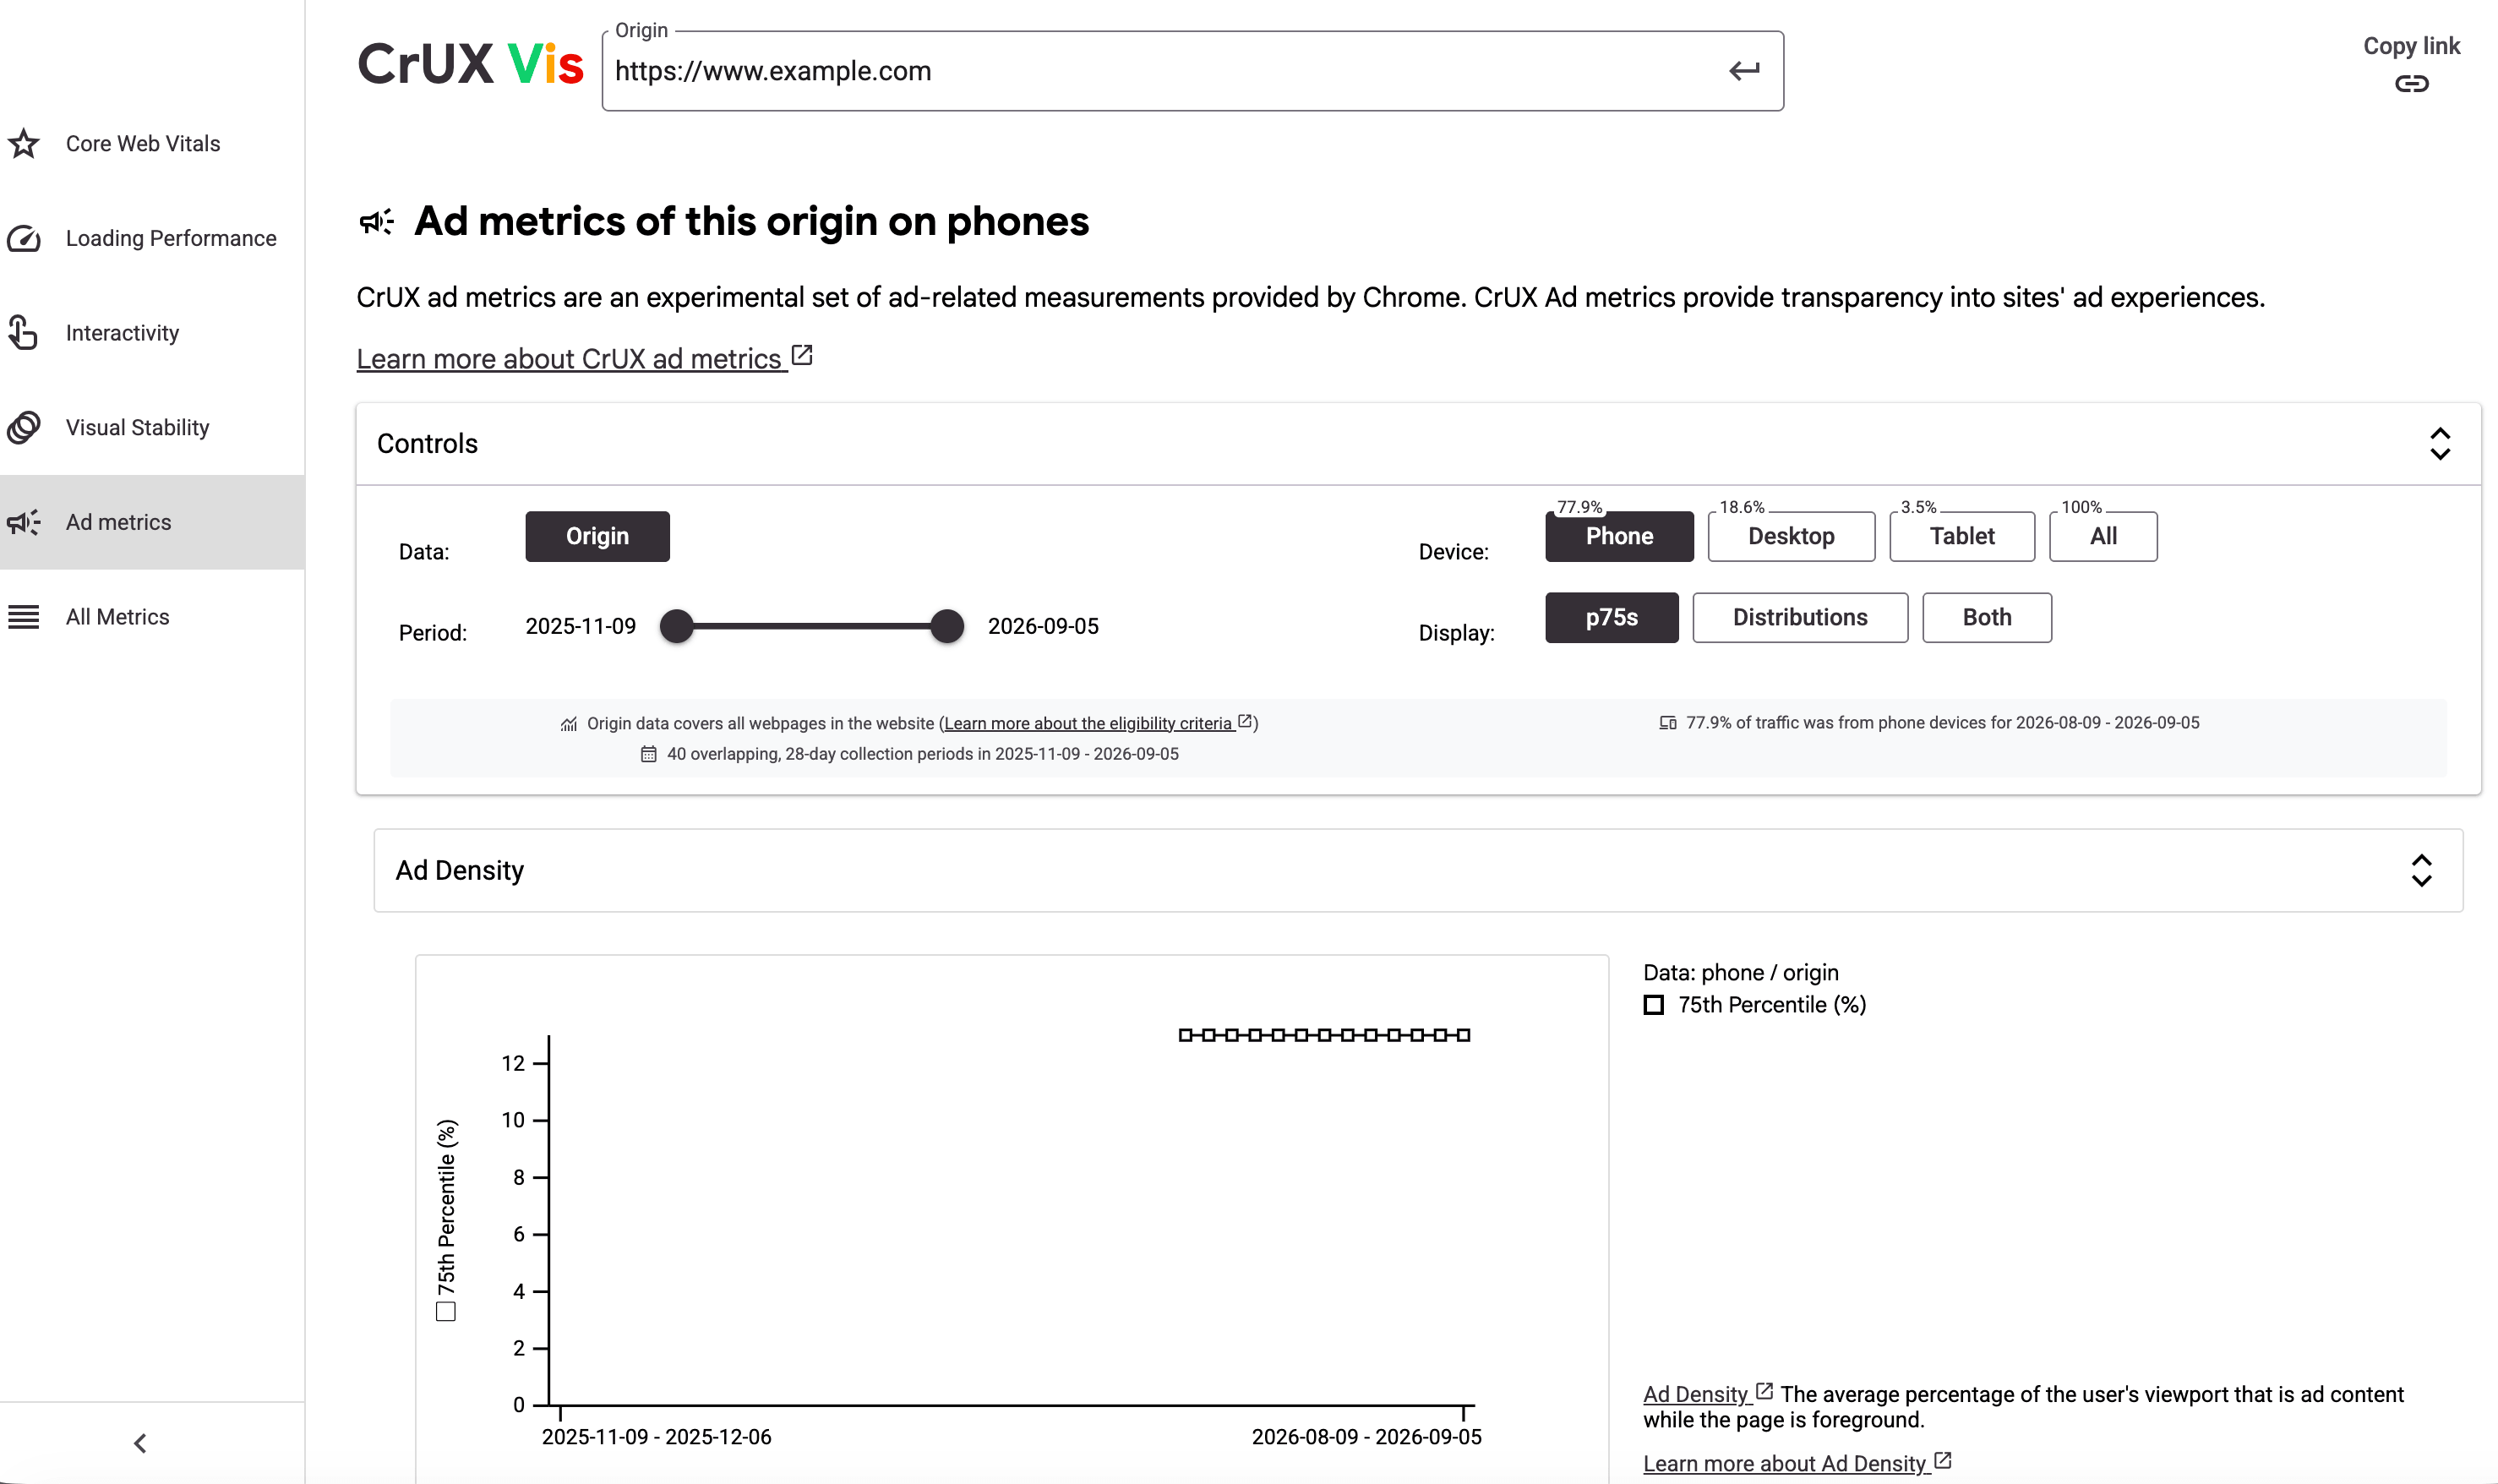
CrUX Vis is a web-based dashboard tool designed to visualize CrUX data. The dashboard plots historical trends of the past 40 weeks of rolling 28-day collection periods. It updates weekly on Mondays.
CrUX Vis does not require engineering knowledge, and is accessible to non-technical users. It is suitable for high-level visual monitoring, and tracking week-over-week performance trends. It supports toggling between origin-level and URL-level data and filtering by device.
For a deeper dive on using the dashboard, see the CrUX Vis documentation.
CrUX API
The CrUX API provides programmatic access to aggregated origin-level and page-level field data from real users. Its queryRecord endpoint returns a snapshot of the latest 28-day rolling average aggregation of ad metrics. The data is updated daily.
Teams can integrate the API with their own tooling to track performance and regressions, or set up automated alerting platforms to monitor ad count, density, or weight spikes. The API can also be used to build custom internal dashboards that track ad experience alongside other metrics.
We also expect a number of third-party tools to make use of the CrUX API to use this data, as has been the case with other data made available to the API.
For a deeper dive on using the API, see the CrUX API documentation.
API request
To query the latest rolling 28-day snapshot of ad load metrics for a specific origin, send an HTTP POST request to https://chromeuxreport.googleapis.com/v1/records:queryRecord?key=[YOUR_API_KEY] with the following body:
{
  "origin": "https://example.com",
  "metrics": [
    "experimental_ad_density",
    "experimental_ad_count",
    "experimental_ad_cpu",
    "experimental_ad_kilobytes"
  ]
}
Example curl command
You can run the following curl command in your terminal (make sure to replace [YOUR_API_KEY] with your actual API key):
curl -s -X POST \
 --header "Content-Type: application/json" \
 --data '{
  "origin": "https://example.com",
  "metrics": [
   "experimental_ad_density",
   "experimental_ad_count",
   "experimental_ad_cpu",
   "experimental_ad_kilobytes"
  ]
 }' \
 "https://chromeuxreport.googleapis.com/v1/records:queryRecord?key=[YOUR_API_KEY]"
To fetch page-level data instead of origin-level data, replace the origin field with url.
Note when the metrics field is not populated, all metrics are returned in the response.
API response
The queryRecord API returns JSON containing the 75th percentile (p75) values for the requested ad metrics:
{
 "record": {
  "key": {
   "origin": "https://example.com"
  },
  "metrics": {
   "experimental_ad_count": {
    "percentiles": {
     "p75": "3.00"
    }
   },
   "experimental_ad_density": {
    "percentiles": {
     "p75": 23
    }
   },
   "experimental_ad_cpu": {
    "percentiles": {
     "p75": 1093
    }
   },
   "experimental_ad_kilobytes": {
    "percentiles": {
     "p75": 33
    }
   },
  },
  "collectionPeriod": {
   "firstDate": {
    "year": 2026,
    "month": 5,
    "day": 7
   },
   "lastDate": {
    "year": 2026,
    "month": 6,
    "day": 3
   }
  }
 }
}
CrUX History API
The CrUX History API provides programmatic access to historical time-series field data. Its queryHistoryRecord endpoint returns a weekly updated history of the past 28-day rolling averages over the last 6 months, typically returning 40 weekly data points. The weekly historical data is released every Monday, containing the 40 most recent 28-day collection periods that end on Saturdays.
The History API is ideal for tracking performance trends over time, validating the impact of site updates across a historical window, and building historical reporting dashboards. Like the CrUX API, the History API also requires a CrUX API key.
For a deeper dive on using the API, see the CrUX History API documentation.
API request
To query a historical time-series of ad metrics, send an HTTP POST request to https://chromeuxreport.googleapis.com/v1/records:queryHistoryRecord?key=[YOUR_API_KEY] with the following body:
{
 "origin": "https://example.com",
 "metrics": [
    "experimental_ad_density",
    "experimental_ad_count",
    "experimental_ad_cpu",
    "experimental_ad_kilobytes"
 ]
}
Example curl commands
You can run the following curl command in your command line interface:
curl -s -X POST \
 --header "Content-Type: application/json" \
 --data '{
  "origin": "https://example.com",
  "metrics": [
    "experimental_ad_density",
    "experimental_ad_count",
    "experimental_ad_cpu",
    "experimental_ad_kilobytes"
  ]
 }' \
 "https://chromeuxreport.googleapis.com/v1/records:queryHistoryRecord?key=[YOUR_API_KEY]"
API response
The queryHistoryRecord API returns JSON containing arrays of values corresponding to the weekly collection period time-series:
{
  "record": {
    "key": {
      "origin": "https://example.com"
    },
    "metrics": {
      "experimental_ad_count": {
        "percentilesTimeseries": {
          "p75s": ["3.00", "3.00", "2.00", // ...]
        }
      },
      "experimental_ad_density": {
        "percentilesTimeseries": {
          "p75s": [23, 23, 26, // ...]
        }
      },
      "experimental_ad_cpu": {
        "percentilesTimeseries": {
          "p75s": [1105, 1124, 1155, // ...]
        }
      },
      "experimental_ad_kilobytes": {
        "percentilesTimeseries": {
          "p75s": [33, 34, 33, // ...]
        }
      }
    },
    "collectionPeriods": [
      {"firstDate": {"year": 2026, "month": 3, "day": 8}, "lastDate": {"year": 2026, "month": 4, "day": 4}},
      {"firstDate": {"year": 2026, "month": 3, "day": 15}, "lastDate": {"year": 2026, "month": 4, "day": 11}},
      {"firstDate": {"year": 2026, "month": 3, "day": 22}, "lastDate": {"year": 2026, "month": 4, "day": 18}},
      // ...
    ]
  }
}
CrUX dataset on BigQuery
CrUX ad metrics are initially being included in the CrUX APIs. We are working on adding the ad metrics to the CrUX dataset on BigQuery to enable users to query and analyze the ad metrics using SQL. We will update this section when the ad metrics are available in the BigQuery dataset.
Chrome DevTools
The ad metrics are also available in the DevTools Ad panel as detailed in the ad detection guide.
Feedback
If you have any questions or feedback regarding ad metrics, reach out to us at the Chrome UX Report Google Group.