

Published: February 11, 2026
Similar to Chrome 139, for Chrome 145 the Chrome DevTools team prioritized product excellence, tackling known issues, unifying UI implementations, and improving test health. The numerous subtle fixes and refinements across various panels landed through this effort should make your daily debugging and development workflows smoother, more reliable, and more productive.
DevTools MCP server updates
The DevTools MCP server has received significant updates from v0.11.0 to v0.14.0, introducing key automation and emulation capabilities.
- Auto Connection: The new
--auto-connectflag allows the server to automatically discover and attach to a running Chrome instance, removing the need to manually copy WebSocket URLs. - Unified Emulation: A single
emulatetool now handles geolocation, network conditions (offline/slow 3G), CPU throttling, and user agent overrides. - Preserved Logs: You can now access network requests and console messages across navigations, mirroring the "Preserve Log" functionality in DevTools.
See the public changelog on GitHub for the full list of changes.
Soft Navigations are now visible in trace view
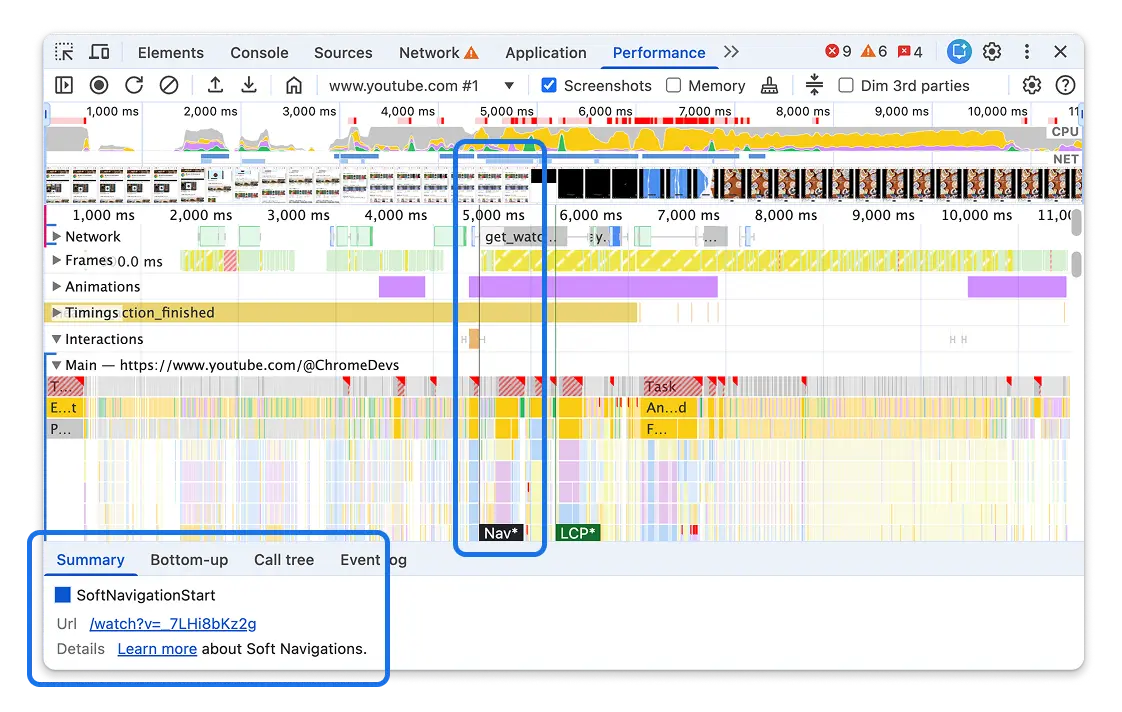
Soft navigation and soft LCP markers are now visible in the Performance panel trace view if your website is using Single Page Application (SPA) architecture. This makes it significantly easier to debug performance in modern web applications where navigations happen without a full page reload.
Read more about soft navigations on this blog post. The live metrics view and Performance Insights don't reflect soft navigations, but that work is planned for future releases as work on this API continues.
Chromium issues: 450673886, 450673887
Line-level profiler timings now far more precise
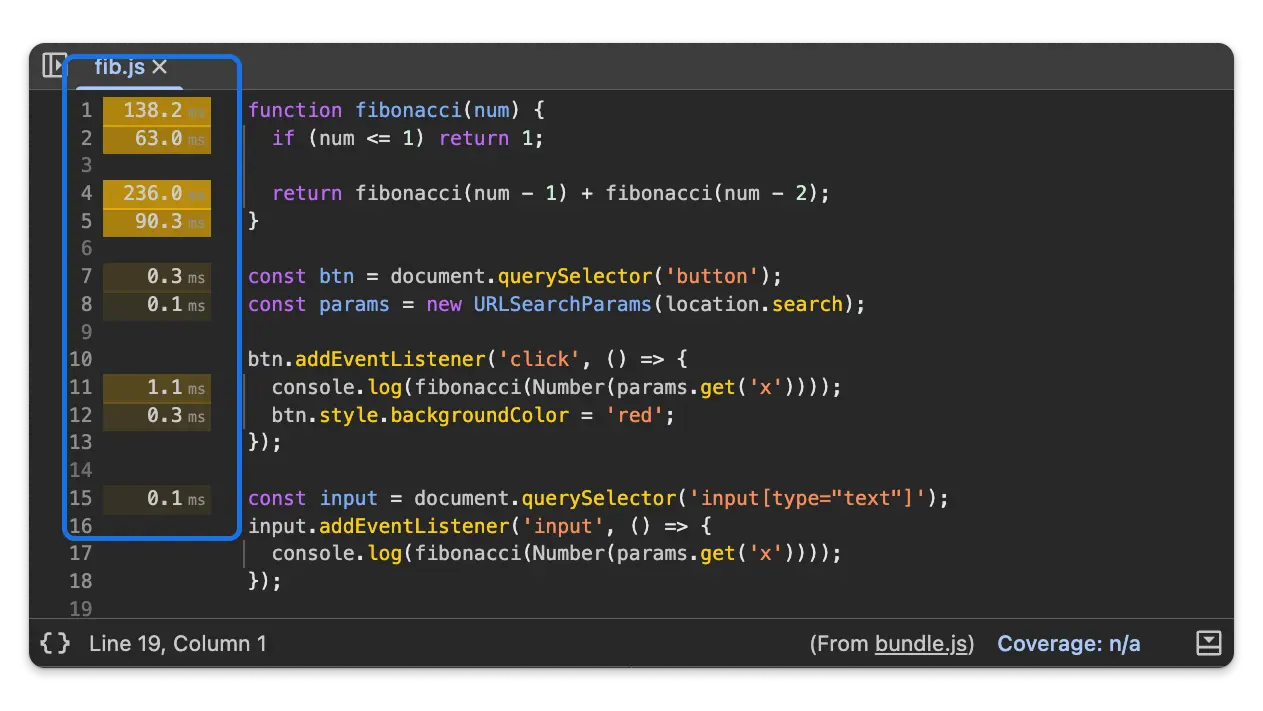
After recording a trace in the Performance panel, the Sources panel displays the timings observed in the trace on a per-line basis. This lets you identify exactly which lines of code are consuming the most execution time.
This feature previously had bugs that made it unreliable when the source was
pretty-formatted (using the {} button) or when using source-mapped scripts.
These issues have been resolved, making line-level profiling accurate and usable
for production-ready, minified code.
Faster trace interaction
A major bottleneck in the Performance panel has been resolved. Previously, selecting time ranges or panning through busy traces could result in significant UI lag due to redundant event sorting. This has been optimized, making interaction with complex flame charts substantially more responsive.
Chromium issue: 457866795
Identify render-blocking resources
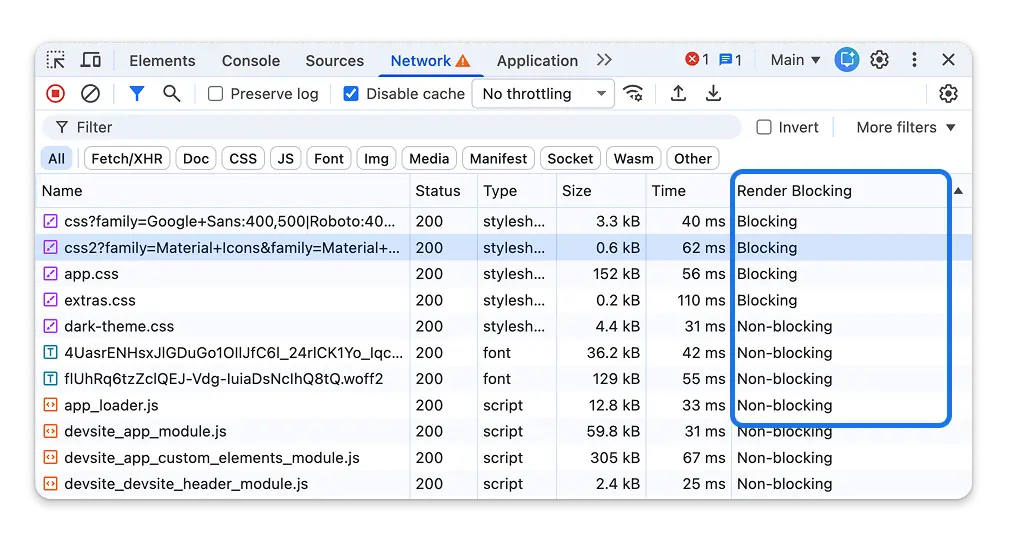
The Network panel now includes a dedicated Render blocking column. This lets you immediately identify which resources (JavaScript, CSS, and fonts) are preventing the browser from painting the page content, helping you optimize your First Paint performance.
Chromium issue: 41169154
Individual network request throttling
The Request conditions panel (formerly Network request blocking), which was introduced in Chrome 144, now has individual request throttling enabled by default.
While this feature was introduced in the previous milestone, it was disabled due to a late regression. In Chrome 145, you can now reliably throttle specific network requests to simulate slow dependencies or test how your app handles specific resource delays.
Open the panel from ⋮ > More Tools > Request Conditions to start throttling or blocking specific patterns.
Debugging improvements for @starting-style
Support for debugging the CSS @starting-style rule is now enabled by
default. This feature helps you inspect styles applied when an element is
first rendered, which is essential for debugging entry animations and
transitions.
Chromium issue: 465367572
AI Assistance updates
- Multimodal Input: You can now paste images directly from your clipboard into the AI Assistance chat to ask questions about visual issues.
Chromium issue: 470997699
Miscellaneous highlights
- Elements: A new View source badge has been added next to the root
<html>tag, providing a quick way to jump to the document's source code. - Sources: Editable JSON files now support a reversible pretty-print toggle, making it easier to edit data without losing the original formatting.
- Network: Context menu items have been updated to use sentence case for better readability.
- Console: Fixed an issue where filters for uncaught exceptions were lost after reloading the page.
Chromium issues: 378870233, 461041921, 433162438
Accessibility announcements
This version brings the following accessibility improvements:
- Search: Screen readers now announce the number of search results (e.g., "1 of 5") when using Ctrl+F.
- Recorder: Screen readers now announce when a recording has been successfully deleted or imported.
- Settings: Screen readers now announce the number of results when filtering in the Experiments tab.
- Privacy: The Origin group in the Privacy panel is now fully accessible using the keyboard.
- UI: Improved visibility of dock icons and disabled select elements for users in High Contrast and Forced Colors modes.
Chromium issues: 448675917, 392090449, 471713944, 471141907, 471095586