

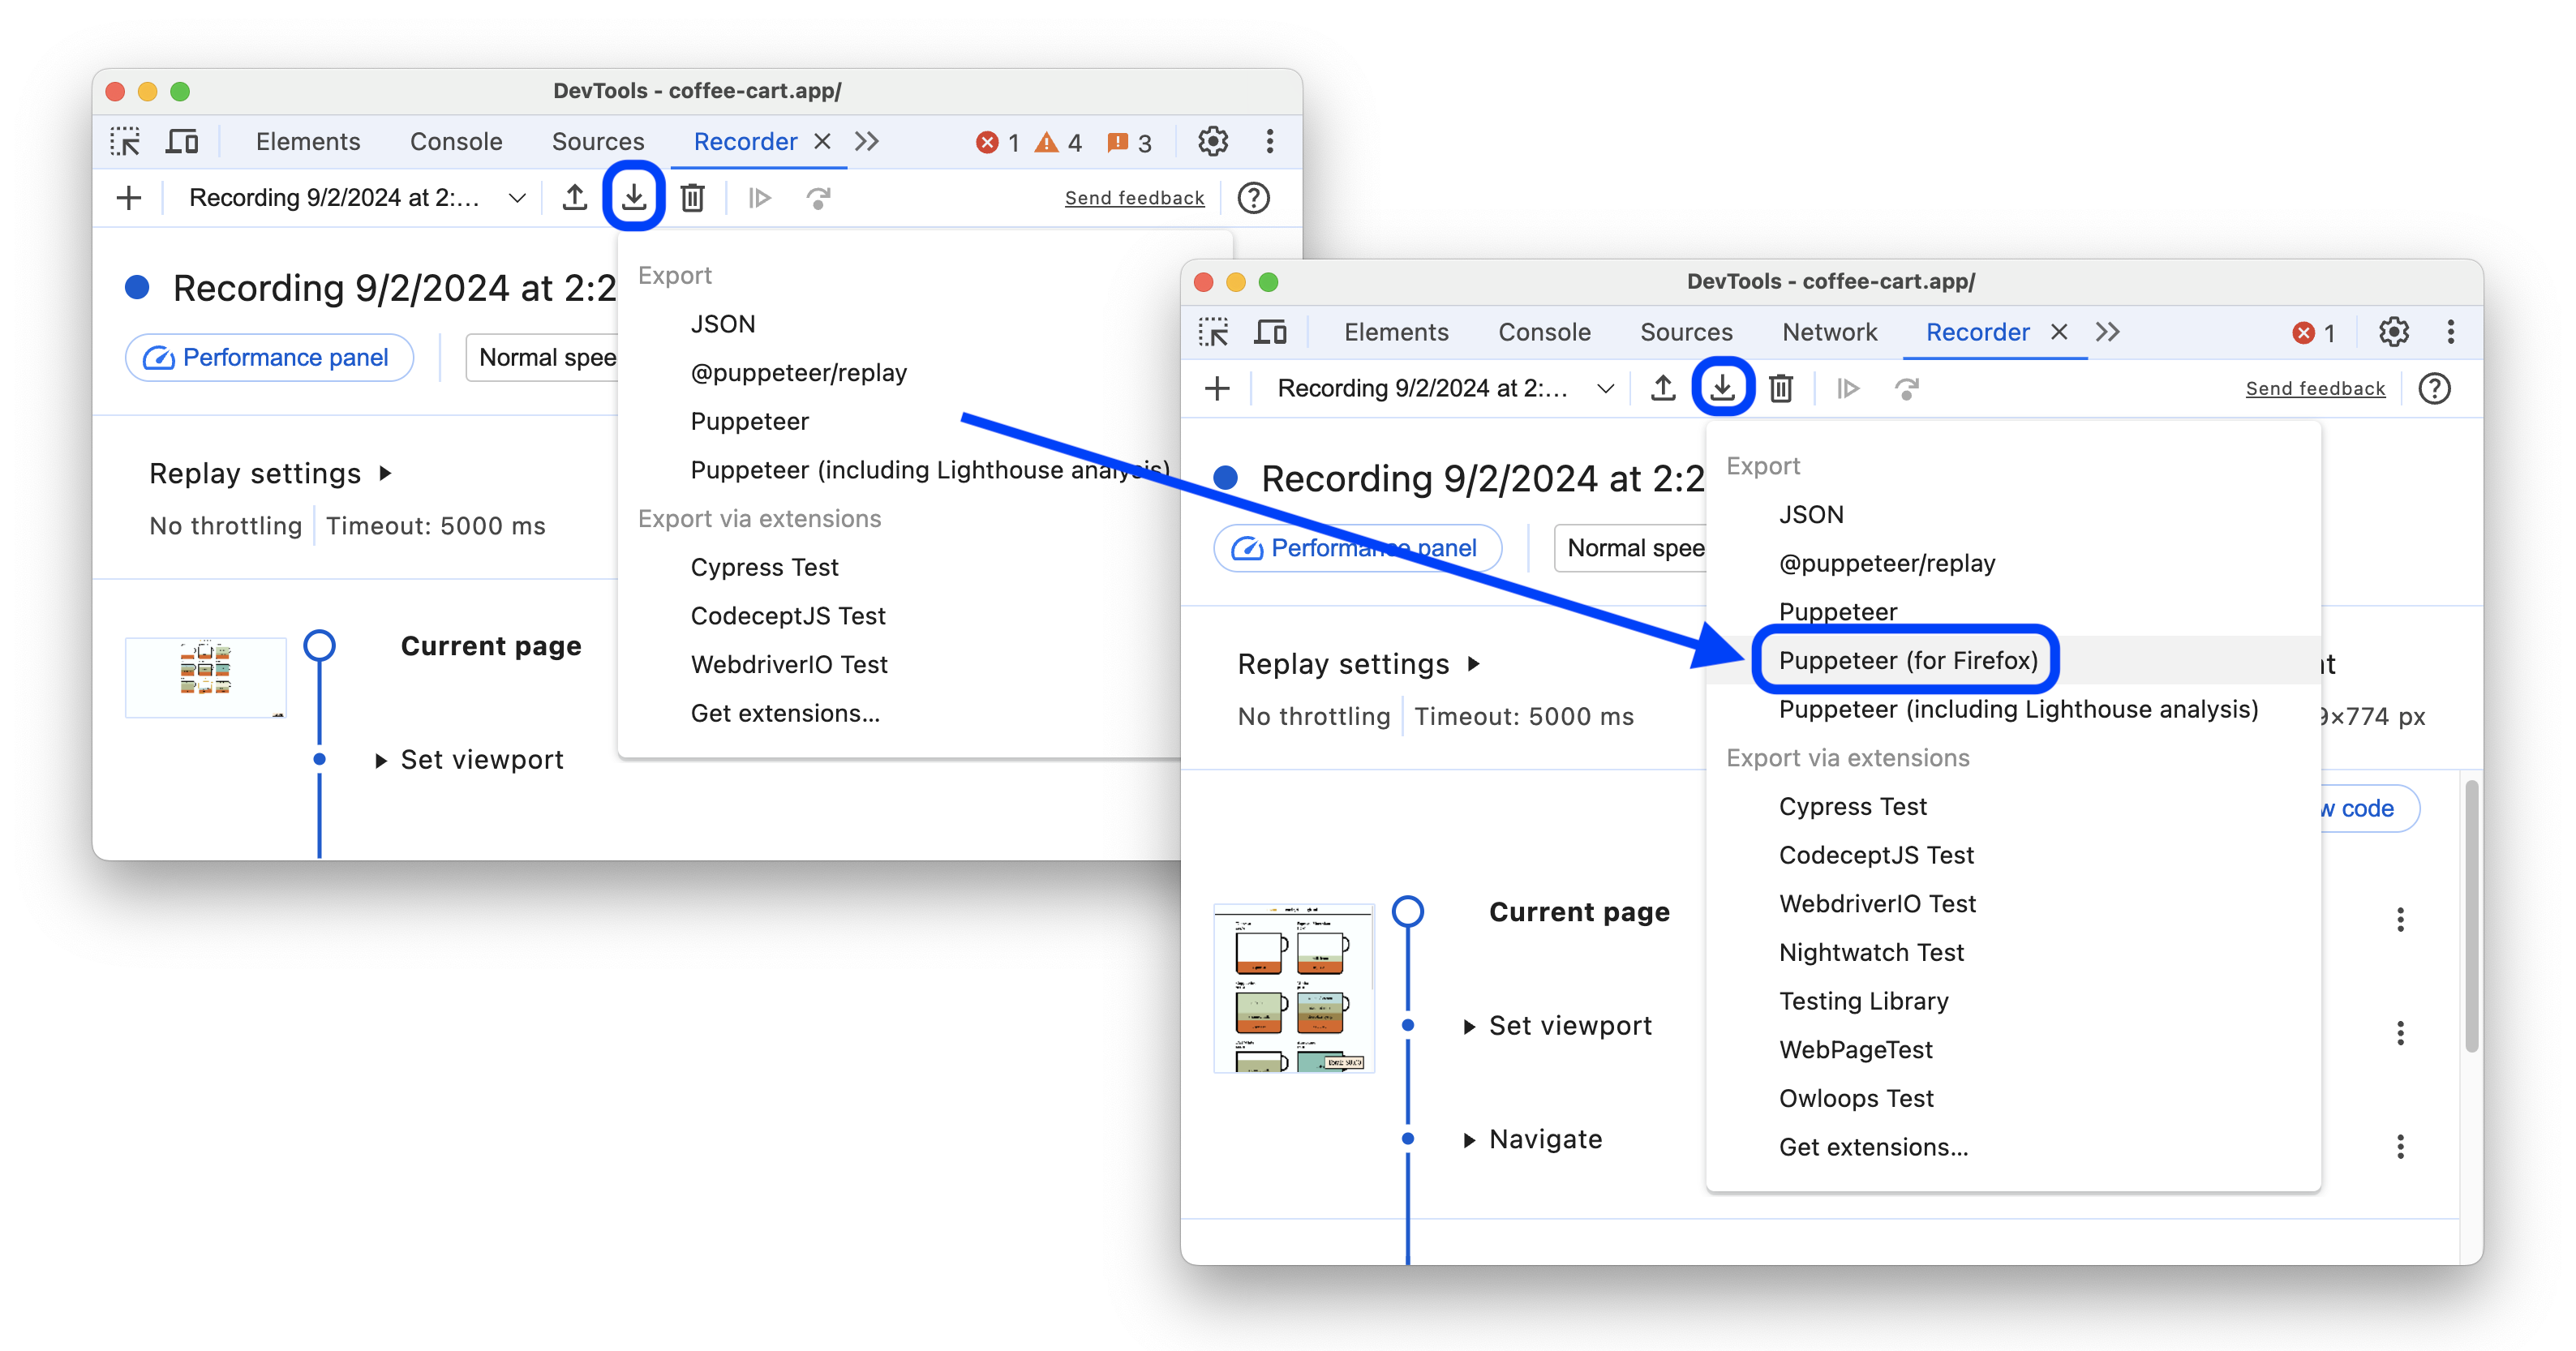
Recorder admite la exportación a Puppeteer para Firefox
Como parte de la compatibilidad con WebDriver BiDi, el panel Recorder ahora puede exportar grabaciones a Puppeteer para Firefox. Con la compatibilidad de Puppeteer con Firefox, ahora puedes grabar flujos de usuarios con el panel Grabadora de las Herramientas para desarrolladores de Chrome, exportarlos y ejecutarlos en Firefox y Chrome.
Para obtener más información, consulta WebDriver BiDi: El futuro de la automatización en varios navegadores.
Mejoras en el panel de rendimiento
Esta versión incluye varias mejoras en el panel Rendimiento.
Observaciones de las métricas en vivo
El panel Rendimiento ahora te muestra observaciones en tiempo real sobre las Métricas web esenciales, tanto en tu máquina local como en función de los datos de campo del Chrome UX Report. Esto te permite detectar problemas de rendimiento sin tener que capturar registros de rendimiento y comprender qué tan representativa es tu experiencia en comparación con la de tus usuarios.
Para ver las observaciones en vivo sobre el LCP y el CLS, abre el panel Rendimiento. Para ver la INP, realiza una interacción en una página. Para comparar tus métricas locales con la experiencia del usuario agregada del Chrome UX Report, agrega datos de campo: en la sección Datos de campo a la derecha, haz clic en Configurar y, en la ventana de diálogo, haz clic en Aceptar. Coloca el cursor sobre el valor de una métrica para ver un cuadro de información con más detalles.
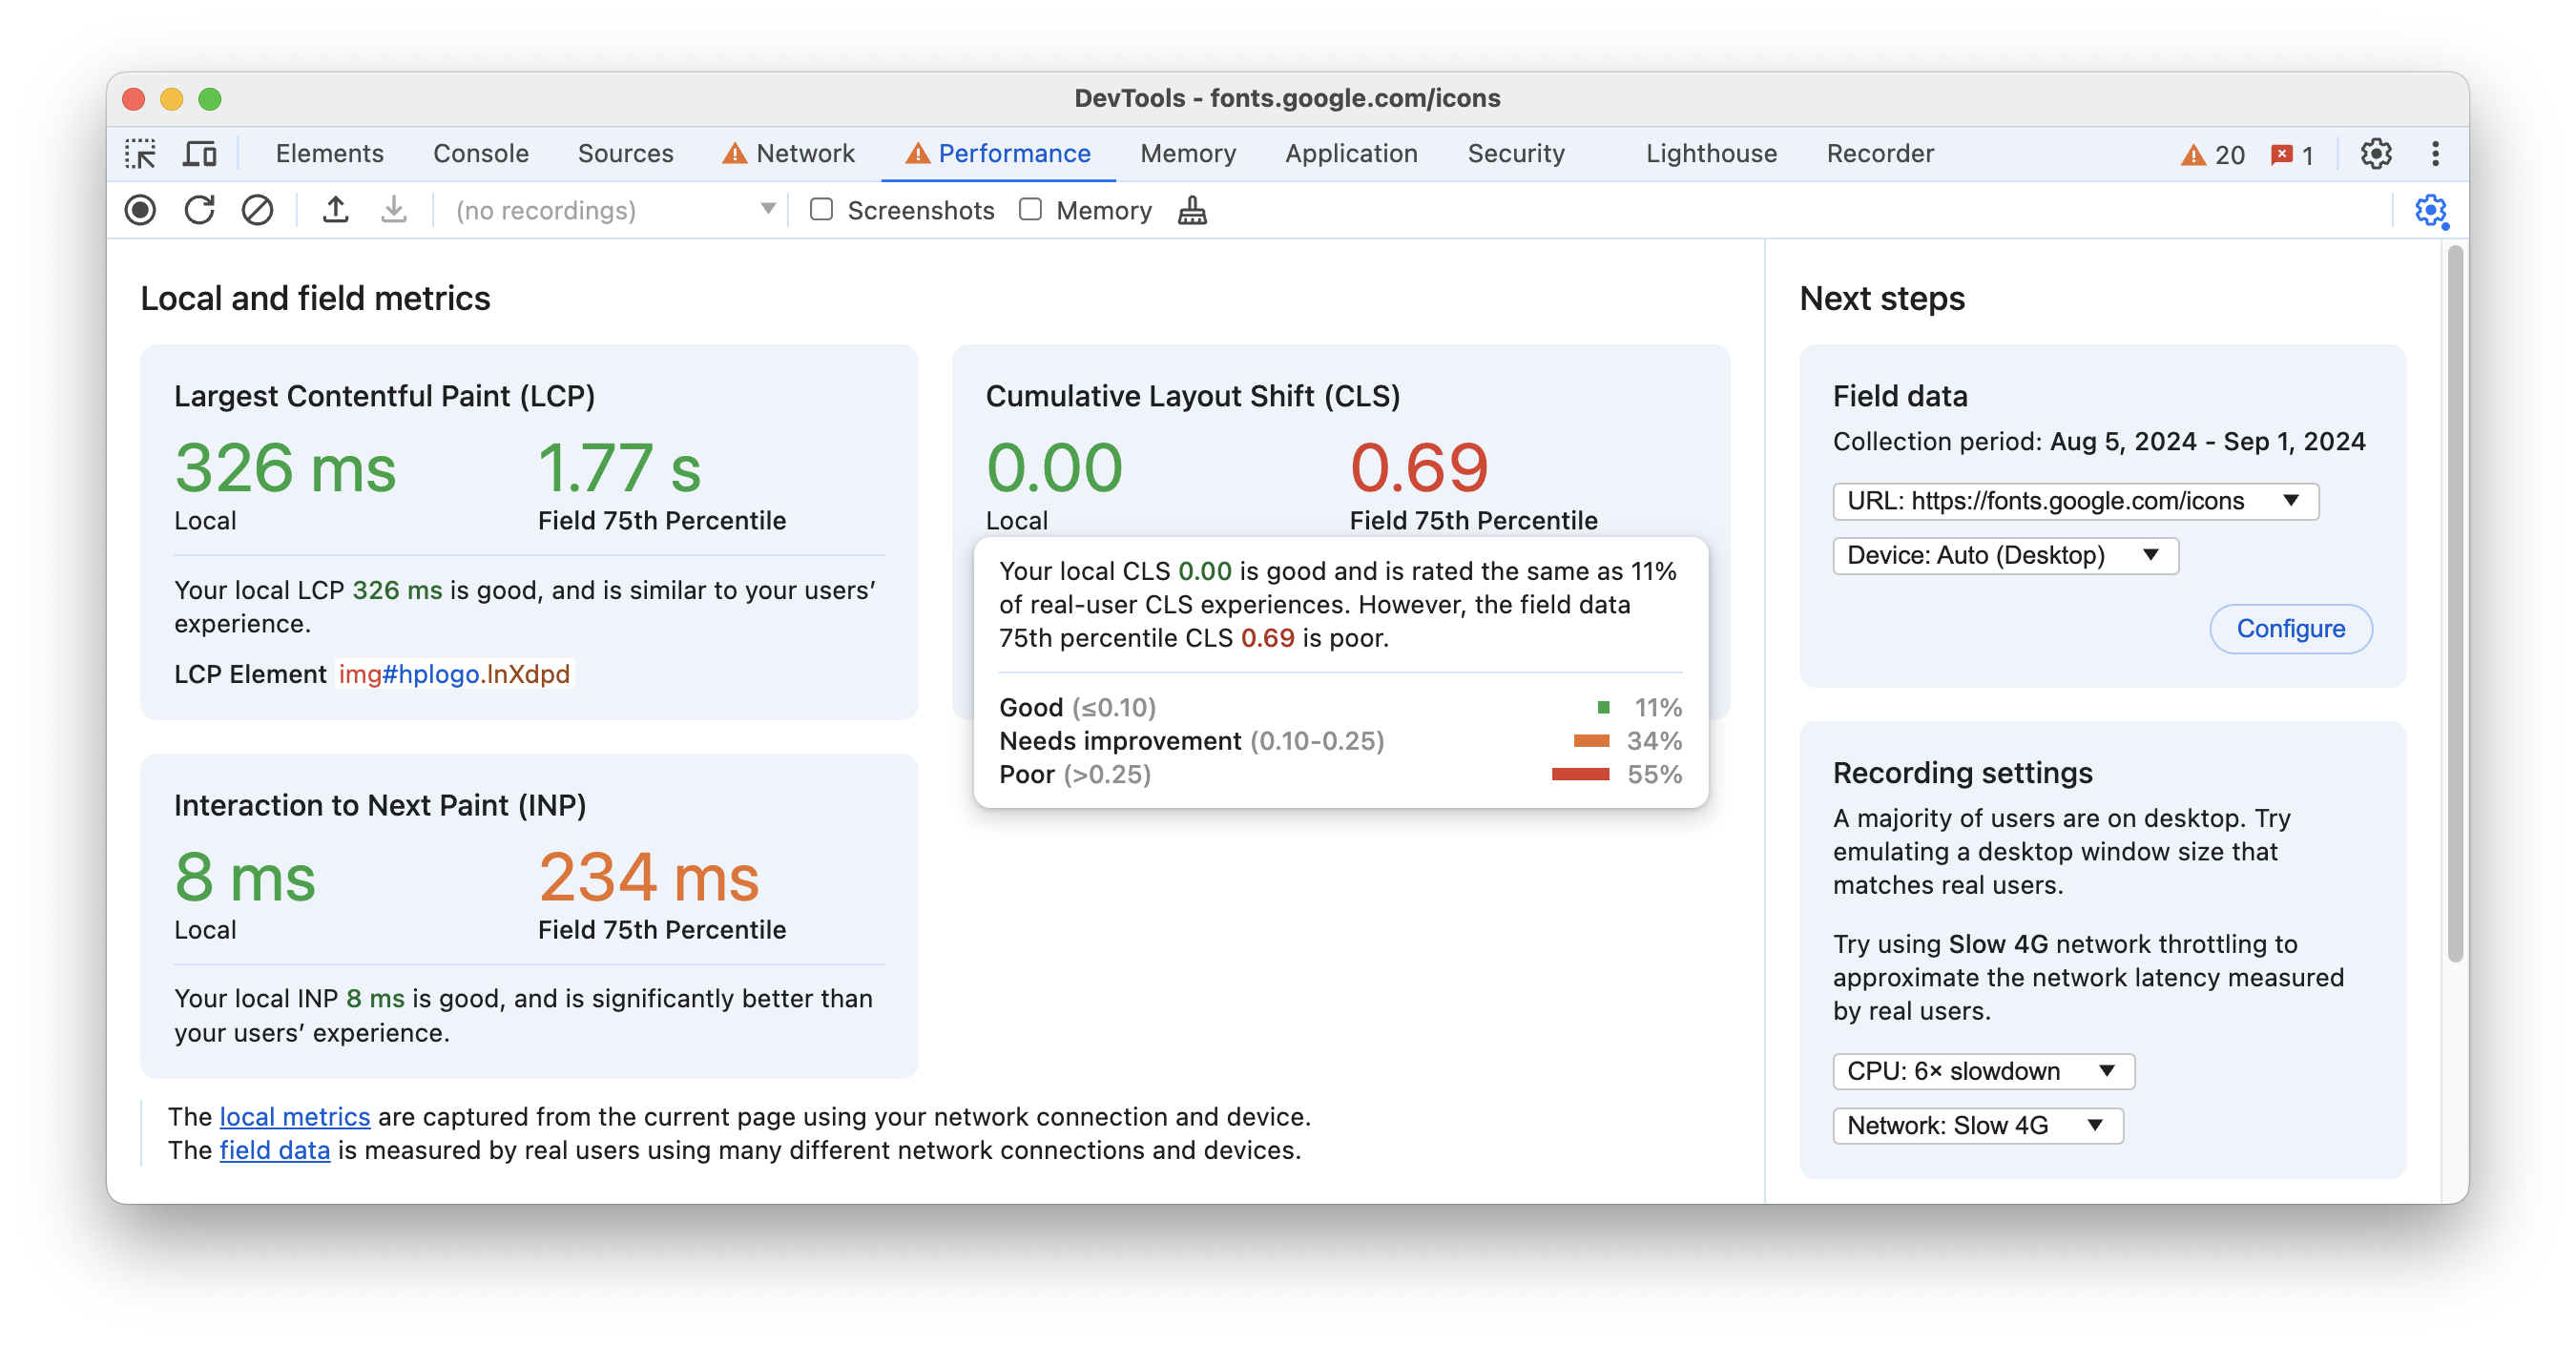
El panel Rendimiento destaca las métricas que se pueden mejorar y proporciona estadísticas y sugerencias para que tu experiencia local coincida con la de tus usuarios. Por ejemplo, es posible que desees limitar la CPU o la red, lo que puedes hacer en la misma pantalla en la sección Configuración de grabación a la derecha.
Cómo buscar solicitudes en el registro de red
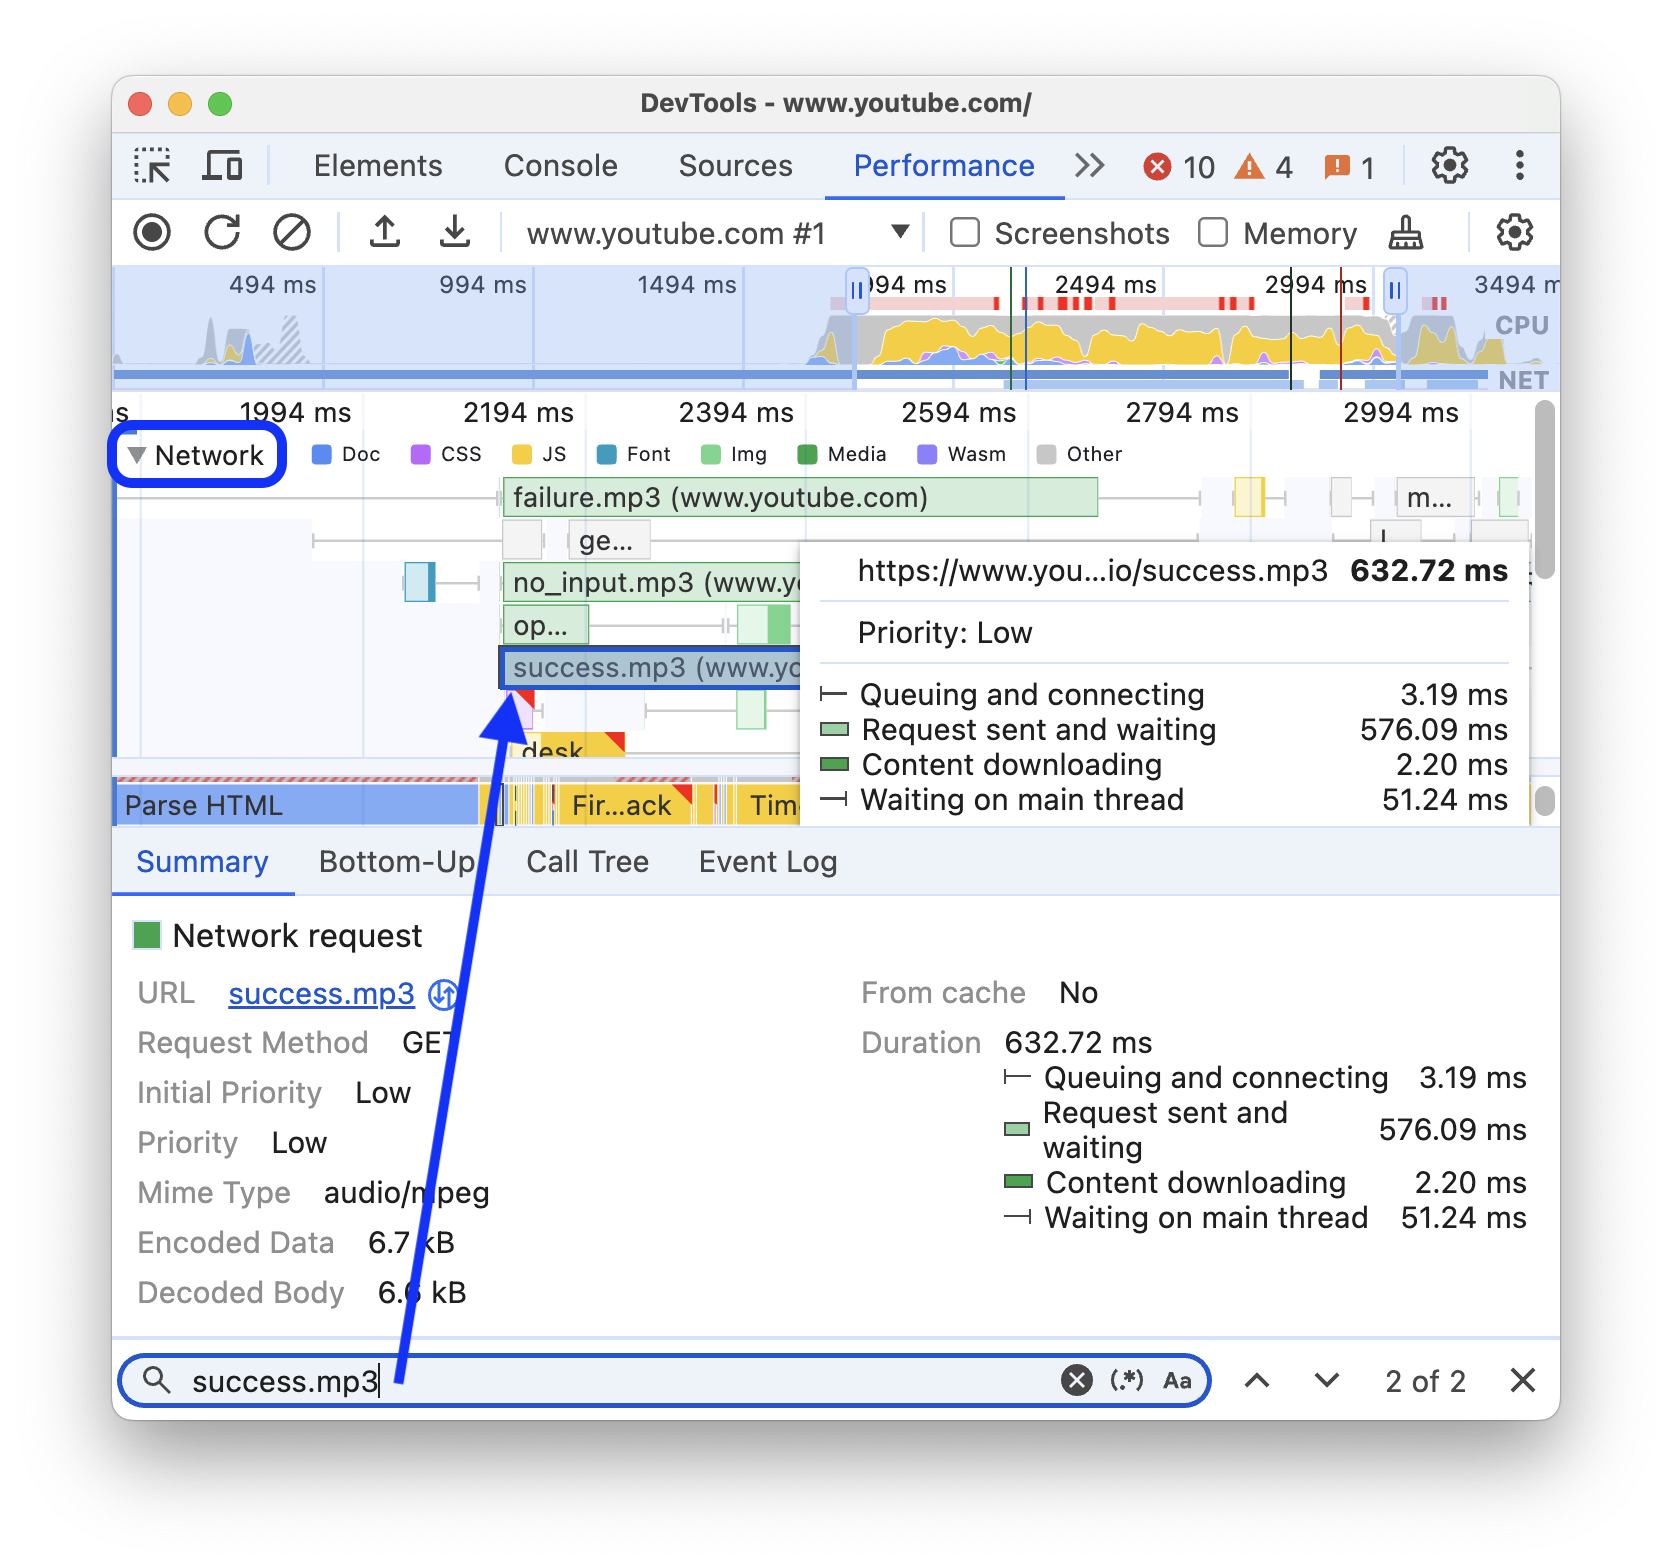
El cuadro Search del panel Performance ahora también funciona en el registro Network, por lo que puedes encontrar solicitudes con la combinación de teclas Ctrl / Cmd + F.
Ver los seguimientos de pila de las llamadas a performance.mark y performance.measure
En la pestaña Summary, el panel Performance ahora muestra los seguimientos de pila de las llamadas a performance.mark y performance.measure. Puedes usar estas llamadas para extender el registro de rendimiento con tus datos personalizados.
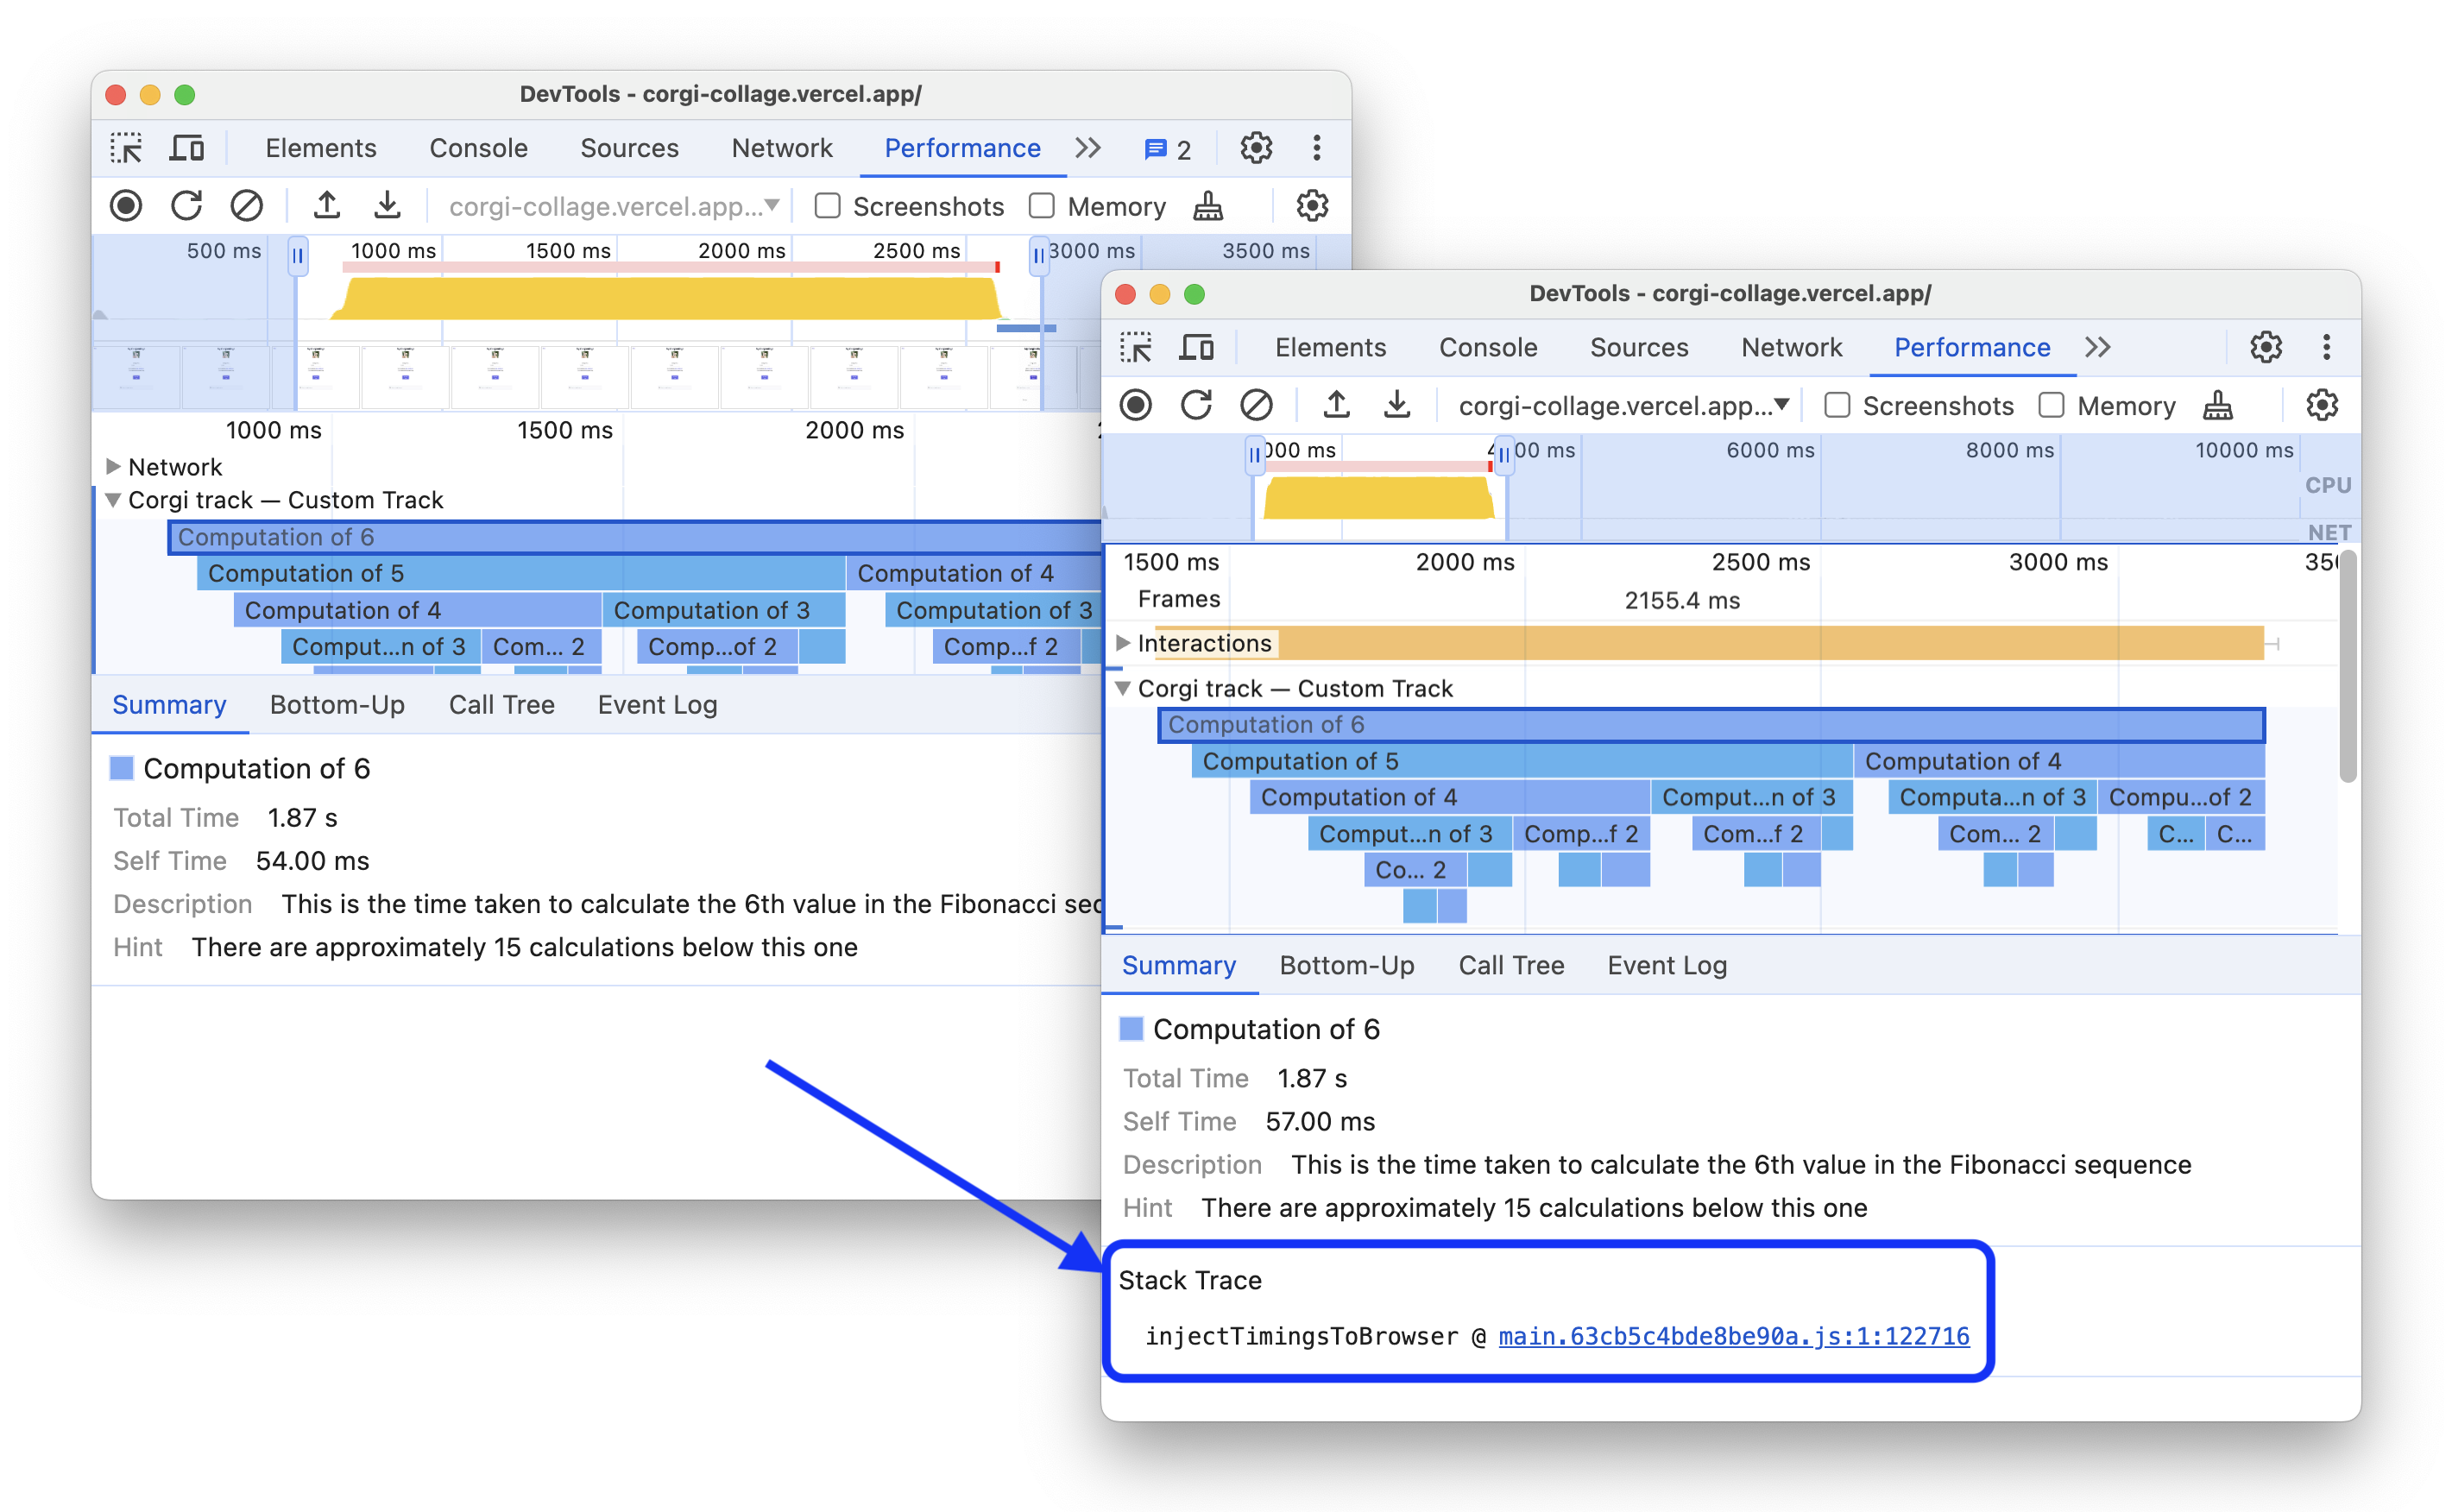
Para obtener más información, consulta Personaliza tus datos de rendimiento con la API de extensibilidad.
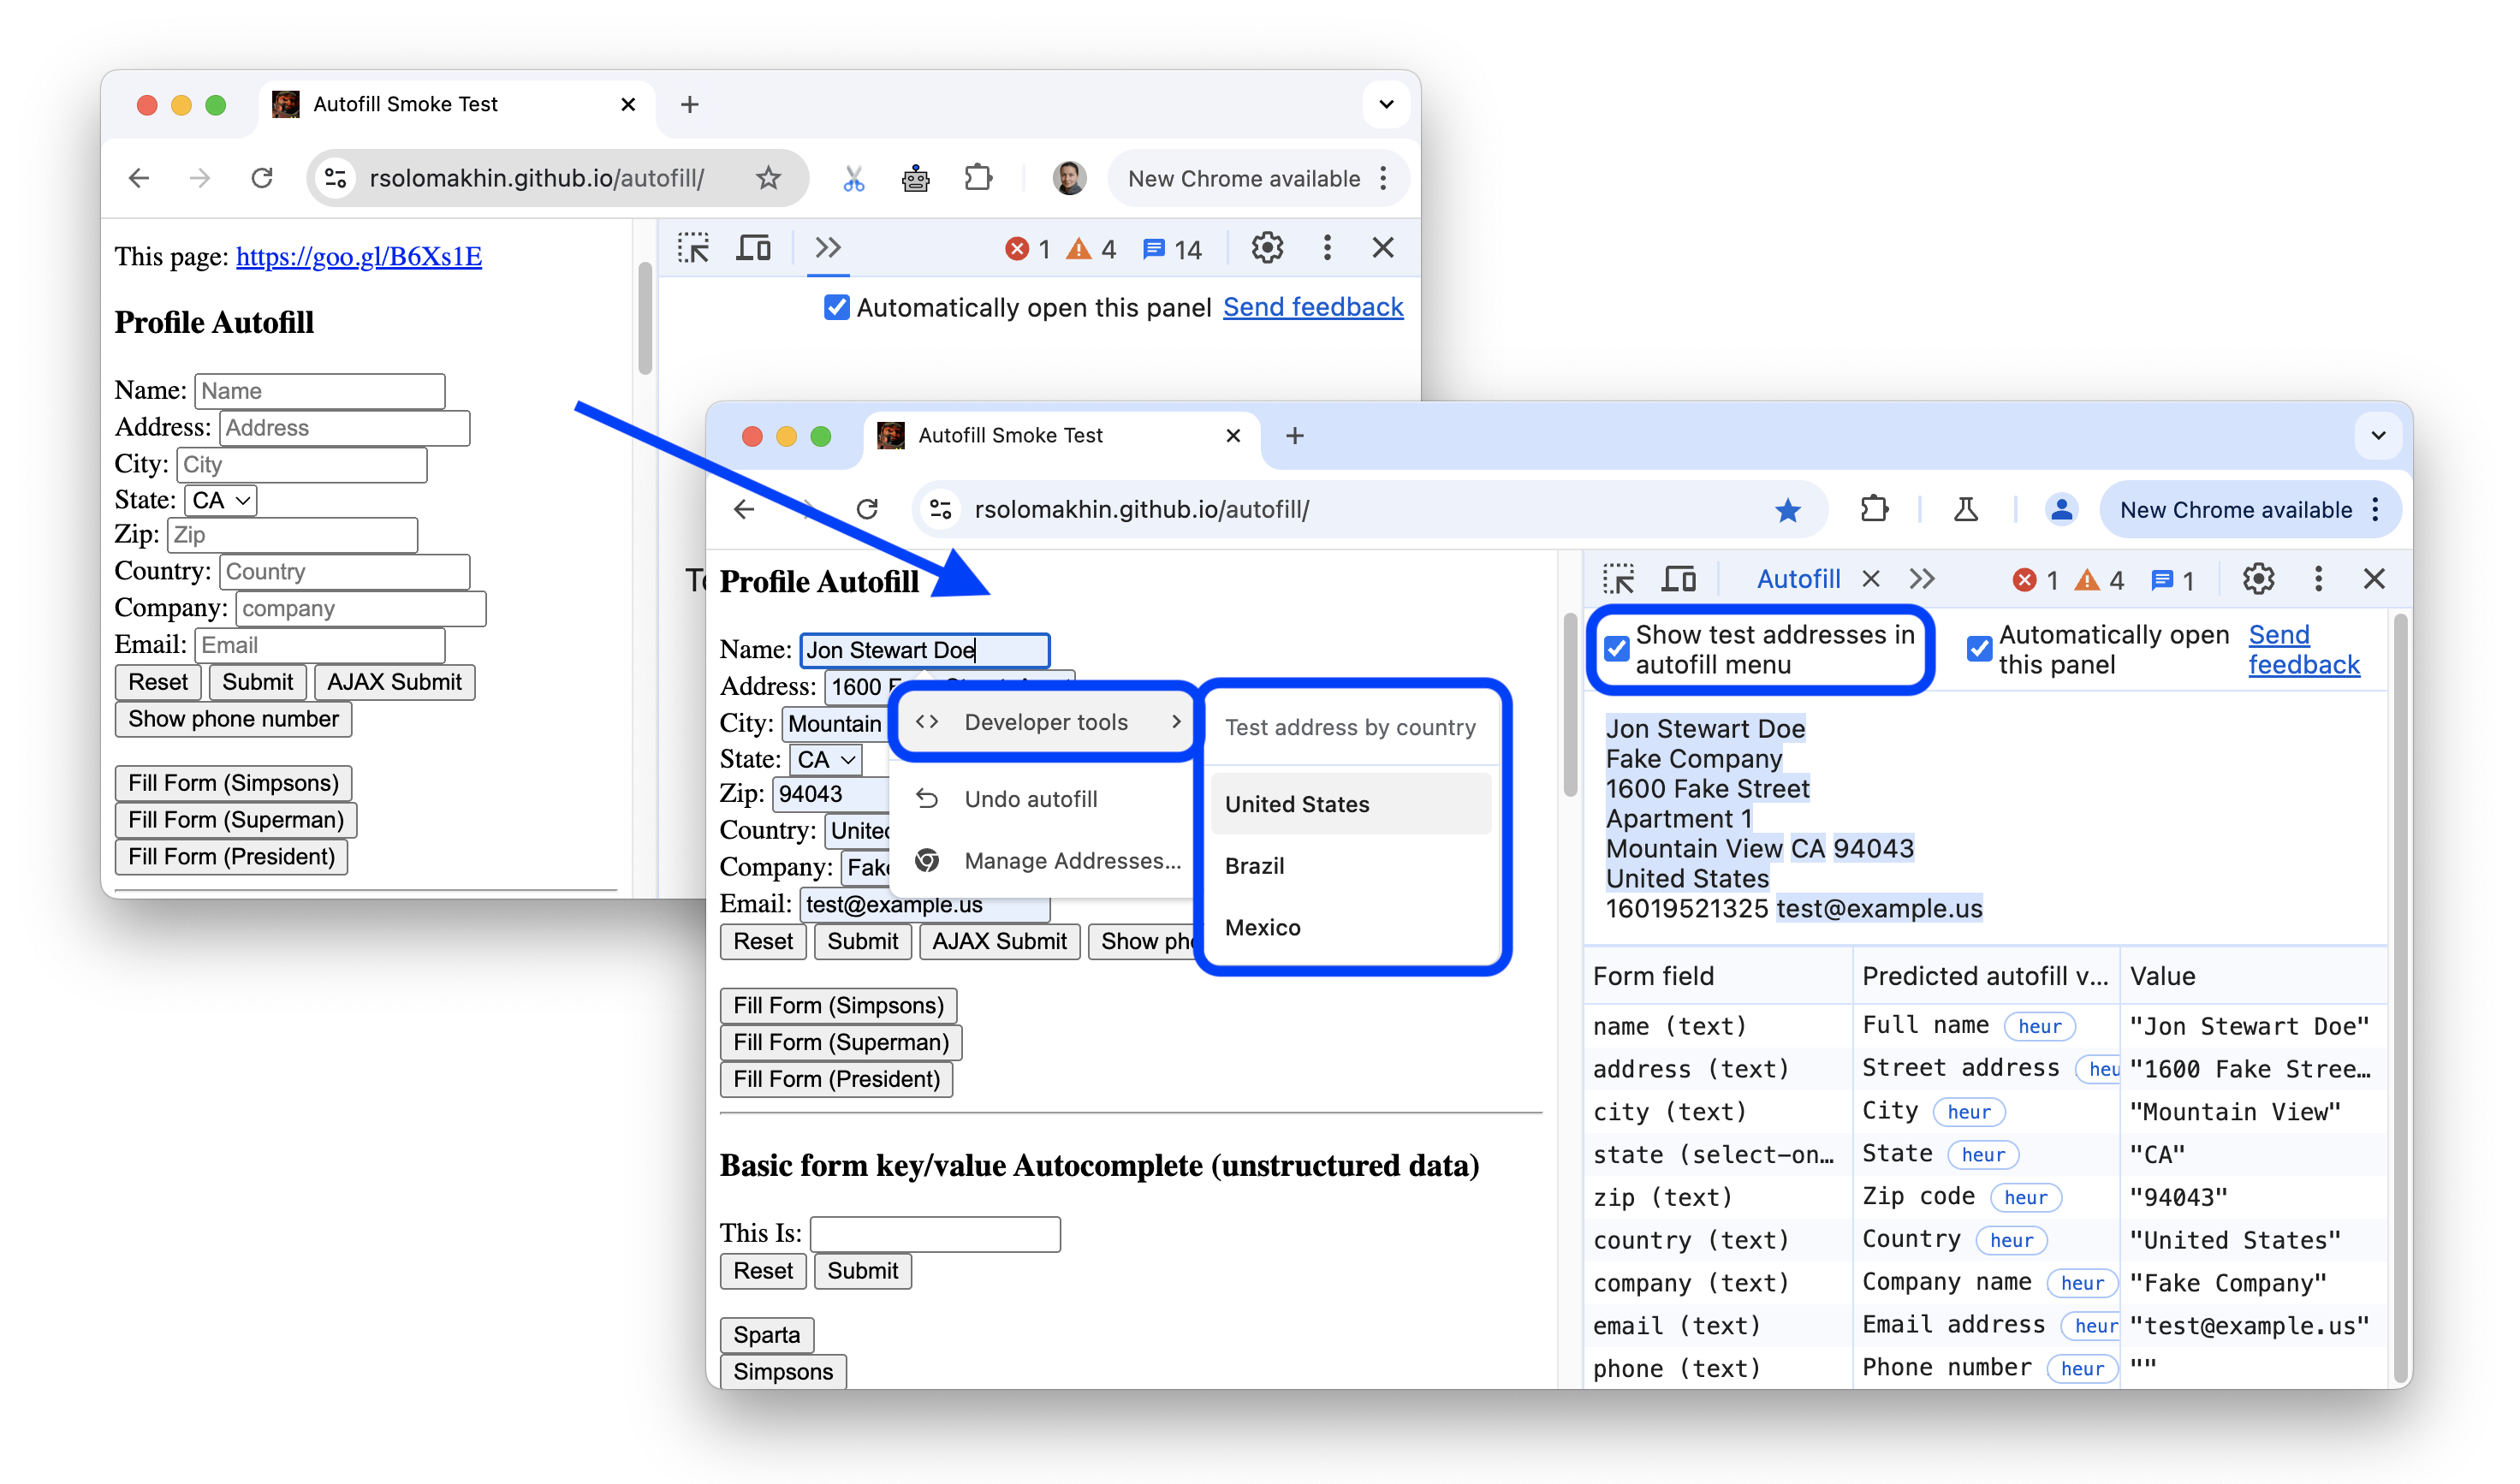
Cómo usar datos de direcciones de prueba en el panel de Autocompletar
El panel Autocompletar ahora proporciona datos de prueba para los formularios de dirección. Esto facilita la prueba de los formularios de direcciones en tu sitio web cuando no tienes direcciones guardadas en Chrome o usas un perfil de invitado.
Para autocompletar formularios de direcciones con datos de prueba, abre el panel Autocompletar, activa Mostrar direcciones de prueba en el menú de Autocompletar, haz clic con el botón derecho en un campo de formulario de dirección de tu página y selecciona una de las opciones del menú Herramientas para desarrolladores.
Mejoras en el panel de elementos
Esta versión incluye algunas mejoras en el panel Elements.
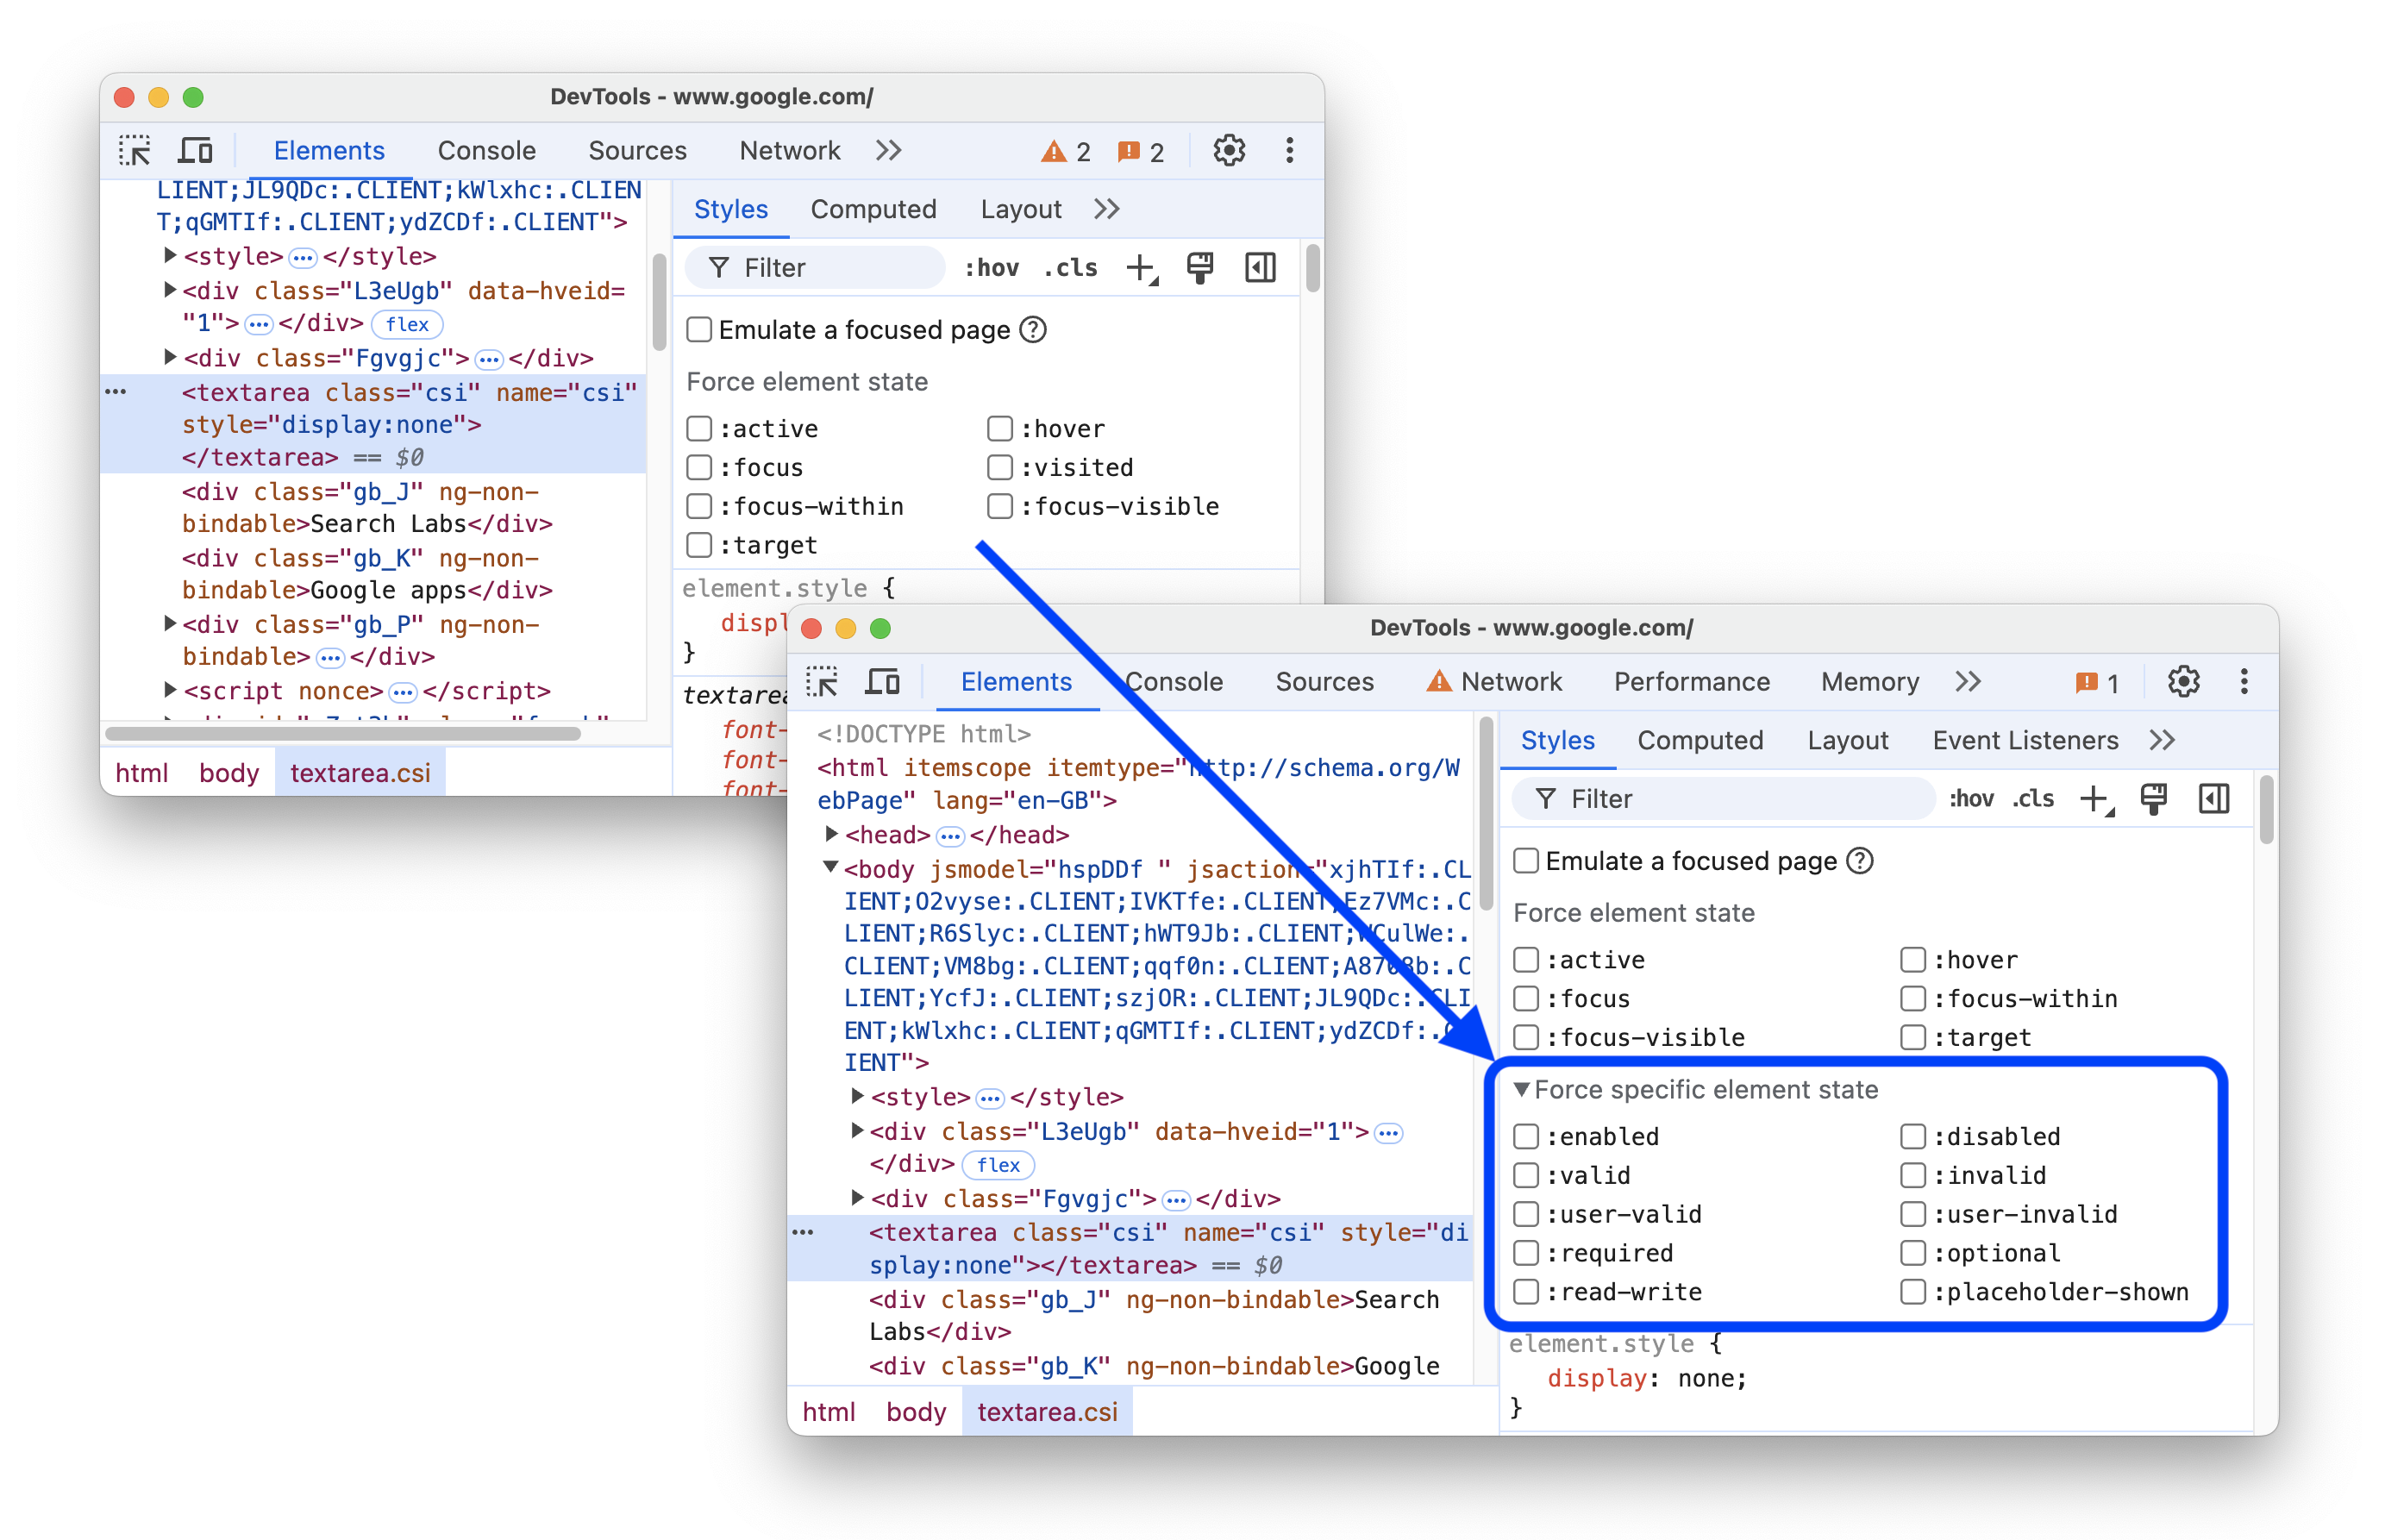
Forzar más estados para elementos específicos
La sección :hov en Elements > Styles ahora te proporciona más seudoclases que puedes habilitar de forma forzada. El nuevo conjunto de opciones se encuentra en el menú desplegable del estado Forzar elemento específico y es específico para ciertos elementos que selecciones. Por ejemplo, <label> y <input> tienen diferentes conjuntos de opciones.
Problema de Chromium: 40280012.
Ahora, Elementos > Estilos autocompleta más propiedades de cuadrícula
La pestaña Elements > Styles ahora proporciona opciones de autocompletado cuando editas los nombres de las líneas y las áreas de la cuadrícula.
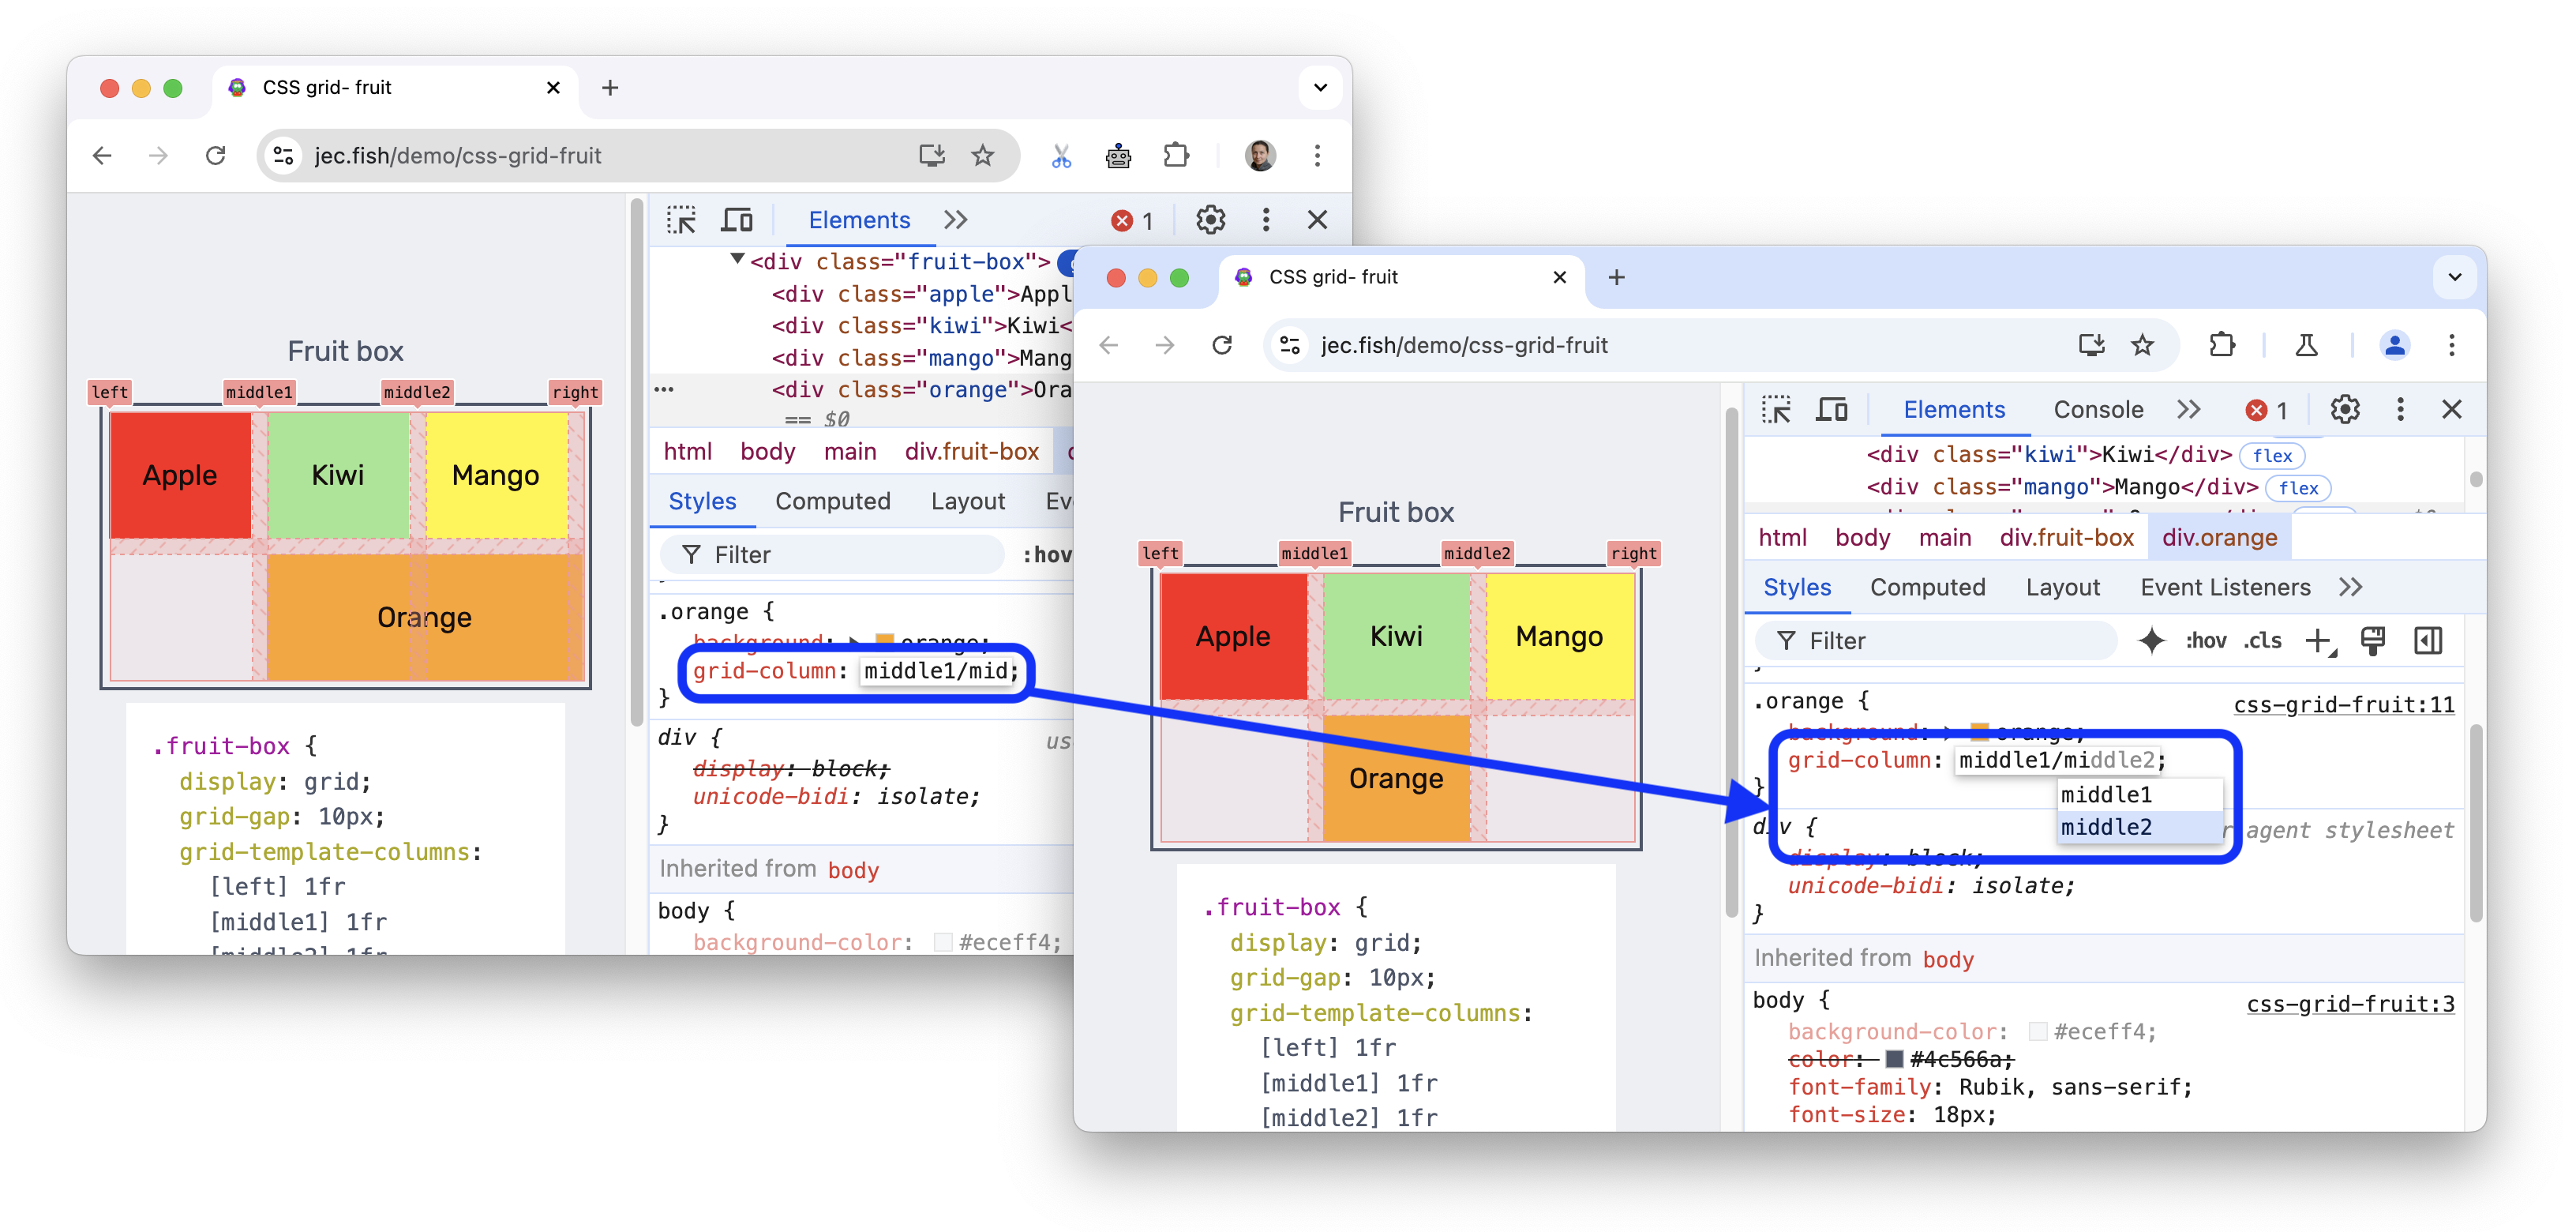
Para obtener más información, consulta Cómo inspeccionar diseños de cuadrícula CSS y, en particular, su sección Mostrar nombres de líneas.
Lighthouse 12.2.0
El panel Lighthouse ahora ejecuta Lighthouse 12.2.0.
Esta actualización incluye varias correcciones de errores. Consulta la lista completa de cambios.
Para conocer los conceptos básicos del uso del panel Lighthouse en las Herramientas para desarrolladores, consulta Lighthouse: Optimiza la velocidad del sitio web.
Error de Chromium: 772558.
Otros aspectos destacados
Estas son algunas de las correcciones y mejoras más importantes de esta versión:
- Elementos:
- Se corrigió un error relacionado con el procesamiento incorrecto de las propiedades de longitud sobrecargadas 357020613.
- Se cambió el nombre de
position-try-optionsaposition-try-fallbackssegún la especificación. - Ahora, la actualización de la página restablece el nodo seleccionado incluso dentro de un iframe 40719145.
- Accesibilidad: Los lectores de pantalla ahora anunciarán el botón Mostrar elemento 357382536.
- Rendimiento > Red: La opción de menú Revelar en Red ahora abre la pestaña Encabezados de la solicitud de red pertinente.
- Consola:
- Memoria: Se corrigió un error por el que no aparecía la opción para restablecer los retenedores ignorados después de ignorar uno 327337527.
Descarga los canales de vista previa
Considera usar Chrome Canary, Dev o Beta como tu navegador de desarrollo predeterminado. Estos canales de versión preliminar te brindan acceso a las funciones más recientes de DevTools, te permiten probar las APIs de vanguardia de la plataforma web y te ayudan a encontrar problemas en tu sitio antes de que lo hagan tus usuarios.
Comunícate con el equipo de Herramientas para desarrolladores de Chrome
Usa las siguientes opciones para hablar sobre las funciones nuevas, las actualizaciones o cualquier otro tema relacionado con Herramientas para desarrolladores.
- Envíanos tus comentarios y solicitudes de funciones a crbug.com.
- Informa un problema de Herramientas para desarrolladores con Más opciones > Ayuda > Informar un problema de Herramientas para desarrolladores en Herramientas para desarrolladores.
- Envía un tuit a @ChromeDevTools.
- Deja comentarios en los videos de Novedades de las Herramientas para desarrolladores de YouTube o en los videos de Sugerencias sobre las Herramientas para desarrolladores de YouTube.
Novedades de Herramientas para desarrolladores
Una lista de todo lo que se abordó en la serie Novedades de DevTools
- Actualizaciones del servidor de MCP de las Herramientas para desarrolladores
- Mejoras en el uso compartido de rutas
- Compatibilidad con @starting-style
- Widget del editor para la visualización: mampostería
- Lighthouse 13
- Sugerencias de código de Gemini
- Mejoras en el servidor de MCP de Herramientas para desarrolladores
- Acceso más rápido a la asistencia de IA
- Cómo depurar el registro de rendimiento completo con Gemini
- Activar o desactivar la orientación del panel lateral
- Programa para desarrolladores de Google
- Otros aspectos destacados
- Herramientas para desarrolladores de Chrome (MCP) para tu agente de IA
- Cómo depurar el árbol de dependencias de red con Gemini
- Cómo exportar tus chats con Gemini
- Configuración de seguimiento persistente en el panel Rendimiento
- Cómo filtrar solicitudes de red protegidas por IP
- La pestaña Elements > Layout agrega compatibilidad con el diseño de mampostería
- Lighthouse 12.8.2
- Otros aspectos destacados
- Depura más estadísticas con Gemini
- Emula el encabezado "Save-Data" en "Condiciones de red"
- Cómo ver el estado de Baseline en la información sobre herramientas de una propiedad de CSS
- Cómo anular los factores de forma en las sugerencias de clientes de usuario-agente
- Lighthouse 12.8.0
- Otros aspectos destacados
- Herramientas para desarrolladores de Chrome más confiables y productivas
- Cómo subir imágenes en la asistencia de IA para el diseño
- Cómo agregar encabezados de solicitud a la tabla en Red
- Consulta los momentos destacados de Google I/O 2025
- Otros aspectos destacados
- Mejoras en el panel Rendimiento
- Orígenes conectados previamente en la estadística "Árbol de dependencias de red"
- Tiempos de respuesta y redireccionamiento del servidor en la estadística "Latencia de solicitud de documento"
- Redireccionamientos en el resumen de solicitudes de red
- Se redujo el ruido en el registro de rendimiento
- Se dejó de usar "Inhabilitar las muestras de JavaScript"
- Parámetro de precisión de la ubicación geográfica en Sensors
- Mejoras en el panel Elementos
- Depura valores de CSS complejos con mayor facilidad
- Compatibilidad con@function en Elements > Styles
- Mejoras en el panel de red
- Filtro has-request-header
- Sockets directos en apps web aisladas
- Otros aspectos destacados
- Accesibilidad
- Edición de Google I/O 2025
- Cómo modificar y guardar cambios de CSS en tu espacio de trabajo con Gemini
- Conecta una carpeta del espacio de trabajo y guarda los cambios en tus archivos fuente
- Pregúntale a Gemini sobre las estadísticas de rendimiento
- Anota los resultados del rendimiento con Gemini
- Agrega capturas de pantalla a tus chats con Gemini
- Nuevos análisis en el panel Rendimiento
- JavaScript duplicado
- JavaScript heredado
- Las especulaciones ahora admiten etiquetas de reglas
- Lighthouse 12.6.0
- Otros aspectos destacados
- Accesibilidad
- Mejoras en el panel Rendimiento
- Nuevos estadísticas de rendimiento
- Haz clic para destacar
- Tiempos del servidor en el resumen de solicitudes de red
- Cómo filtrar cookies en "Privacidad y seguridad"
- Tamaños en unidades de kB en tablas de todos los paneles
- La función de autocompletar admite corner-shape y corner-*-shape en Elements > Styles
- Experimental: Destaca problemas con elementos y atributos en el DOM
- Lighthouse 12.5.0
- Otros aspectos destacados
- Mejoras en el panel Rendimiento
- Vínculos de origen y de secuencia de comandos para las llamadas a perfiles y funciones en Rendimiento
- Compatibilidad con datos de campo de LCP por fase
- Estadística del árbol de dependencias de red
- Duración en lugar de tiempo total y propio en Resumen
- Destacado de la pila más pesada
- Se mejoraron los estados vacíos de varios paneles
- Vista de árbol de accesibilidad en Elements
- Lighthouse 12.4.0
- Otros aspectos destacados
- Panel de privacidad y seguridad
- Mejoras en el panel Rendimiento
- Ajustes predeterminados de limitación de la CPU calibrados
- Selecciona diferentes eventos de rendimiento en el mismo chat de IA
- Destacado de datos propios y de terceros en Rendimiento
- Datos de campo en las sugerencias y las estadísticas de la herramienta de marcadores
- Estadística de reprocesamiento forzado
- Estadística "Optimiza el tamaño del DOM"
- Extiende el registro de rendimiento con console.timeStamp
- Mejoras en el panel Elementos
- Valores en tiempo real de los estilos animados
- Compatibilidad con la seudoclase :open y varios seudoelementos
- Copiar todos los mensajes de la consola
- Unidades de bytes en el panel Memoria
- Otros aspectos destacados
- Historial de chat persistente de IA
- Mejoras en el panel Rendimiento
- Estadística de publicación de imágenes
- Navegación con teclado clásica y moderna
- Cómo ignorar los lenguajes de secuencias de comandos irrelevantes en el gráfico de llamas
- Marcador de línea de tiempo y resaltado de rango al colocar el cursor
- Configuración de limitación recomendada
- Marcadores de tiempos en una superposición
- Seguimiento de pila de llamadas de JS en Summary
- Se movió la configuración de insignias al menú en Elementos
- Nuevo panel "Novedades"
- Lighthouse 12.3.0
- Otros aspectos destacados
- Cómo depurar solicitudes de red, archivos fuente y registros de rendimiento con Gemini
- Cómo ver el historial de chat de IA
- Administra el almacenamiento de extensiones en Application > Storage
- Mejoras en el rendimiento
- Fases de interacción en las métricas en vivo
- Información de bloqueo de la renderización en la pestaña Resumen
- Compatibilidad con los eventos de scheduler.postTask y sus flechas de iniciador
- Mejoras en el panel Animations y en la pestaña Elements > Styles
- Cómo saltar de Elements > Styles a Animations
- Actualizaciones en tiempo real en la pestaña Calculado
- Emulación de la presión de procesamiento en Sensors
- Objetos JS con el mismo nombre agrupados por fuente en el panel Memoria
- Nuevo aspecto de la configuración
- El panel Estadísticas de rendimiento está obsoleto y se quitó de Herramientas para desarrolladores
- Otros aspectos destacados
- Depura CSS con Gemini
- Controla las funciones potenciadas por IA en una pestaña de configuración dedicada
- Mejoras en el panel Rendimiento
- Anota y comparte los resultados de rendimiento
- Obtén estadísticas de rendimiento directamente en el panel Rendimiento
- Detecta los cambios de diseño excesivos con mayor facilidad
- Cómo detectar las animaciones no compuestas
- La simultaneidad del hardware se traslada a Sensors
- Ignora las secuencias de comandos anónimas y enfócate en tu código en los seguimientos de pila
- Elements > Styles: Compatibilidad con los modos de escritura sideways-* para las superposiciones de cuadrícula y las palabras clave de CSS
- Auditorías de Lighthouse para páginas que no son HTTP en los modos de período y resumen
- Mejoras de accesibilidad
- Otros aspectos destacados
- Mejoras en el panel de red
- Se rediseñaron los filtros de red
- Las exportaciones de HAR ahora excluyen los datos sensibles de forma predeterminada
- Mejoras en el panel Elementos
- Valores de autocompletar para las propiedades text-emphasis-*
- Desbordamientos de desplazamiento marcados con una insignia
- Mejoras en el panel Rendimiento
- Recomendaciones en las métricas en vivo
- Navega por las rutas de navegación
- Mejoras en el panel de memoria
- Nuevo perfil "Elementos desconectados"
- Se mejoró la nomenclatura de los objetos JS simples
- Cómo desactivar los temas dinámicos
- Chrome Experiment: Process sharing (Chrome Experiment: Uso compartido de procesos)
- Lighthouse 12.2.1
- Otros aspectos destacados
- Recorder admite la exportación a Puppeteer para Firefox
- Mejoras en el panel Rendimiento
- Observaciones de métricas en vivo
- Solicitudes de búsqueda en el registro de red
- Cómo ver los seguimientos de pila de las llamadas a performance.mark y performance.measure
- Cómo usar datos de direcciones de prueba en el panel de Autocompletar
- Mejoras en el panel Elementos
- Forzar más estados para elementos específicos
- Ahora, Elementos > Estilos autocompleta más propiedades de cuadrícula
- Lighthouse 12.2.0
- Otros aspectos destacados
- Las estadísticas de la consola de Gemini estarán disponibles en la mayoría de los países europeos
- Actualizaciones del panel de rendimiento
- Pista de red mejorada
- Personaliza los datos de rendimiento con la API de extensibilidad
- Detalles en el segmento Timings
- Copiar todas las solicitudes que aparecen en el panel de red
- Instantáneas del montón más rápidas con etiquetas HTML con nombre y menos desorden
- Abre el panel de animaciones para capturar animaciones y editar @keyframes en vivo
- Lighthouse 12.1.0
- Mejoras de accesibilidad
- Otros aspectos destacados
- Cómo inspeccionar el posicionamiento de anclaje de CSS en el panel de Elements
- Mejoras en el panel Sources
- Mejora de "Nunca detener aquí"
- Nuevos objetos de escucha de eventos de ajuste de desplazamiento
- Mejoras en el panel de red
- Se actualizaron los ajustes predeterminados de limitación de la red
- Información del Service Worker en los campos personalizados del formato HAR
- Cómo enviar y recibir eventos de WebSocket en el panel Rendimiento
- Otros aspectos destacados
- Mejoras en el panel Rendimiento
- Cómo mover y ocultar pistas con el modo de configuración de pistas actualizado
- Cómo ignorar secuencias de comandos en el gráfico de llamas
- Reduce la velocidad de la CPU 20 veces
- El panel Estadísticas de rendimiento quedará obsoleto
- Cómo encontrar un uso excesivo de memoria con los nuevos filtros en las instantáneas de pila
- Inspecciona los buckets de almacenamiento en Application > Storage
- Inhabilita las advertencias de XSS propio con una marca de línea de comandos
- Lighthouse 12.0.0
- Otros aspectos destacados
- Comprende mejor los errores y las advertencias en la consola con Gemini
- Compatibilidad con reglas@position-try en Elements > Styles
- Mejoras en el panel Sources
- Cómo configurar el cierre de corchetes y el formato automático
- Las promesas rechazadas controladas se reconocen como capturadas
- Causas de los errores en la consola
- Mejoras en el panel de red
- Cómo inspeccionar los encabezados de Early Hints
- Oculta la columna Cascada
- Mejoras en el panel Rendimiento
- Captura las estadísticas del selector CSS
- Cómo cambiar el orden y ocultar pistas
- Cómo ignorar los retenedores en el panel de Memory
- Lighthouse 11.7.1
- Otros aspectos destacados
- Nuevo panel de Autocompletar
- Mejora de la limitación de red para WebRTC
- Compatibilidad con animaciones basadas en el desplazamiento en el panel de animaciones
- Se mejoró la compatibilidad con el anidamiento de CSS en Elements > Styles
- Panel de rendimiento mejorado
- Cómo ocultar funciones y sus elementos secundarios en el gráfico de llamas
- Flechas desde los iniciadores seleccionados hasta los eventos que iniciaron
- Lighthouse 11.6.0
- Sugerencias sobre categorías especiales en Memory > Heap snapshots
- Aplicación > Actualizaciones de almacenamiento
- Bytes usados para el almacenamiento compartido
- Web SQL dejó de estar disponible por completo
- Mejoras en el panel de cobertura
- Es posible que el panel Capas deje de estar disponible
- Baja del generador de perfiles de JavaScript: Fase cuatro, final
- Otros aspectos destacados
- Encuentra el huevo de Pascua
- Actualizaciones del panel Elements
- Cómo emular una página enfocada en Elements > Styles
- Selector de color, reloj de ángulos y editor de aceleración en
var()de resguardo - La herramienta de longitud de CSS está obsoleta
- Ventana emergente para el resultado de la búsqueda seleccionado en Rendimiento > Pista principal
- Actualizaciones del panel Network
- Botón Borrar y filtro de búsqueda en la pestaña Red > EventStream
- Sugerencias con motivos de exención para las cookies de terceros en Red > Cookies
- Habilita e inhabilita todos los puntos de interrupción en Sources
- Cómo ver los secuencias de comandos cargados en Herramientas para desarrolladores para Node.js
- Lighthouse 11.5.0
- Mejoras de accesibilidad
- Otros aspectos destacados
- Ya está disponible la colección oficial de extensiones de Grabadora
- Mejoras en la red
- Motivo del error en la columna Estado
- Submenú Improved Copy
- Mejoras en el rendimiento
- Migas de pan en Rutas
- Iniciadores de eventos en el segmento principal
- Menú de selección de instancias de VM de JavaScript para las Herramientas para desarrolladores de Node.js
- Nuevo acceso directo y comando en Sources
- Mejoras en los elementos
- El seudoelemento ::view-transition ahora se puede editar en Styles
- Compatibilidad de la propiedad align-content con contenedores de bloques
- Compatibilidad con la postura para dispositivos plegables emulados
- Creación de temas dinámicos
- Advertencias sobre la eliminación gradual de las cookies de terceros en los paneles Network y Application
- Lighthouse 11.4.0
- Mejoras de accesibilidad
- Otros aspectos destacados
- Mejoras en los elementos
- Barra de filtros optimizada en el panel Network
@font-palette-valuesasistencia- Caso admitido: Propiedad personalizada como alternativa de otra propiedad personalizada
- Compatibilidad mejorada con mapas de fuentes
- Mejoras en el panel Rendimiento
- Pista de interacciones mejoradas
- Filtrado avanzado en las pestañas Bottom-Up, Call Tree y Event Log
- Marcadores de sangría en el panel Sources
- Sugerencias útiles para los encabezados y el contenido anulados en el panel Network
- Nuevas opciones del menú de comandos para agregar y quitar patrones de bloqueo de solicitudes
- Se quitó el experimento de incumplimientos de CSP
- Lighthouse 11.3.0
- Mejoras de accesibilidad
- Otros aspectos destacados
- Eliminación gradual de las cookies de terceros
- Analiza las cookies de tu sitio web con Privacy Sandbox Analysis Tool
- Función de ignorar la ficha mejorada
- Patrón de exclusión predeterminado para node_modules
- Las excepciones detectadas ahora detienen la ejecución si se detectan o pasan por código no ignorado
- Se cambió el nombre de
x_google_ignoreListporignoreListen los mapas de origen - Nuevo botón de activación del modo de entrada durante la depuración remota
- El panel Elements ahora muestra URLs para los nodos #document
- Política de seguridad del contenido efectiva en el panel Aplicación
- Depuración de animaciones mejorada
- Diálogo "¿Este código es de confianza?" en Sources y advertencia de XSS propio en Console
- Puntos de interrupción del objeto de escucha de eventos en Web Workers y worklets
- La nueva insignia de medios para
<audio>y<video> - Se cambió el nombre de la carga previa a carga especulativa
- Lighthouse 11.2.0
- Mejoras de accesibilidad
- Otros aspectos destacados
- Se mejoró la sección @property en Elements > Styles
- Regla de @property editable
- Se informan problemas con reglas @property no válidas
- Se actualizó la lista de dispositivos para emular
- Imprimir de forma legible el código JSON intercalado en las etiquetas de secuencia de comandos en Sources
- Autocompletar campos privados en la consola
- Lighthouse 11.1.0
- Mejoras de accesibilidad
- Baja de Web SQL
- Validación de la relación de aspecto de capturas de pantalla en Application > Manifest
- Otros aspectos destacados
- Nueva sección para propiedades personalizadas en Elementos > Estilos
- Más mejoras en las anulaciones locales
- Búsqueda mejorada
- Panel Sources mejorado
- Espacio de trabajo optimizado en el panel Sources
- Cómo reordenar los paneles en Sources
- Destacado de sintaxis y formato de impresión para más tipos de secuencias de comandos
- Emular la función de medios prefers-reduced-transparency
- Lighthouse 11
- Mejoras de accesibilidad
- Otros aspectos destacados
- Mejoras en el panel de red
- Anula el contenido web de forma local aún más rápido
- Cómo anular el contenido de las solicitudes de XHR y de recuperación
- Cómo ocultar solicitudes de extensiones de Chrome
- Códigos de estado HTTP legibles
Rendimiento: Consulta los cambios en la prioridad de recuperación de los eventos de red
- Configuración de Sources habilitada de forma predeterminada: Plegado de código y revelación automática de archivos
- Se mejoró la depuración de los problemas relacionados con las cookies de terceros
- Colores nuevos
- Lighthouse 10.4.0
- Cómo depurar la precarga en el panel Application
- La extensión de depuración de C/C++ WebAssembly para Herramientas para desarrolladores ahora es de código abierto
- Otros aspectos destacados
- (Experimental) Nueva emulación de renderización: prefers-reduced-transparency
- (Experimental) Supervisión de protocolos mejorada
- Se mejoró la depuración de las hojas de estilo faltantes
- Compatibilidad con la sincronización lineal en Elements > Styles > Easing Editor
- Compatibilidad con buckets de almacenamiento y vista de metadatos
- Lighthouse 10.3.0
- Accesibilidad: Comandos de teclado y lectura de pantalla mejorada
- Otros aspectos destacados
- Mejoras en los elementos
- Nueva insignia de subred de CSS
- Especificidad del selector en los cuadros de información
- Valores de las propiedades de CSS personalizadas en las sugerencias
- Mejoras en las fuentes
- Destacado de sintaxis de CSS
- Atajo para establecer puntos de interrupción condicionales
- Aplicación > Mitigaciones del seguimiento por rebote
- Lighthouse 10.2.0
- Ignorar las secuencias de comandos de contenido de forma predeterminada
- Red > Mejoras en la respuesta
- Otros aspectos destacados
- Compatibilidad con la depuración de WebAssembly
- Mejor comportamiento de paso en las apps de Wasm
- Cómo depurar Autocompletar con el panel Elements y la pestaña Issues
- Aserciones en Recorder
- Lighthouse 10.1.1
- Mejoras de rendimiento
- performance.mark() muestra los tiempos cuando se coloca el cursor sobre Rendimiento > Tiempos
- El comando profile() completa Performance > Main
- Advertencia sobre interacciones lentas del usuario
- Actualizaciones de Métricas web
- Baja del Generador de perfiles de JavaScript: Fase tres
- Otros aspectos destacados
- Cómo anular los encabezados de respuesta de red
- Mejoras en la depuración de Nuxt, Vite y Rollup
- Mejoras en CSS en Elements > Styles
- Propiedades y valores de CSS no válidos
- Vínculos a fotogramas clave en la propiedad abreviada de animación
- Nuevo parámetro de configuración de la consola: Autocompletar al presionar Intro
- El menú de comandos enfatiza los archivos creados
- Baja del Generador de perfiles de JavaScript: etapa dos
- Otros aspectos destacados
- Actualizaciones del Grabador
- Extensiones de repetición de la grabadora
- Cómo grabar con selectores de perforación
- Cómo exportar grabaciones como secuencias de comandos de Puppeteer con análisis de Lighthouse
- Cómo obtener extensiones para la Grabadora
- Actualizaciones de Elements > Styles
- Documentación de CSS en el panel Styles
- Compatibilidad con el anidamiento de CSS
- Cómo marcar puntos de registro y puntos de interrupción condicionales en la consola
- Cómo ignorar secuencias de comandos irrelevantes durante la depuración
- Se inició la baja del generador de perfiles de JavaScript
- Emular el contraste reducido
- Lighthouse 10
- Otros aspectos destacados
- Cómo depurar el color en HD con el panel Styles
- UX de puntos de interrupción mejorada
- Combinaciones de teclas personalizables de Grabadora
- Mejor resaltado de sintaxis para Angular
- Reorganiza las memorias caché en el panel Application
- Otros aspectos destacados
- Borrado del panel de rendimiento al volver a cargar la página
- Actualizaciones del Grabador
- Cómo ver y destacar el código de tu flujo de usuarios en el Recorder
- Cómo personalizar los tipos de selectores de una grabación
- Cómo editar un flujo de usuarios durante la grabación
- Impresión automática y legible en el lugar
- Mejor resaltado de sintaxis y vista previa intercalada para Vue, SCSS y mucho más
- Autocompletar ergonómico y coherente en la consola
- Otros aspectos destacados
- Grabador: Opciones de copiar como para los pasos, reproducción en la página y menú contextual del paso
- Mostrar los nombres reales de las funciones en las grabaciones de rendimiento
- Nuevas combinaciones de teclas en los paneles Console y Sources
- Depuración de JavaScript mejorada
- Otros aspectos destacados
- [Experimental] UX mejorada en la administración de puntos de interrupción
- [Experimental] Formato automático en el lugar
- Sugerencias para propiedades de CSS inactivas
- Detección automática de selectores XPath y de texto en el panel de la grabadora
- Cómo recorrer expresiones separadas por comas
- Mejoramos el parámetro de configuración de la lista de ignorados
- Otros aspectos destacados
- Cómo personalizar las combinaciones de teclas en DevTools
- Cómo activar o desactivar los temas claro y oscuro con una combinación de teclas
- Cómo destacar objetos de C/C++ en el Inspector de memoria
- Se admite la información completa del iniciador para la importación de HAR
- Iniciar la búsqueda en el DOM después de presionar
Enter - Muestra los íconos
startyendpara las propiedades de Flexbox de CSSalign-content - Otros aspectos destacados
- Agrupa los archivos por escrito o implementado en el panel Fuentes
- Registros de seguimiento de pila vinculados para operaciones asíncronas
- Ignorar automáticamente las secuencias de comandos de terceros conocidas
- Pila de llamadas mejorada durante la depuración
- Cómo ocultar las fuentes de la lista de elementos ignorados en el panel Fuentes
- Cómo ocultar los archivos incluidos en la lista de ignorados en el menú de comandos
- Nuevo segmento Interactions en el panel Performance
- Desglose de los tiempos del LCP en el panel de estadísticas de rendimiento
- Generar automáticamente un nombre predeterminado para las grabaciones en el panel de la Grabadora
- Otros aspectos destacados
- Repetición paso a paso en la Grabadora
- Compatibilidad con el evento de desplazamiento del mouse en el panel de Grabadora
- Procesamiento de imagen con contenido más grande (LCP) en el panel de estadísticas de rendimiento
- Identifica los destellos de texto (FOIT y FOUT) como posibles causas raíz de los cambios de diseño
- Controladores de protocolos en el panel Manifest
- Insignia de capa superior en el panel de elementos
- Cómo adjuntar información de depuración de Wasm en el tiempo de ejecución
- Compatibilidad con la edición en vivo durante la depuración
- Cómo ver y editar reglas @scope en el panel Styles
- Mejoras en los mapas de origen
- Otros aspectos destacados
- Reinicia el marco durante la depuración
- Opciones de reproducción lenta en el panel de Grabadora
- Crea una extensión para el panel de la grabadora
- Agrupa los archivos por escrito o implementado en el panel Fuentes
- Nuevo seguimiento de Tiempos de usuario en el panel de estadísticas de rendimiento
- Cómo revelar la ranura asignada de un elemento
- Simula la simultaneidad del hardware para las grabaciones de rendimiento
- Obtén una vista previa del valor no relacionado con el color cuando se autocompletan las variables de CSS
- Cómo identificar los marcos de bloqueo en el panel Memoria caché atrás/adelante
- Sugerencias de autocompletado mejoradas para objetos de JavaScript
- Mejoras en los mapas de origen
- Otros aspectos destacados
- Cómo capturar eventos de doble clic y clic con el botón derecho en el panel del Grabador
- Nuevo modo de período y resumen en el panel de Lighthouse
- Se mejoró el control de zoom en el panel de Performance Insights
- Confirmar la eliminación de una grabación de rendimiento
- Cómo reordenar los paneles en el panel de Elements
- Cómo elegir un color fuera del navegador
- Mejoras en la vista previa de valores intercalados durante la depuración
- Compatibilidad con BLOBs grandes para autenticadores virtuales
- Nuevas combinaciones de teclas en el panel Sources
- Mejoras en los mapas de origen
- Función en versión preliminar: Nuevo panel de Estadísticas de rendimiento
- Nuevos atajos para emular temas claros y oscuros
- Seguridad mejorada en la pestaña Network Preview
- Mejora de la recarga en el punto de interrupción
- Actualizaciones de Console
- Cancela la grabación del flujo del usuario al inicio
- Mostrar los seudoelementos destacados heredados en el panel Styles
- Otros aspectos destacados
- [Experimental] Copiar cambios de CSS
- [Experimental] Selección de color fuera del navegador
- Cómo importar y exportar flujos de usuarios grabados como un archivo JSON
- Cómo ver las capas en cascada en el panel Estilos
- Compatibilidad con la función de color
hwb() - Se mejoró la visualización de las propiedades privadas
- Otros aspectos destacados
- [Experimental] Nuevo modo de período y resumen en el panel de Lighthouse
- Cómo ver y editar reglas @supports en el panel Styles
- Compatibilidad con selectores comunes de forma predeterminada
- Cómo personalizar el selector de grabaciones
- Cómo cambiar el nombre de una grabación
- Vista previa de las propiedades de la clase o la función cuando se coloca el cursor sobre ellas
- Marcos presentados de forma parcial en el panel Rendimiento
- Otros aspectos destacados
- Limitación de solicitudes de WebSocket
- Nuevo panel de la API de Reporting en el panel Application
- Compatibilidad con la espera hasta que el elemento esté visible o se pueda hacer clic en él en el panel de la grabadora
- Mejor formato, filtrado y aplicación de estilos en la consola
- Cómo depurar una extensión de Chrome con archivos de mapa de origen
- Se mejoró el árbol de carpetas de origen en el panel Fuentes
- Cómo mostrar los archivos fuente del trabajador en el panel Sources
- Actualizaciones del tema oscuro automático de Chrome
- Selector de color y panel dividido aptos para pantallas táctiles
- Otros aspectos destacados
- Función en versión preliminar: Árbol de accesibilidad de página completa
- Cambios más precisos en la pestaña Cambios
- Establece un tiempo de espera más largo para la grabación del flujo de usuarios
- Asegúrate de que tus páginas se puedan almacenar en caché con la pestaña Memoria caché atrás/adelante
- Nuevo filtro del panel Propiedades
- Cómo emular la función de medios forced-colors de CSS
- Comando para mostrar reglas al colocar el cursor encima
- Compatibilidad con
row-reverseycolumn-reverseen el editor de Flexbox - Nuevas combinaciones de teclas para volver a reproducir XHR y expandir todos los resultados de la búsqueda
- Lighthouse 9 en el panel de Lighthouse
- Panel Sources mejorado
- Otros aspectos destacados
- [Experimental] Endpoints in the Reporting API pane
- Función en versión preliminar: Nuevo panel de la Grabadora
- Actualiza la lista de dispositivos en el Modo de dispositivo
- Autocompletar con Editar como HTML
- Experiencia mejorada de depuración de código
- Sincronización de la configuración de Herramientas para desarrolladores en varios dispositivos
- Función en versión preliminar: Nuevo panel Resumen de CSS
- Se restableció y mejoró la experiencia de edición y copia de la longitud del CSS
- Cómo emular la función de medios prefers-contrast de CSS
- Cómo emular la función de Tema oscuro automático de Chrome
- Cómo copiar declaraciones como JavaScript en el panel Styles
- Nueva pestaña Carga útil en el panel Red
- Se mejoró la visualización de las propiedades en el panel Propiedades
- Opción para ocultar los errores de CORS en la consola
- Vista previa y evaluación adecuadas de los objetos
Intlen la consola - Seguimientos de pila asíncronos coherentes
- Cómo conservar la barra lateral de la consola
- Se quitó el panel Application Cache del panel Application
- [Experimental] Nuevo panel de la API de Reporting en el panel Application
- Nuevas herramientas de creación de longitud de CSS
- Cómo ocultar problemas en la pestaña Problemas
- Se mejoró la visualización de las propiedades
- Lighthouse 8.4 en el panel de Lighthouse
- Cómo ordenar los fragmentos en el panel de fuentes
- Nuevos vínculos a las notas de la versión traducidas y para informar errores de traducción
- IU mejorada para el menú de comandos de Herramientas para desarrolladores
- Usa Herramientas para desarrolladores en tu idioma preferido
- Nuevos dispositivos Nest Hub en la lista de dispositivos
- Pruebas de origen en la vista Detalles del fotograma
- Nueva insignia de consultas de contenedores de CSS
- Nueva casilla de verificación para invertir los filtros de red
- Próxima baja de la barra lateral de la consola
- Mostrar encabezados
Set-Cookiessin procesar en la pestaña Problemas y el panel Red - Los descriptores de acceso nativos se muestran de forma coherente como propiedades propias en la consola
- Seguimiento de pila de errores adecuado para secuencias de comandos intercaladas con #sourceURL
- Cómo cambiar el formato de color en el panel Computed
- Reemplaza las sugerencias personalizadas por sugerencias HTML nativas
- [Experimental] Hide issues in the Issues tab
- Consultas de contenedor de CSS editables en el panel Styles
- Vista previa de paquetes web en el panel de red
- Depuración de la API de Attribution Reporting
- Mejor manejo de cadenas en la consola
- Depuración de CORS mejorada
- Lighthouse 8.1
- URL de nota nueva en el panel Manifiesto
- Se corrigieron los selectores coincidentes de CSS
- Impresión con formato de respuestas JSON en el panel Network
- Editor de cuadrícula de CSS
- Compatibilidad con las redeclaraciones de
consten la consola - Visor del orden de la fuente
- Nuevo acceso directo para ver los detalles del marco
- Compatibilidad mejorada con la depuración de CORS
- Cambia el nombre de la etiqueta XHR a Fetch/XHR
- Cómo filtrar el tipo de recurso Wasm en el panel de red
- Sugerencias de clientes de User-Agent para dispositivos en la pestaña Network conditions
- Cómo informar problemas del modo de Quirks en la pestaña Problemas
- Incluye Compute Intersections en el panel Rendimiento
- Lighthouse 7.5 en el panel de Lighthouse
- Se dejó de usar el menú contextual "Reiniciar frame" en la pila de llamadas
- [Experimental] Protocol monitor
- [Experimental] Grabadora de Puppeteer
- Ventana emergente de información de las Métricas web
- Nuevo Inspector de memoria
- Visualiza el ajuste de desplazamiento de CSS
- Nuevo panel de configuración de insignias
- Vista previa de imágenes mejorada con información sobre la relación de aspecto
- Nuevo botón de condiciones de red con opciones para configurar
Content-Encodings - Atajo para ver el valor calculado
- Palabra clave
accent-color - Categoriza los tipos de problemas con colores e íconos
- Cómo borrar tokens de confianza
- Funciones bloqueadas en la vista Detalles del marco
- Cómo filtrar experimentos en el parámetro de configuración Experimentos
- Nueva columna
Vary Headeren el panel Cache storage - Compatibilidad con la verificación de marca privada de JavaScript
- Compatibilidad mejorada para la depuración de puntos de interrupción
- Vista previa de la compatibilidad al colocar el cursor sobre el elemento con la notación
[] - Esquema mejorado de los archivos HTML
- Seguimientos de pila de errores adecuados para la depuración de Wasm
- Nuevas herramientas de depuración de Flexbox de CSS
- Nueva superposición de Core Web Vitals
- Se trasladó el recuento de problemas a la barra de estado de Console
- Informa problemas de Trusted Web Activity
- Cómo dar formato a cadenas como literales de cadena de JavaScript (válidos) en la consola
- Nuevo panel de Trust Tokens en el panel de Application
- Cómo emular la función de medios de CSS color-gamut
- Mejoras en las herramientas de las apps web progresivas
- Nueva columna
Remote Address Spaceen el panel Network - Mejoras en el rendimiento
- Cómo mostrar las funciones permitidas o no permitidas en la vista Detalles del fotograma
- Nueva columna
SamePartyen el panel Cookies - Se dejó de admitir el objeto
fn.displayNameno estándar obsoleto - Baja de
Don't show Chrome Data Saver warningen el menú Configuración - [Experimental] Informes automáticos de problemas de contraste bajo en la pestaña Problemas
- [Experimental] Vista completa del árbol de accesibilidad en el panel de elementos
- Compatibilidad con la depuración de incumplimientos de Trusted Types
- Tomar una captura de pantalla del nodo más allá de la ventana gráfica
- Nueva pestaña Trust Tokens para solicitudes de red
- Lighthouse 7 en el panel de Lighthouse
- Se agregó compatibilidad para forzar el estado
:targetde CSS - Nuevo acceso directo para duplicar elementos
- Selectores de color para propiedades de CSS personalizadas
- Nuevos atajos para copiar propiedades de CSS
- Nueva opción para mostrar las cookies decodificadas por URL
- Borrar solo las cookies visibles
- Nueva opción para borrar cookies de terceros en el panel Almacenamiento
- Cómo editar User-Agent Client Hints para dispositivos personalizados
- Persiste el parámetro de configuración "Registrar registro de red"
- Cómo ver las conexiones de WebTransport en el panel de red
- Se cambió el nombre de"En línea" a "Sin limitación"
- Nuevas opciones de copia en la consola, el panel Sources y el panel Styles
- Nueva información de Service Workers en la vista Detalles del frame
- Cómo medir la información de la memoria en la vista Detalles del fotograma
- Cómo proporcionar comentarios desde la pestaña Problemas
- Fotogramas descartados en el panel Rendimiento
- Cómo emular dispositivos plegables y con pantalla doble en el modo de dispositivo
- [Experimental] Automatiza las pruebas del navegador con Puppeteer Recorder
- [Experimental] Editor de fuentes en el panel Styles
- [Experimental] Herramientas de depuración de Flexbox de CSS
- [Experimental] Nueva pestaña de incumplimientos de CSP
- [Experimental] Nuevo cálculo del contraste de color: Algoritmo avanzado de contraste perceptual (APCA)
- Inicio más rápido de DevTools
- Nuevas herramientas de visualización de ángulos de CSS
- Cómo emular tipos de imágenes no compatibles
- Simula el tamaño de la cuota de almacenamiento en el panel Almacenamiento
- Nuevo carril de Métricas web en el panel Rendimiento
- Informa errores de CORS en el panel de red
- Información sobre el aislamiento de origen cruzado en la vista Detalles del fotograma
- Nueva información de Web Workers en la vista Detalles del fotograma
- Mostrar detalles del marco de apertura para las ventanas abiertas
- Cómo abrir el panel de red desde el panel de Service Workers
- Copiar valor de propiedad
- Copiar el seguimiento de pila del iniciador de red
- Obtén una vista previa del valor de la variable de Wasm cuando coloques el cursor sobre ella
- Cómo evaluar una variable de Wasm en la consola
- Unidades de medida coherentes para los tamaños de archivos y memoria
- Cómo destacar los seudoelementos en el panel de elementos
- [Experimental] Herramientas de depuración de CSS Flexbox
- [Experimental] Personaliza las combinaciones de teclas de acordes
- Nuevas herramientas de depuración de la cuadrícula de CSS
- Nueva pestaña de WebAuthn
- Cómo mover herramientas entre el panel superior y el inferior
- Nuevo panel lateral Computed en el panel Styles
- Cómo agrupar propiedades de CSS en el panel Computed
- Lighthouse 6.3 en el panel de Lighthouse
- Eventos de
performance.mark()en la sección Tiempos - Nuevos filtros
resource-typeyurlen el panel Network - Actualizaciones en la vista de detalles del marco
- Baja de
Settingsen el menú Más herramientas - [Experimental] Visualiza y corrige problemas de contraste de color en el panel Resumen de CSS
- [Experimental] Personaliza las combinaciones de teclas en DevTools
- Nuevo panel de medios
- Cómo tomar capturas de pantalla de nodos con el menú contextual del panel Elements
- Actualizaciones en la pestaña Problemas
- Emular las fuentes locales faltantes
- Cómo emular usuarios inactivos
- Emular
prefers-reduced-data - Compatibilidad con nuevas funciones de JavaScript
- Lighthouse 6.2 en el panel de Lighthouse
- Se dejó de mostrar la lista de "otros orígenes" en el panel Service Workers
- Mostrar el resumen de cobertura para los elementos filtrados
- Nueva vista de detalles del frame en el panel Application
- Sugerencia de color accesible en el panel Styles
- Cómo restablecer el panel Propiedades en el panel Elementos
- Valores de encabezado
X-Client-Datalegibles en el panel de red - Autocompletar fuentes personalizadas en el panel Estilos
- Mostrar el tipo de recurso de forma coherente en el panel Network
- Botones de borrado en los paneles Elements y Network
- Edición de estilos para frameworks de CSS-in-JS
- Lighthouse 6 en el panel de Lighthouse
- Baja de First Meaningful Paint (FMP)
- Compatibilidad con nuevas funciones de JavaScript
- Nuevas advertencias sobre accesos directos a apps en el panel de manifiesto
- Eventos
respondWithde Service Worker en la pestaña Timing - Visualización coherente del panel Computed
- Desplazamientos de código de bytes para archivos de WebAssembly
- Copia y corte por líneas en el panel Sources
- Actualizaciones de la configuración de Console
- Actualizaciones del panel de rendimiento
- Íconos nuevos para los puntos de interrupción, los puntos de interrupción condicionales y los puntos de registro
- Soluciona problemas del sitio con la nueva pestaña Problemas
- Cómo ver la información de accesibilidad en la información sobre herramientas del modo de inspección
- Actualizaciones del panel de rendimiento
- Terminología de promesas más precisa en la consola
- Actualizaciones del panel Estilos
- Obsolescencia del panel Propiedades en el panel Elementos
- Compatibilidad con accesos directos a aplicaciones en el panel Manifest
- Emula deficiencias de visión
- Cómo emular configuraciones regionales
- Depuración de la Política de incorporaciones de origen cruzado (COEP)
- Íconos nuevos para los puntos de interrupción, los puntos de interrupción condicionales y los puntos de registro
- Cómo ver las solicitudes de red que establecen una cookie específica
- Cómo anclar a la izquierda desde el menú de comandos
- Se movió la opción Configuración del menú principal
- El panel Audits ahora es el panel Lighthouse
- Cómo borrar todas las anulaciones locales de una carpeta
- Se actualizó la IU de tareas largas
- Compatibilidad con íconos adaptables en el panel Manifiesto
- Compatibilidad con Moto G4 en el Modo de dispositivo
- Actualizaciones relacionadas con las cookies
- Íconos del manifiesto de la app web más precisos
- Coloca el cursor sobre las propiedades de CSS
contentpara ver los valores sin escape - Errores de mapa de origen en la consola
- Parámetro de configuración para inhabilitar el desplazamiento después del final de un archivo
- Compatibilidad con las nuevas declaraciones de
letyclassen la consola - Mejoras en la depuración de WebAssembly
- Cadenas de iniciadores de solicitudes en la pestaña Iniciador
- Destaca la solicitud de red seleccionada en la pestaña Overview
- Columnas de URL y ruta en el panel de red
- Cadenas de usuario-agente actualizadas
- Nueva IU de configuración del panel Audits
- Modos de cobertura de código por función o por bloque
- Ahora, la cobertura del código debe iniciarse con una recarga de la página
- Cómo depurar por qué se bloqueó una cookie
- Ver valores de cookies
- Simula diferentes preferencias de prefers-color-scheme y prefers-reduced-motion
- Actualizaciones de la cobertura de código
- Cómo depurar por qué se solicitó un recurso de red
- Los paneles Console y Sources vuelven a respetar las preferencias de sangría
- Nuevas combinaciones de teclas para la navegación con el cursor
- Compatibilidad con varias cuentas de cliente en el panel Auditorías
- Depuración del controlador de pagos
- Lighthouse 5.2 en el panel Auditorías
- Largest Contentful Paint en el panel Rendimiento
- Cómo informar problemas de Herramientas para desarrolladores desde el menú principal
- Copiar los estilos de los elementos
- Visualiza los cambios de diseño
- Lighthouse 5.1 en el panel Auditorías
- Sincronización del tema del SO
- Combinación de teclas para abrir el editor de puntos de interrupción
- Memoria caché con carga previa en el panel de red
- Propiedades privadas cuando se visualizan objetos
- Notificaciones y mensajes push en el panel Application
- Autocompletar con valores de CSS
- Una nueva IU para la configuración de red
- Mensajes de WebSocket en exportaciones de HAR
- Botones de importación y exportación de HAR
- Uso de memoria en tiempo real
- Números de puerto de registro de Service Worker
- Cómo inspeccionar los eventos de Background Fetch y Background Sync
- Puppeteer para Firefox
- Sugerencias significativas cuando se autocompletan funciones de CSS
- Cómo borrar los datos del sitio desde el menú de comandos
- Ver todas las bases de datos de IndexedDB
- Ver el tamaño sin comprimir de un recurso cuando se coloca el cursor sobre él
- Puntos de interrupción intercalados en el panel Breakpoints
- Recuentos de recursos de IndexedDB y caché
- Parámetro de configuración para inhabilitar la información sobre la herramienta de inspección detallada
- Parámetro de configuración para activar o desactivar la sangría de tabulación en el editor
- Destaca todos los nodos afectados por la propiedad CSS
- Lighthouse v4 en el panel Audits
- Visor de mensajes binarios de WebSocket
- Captura de pantalla del área en el menú de comandos
- Filtros de Service Worker en el panel Network
- Actualizaciones del panel de rendimiento
- Tareas largas en las grabaciones del panel Rendimiento
- First Paint en la sección Timing
- Sugerencia adicional: Atajo para ver los códigos de color RGB y HSL (video)
- Puntos de registro
- Información sobre herramientas detallada en el modo de inspección
- Exporta datos de cobertura del código
- Cómo navegar por la consola con un teclado
- Línea de proporción de contraste AAA en el selector de color
- Cómo guardar anulaciones de ubicación geográfica personalizadas
- Plegado de código
- Se cambió el nombre de la pestaña Frames a Messages
- Sugerencia adicional: Filtrado del panel de red por propiedad (video)
- Visualiza las métricas de rendimiento en el panel Rendimiento
- Destaca los nodos de texto en el árbol del DOM
- Copiar la ruta de JS a un nodo DOM
- Actualizaciones del panel Audits, incluida una nueva auditoría que detecta bibliotecas de JS y nuevas palabras clave para acceder al panel Audits desde el menú de comandos
- Sugerencia adicional: Usa el modo de dispositivo para inspeccionar las consultas de medios (video)
- Coloca el cursor sobre un resultado de Live Expression para destacar un nodo del DOM.
- Almacena nodos del DOM como variables globales
- Ahora se incluye información sobre el iniciador y la prioridad en las importaciones y exportaciones de HAR
- Cómo acceder al menú de comandos desde el menú principal
- Puntos de interrupción de pantalla en pantalla
- Sugerencia adicional: Usa
monitorEvents()para registrar los eventos activados de un nodo en la consola (video) - Live Expressions en la consola
- Destaca los nodos DOM durante la evaluación detallada
- Optimizaciones del panel Rendimiento
- Depuración más confiable
- Cómo habilitar la limitación de la red desde el menú de comandos
- Autocompletar puntos de interrupción condicionales
- Interrumpir en eventos de AudioContext
- Cómo depurar apps de Node.js con ndb
- Sugerencia adicional: Mide las interacciones reales de los usuarios con la API de User Timing
- Evaluación detallada
- Sugerencias de argumentos
- Autocompletado de funciones
- Palabras clave de ES2017
- Lighthouse 3.0 en el panel Audits
- Compatibilidad con BigInt
- Cómo agregar rutas de propiedad al panel Watch
- La opción"Mostrar marcas de tiempo" se movió a Configuración
- Sugerencia adicional: Métodos de la consola menos conocidos (video)
- Cómo buscar en todos los encabezados de la red
- Vistas previas de los valores de las variables de CSS
- Copiar como recuperación
- Nuevas auditorías, opciones de configuración para computadoras y visualización de registros
- Cómo detener los bucles infinitos
- User Timing en las pestañas de rendimiento
- Instancias de VM de JavaScript claramente enumeradas en el panel Memoria
- Se cambió el nombre de la pestaña Network a Page
- Actualizaciones del tema oscuro
- Información del certificado de transparencia en el panel Seguridad
- Funciones de aislamiento de sitios en el panel Rendimiento
- Sugerencia adicional: Panel de capas + Inspector de animaciones (video)
- Blackboxing en el panel Network
- Cómo ajustar automáticamente el zoom en el modo de dispositivo
- Impresión con formato en las pestañas Preview y Response
- Cómo obtener una vista previa del contenido HTML en la pestaña Vista previa
- Compatibilidad con invalidaciones locales para los diseños dentro de HTML
- Sugerencia adicional: Secuencias de comandos del framework de caja negra para que las interrupciones del objeto de escucha de eventos sean más útiles
- Invalidaciones locales
- Nuevas herramientas de accesibilidad
- La pestaña Cambios
- Nuevas auditorías de SEO y rendimiento
- Varias grabaciones en el panel Rendimiento
- Depuración confiable del código con trabajadores en código asíncrono
- Sugerencia adicional: Automatiza las acciones de DevTools con Puppeteer (video)
- Supervisión del rendimiento
- Barra lateral de la consola
- Agrupar mensajes similares de la consola
- Sugerencia adicional: Cómo activar o desactivar la seudoclase de desplazamiento (video)
- Compatibilidad con la depuración remota de varios clientes
- Workspaces 2.0
- 4 auditorías nuevas
- Cómo simular notificaciones push con datos personalizados
- Cómo activar eventos de sincronización en segundo plano con etiquetas personalizadas
- Sugerencia adicional: Interrupciones del objeto de escucha de eventos (video)
- await de nivel superior en la consola
- Nuevos flujos de trabajo de capturas de pantalla
- Destacado de cuadrícula de CSS
- Nueva API de Console para consultar objetos
- Nuevos filtros de la consola
- Importaciones de archivos HAR en el panel de red
- Recursos de caché con vista previa
- Depuración de caché más predecible
- Cobertura de código a nivel de bloque
- Simulación de limitación de dispositivos móviles
- Cómo ver el uso del almacenamiento
- Cómo ver cuándo un service worker almacenó respuestas en caché
- Habilita el medidor de FPS desde el menú de comandos
- Cómo configurar el comportamiento de la rueda del mouse para acercar o desplazar la vista
- Compatibilidad con la depuración de módulos ES6
- Nuevo panel de Auditorías
- Insignias de terceros
- Un nuevo gesto para Continuar hasta aquí
- Paso a la asincronía
- Vistas previas de objetos más informativas en la consola
- Selección de contexto más informativa en la consola
- Actualizaciones en tiempo real en la pestaña Cobertura
- Opciones de limitación de red más sencillas
- Las pilas asíncronas están activadas de forma predeterminada
- Cobertura de código CSS y JS
- Capturas de pantalla de página completa
- Solicitudes de bloqueo
- Paso a paso sobre async/await
- Menú de comandos unificado