Lighthouse is an automated tool for improving the quality of your site. You give it a URL, and it provides a list of recommendations on how to improve page performance, make pages more accessible, adhere to best practices and more. You can run it from within Chrome DevTools, as a Chrome Extension, or even as a Node module, which is useful for continuous integration.
For a while now, Lighthouse has provided many tips for improving page load performance, such as enabling text compression or reducing render-blocking scripts. The Lighthouse team continues to ship new audits to give you even more useful advice for making your sites faster. This post is a roundup of useful performance audits that you may not be aware of, such as:
- Main Thread Work Breakdown
- Preload Key Requests
- JavaScript Boot-up Time is High
- Avoids Page Redirects
- Unused JavaScript
- Uses Inefficient Cache Policy on Static Assets
- Avoid Costly Multiple Round-Trips to Any Origin
- Use Video Formats for Animated Content
- All text remains visible during webfont loads
- Unminified CSS & JavaScript
- Unused CSS Rules
Main Thread Work Breakdown
If you've ever used the performance panel in DevTools, you know it can be a bit of a chore to get a breakdown of where CPU time was spent loading a page. We're pleased to announce that this information is now readily and conveniently available via the new Main Thread Work Breakdown audit.
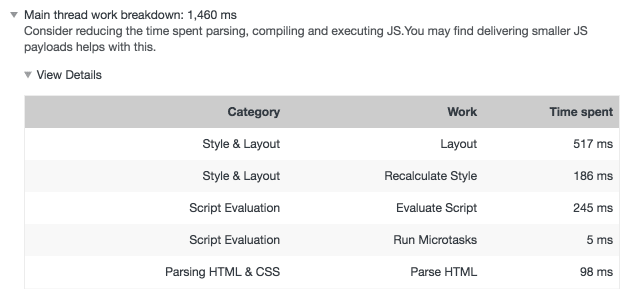
This new diagnostic evaluates how much and what kind of activity occurs during page load, which you can use to get a handle on loading performance issues related to layout, script eval, parsing, and other activity.
Preload Key Requests
When browsers retrieve resources, they do so as they find references to them
within the document and its subresources. This can be suboptimal at times,
because some critical resources are discovered rather late in the page load
process. Thankfully, rel=preload
gives developers the ability to hint to compliant browsers which resources
should be fetched as soon as possible. The new Preload Key Requests audit lets developers know
what resources could benefit from being loaded sooner by rel=preload.
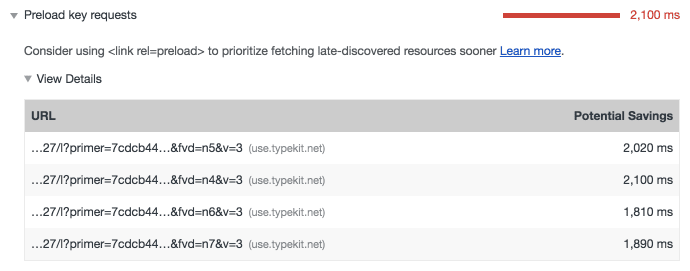
It's super important you test and compare performance changes with and without
rel=preload, as it can affect loading performance in ways you might not
expect. For example, preloading a large image could delay initial render, but
the tradeoff is that the preloaded image will appear sooner in the layout.
Always make sure you're cool with the results!
JavaScript Boot-up Time is High
When too much JavaScript is loaded, the page can become unresponsive as the browser parses, compiles, and executes it. 3rd-party scripts and advertisements are a particular source of excessive script activity that can bog down even powerful devices. The new JavaScript Boot-up Time is High audit reveals how much CPU time each script on a page consumes, along with its URL:

When you run this audit, you can also enable third party badges in the network panel and filter the list to identify third party script resources. With the data from this audit, you'll be better equipped to find sources of excessive JavaScript activity that turn pages from snappy to laggy. For scripts specific to your application, you can employ techniques like code splitting and tree shaking to limit the amount of JavaScript on each page of your site.
Avoids Page Redirects
Sometimes when a browser requests a URL, the server can respond with a 300-level status code. This causes the browser to redirect to another URL. While redirects are necessary for SEO and convenience purposes, they add latency to requests. This is especially true if they redirect to other origins, which can incur additional DNS lookup and connection/TLS negotiation time.

Redirects are undesirable for landing pages on your site. To help you reduce latency and improve loading performance, Lighthouse now offers the Avoids Page Redirects audit, which lets you know when a navigation triggers any redirects.

Note that this audit is difficult to trigger in the DevTools version of Lighthouse, because it analyzes the current URL in the address bar of the page, which reflects the resolution of all redirects. You're likeliest to see this audit populated in the Node CLI.
Unused JavaScript
Dead code can be a serious problem in JavaScript-heavy applications. While it doesn't pose execution costs as it's never invoked, it does carry other undesirable effects. Dead code is still downloaded, parsed, and compiled by the browser. This affects loading performance and JavaScript boot-up time. Similar to the coverage panel in DevTools, the Unused JavaScript audit reveals JavaScript downloaded by the current page, but is never used.
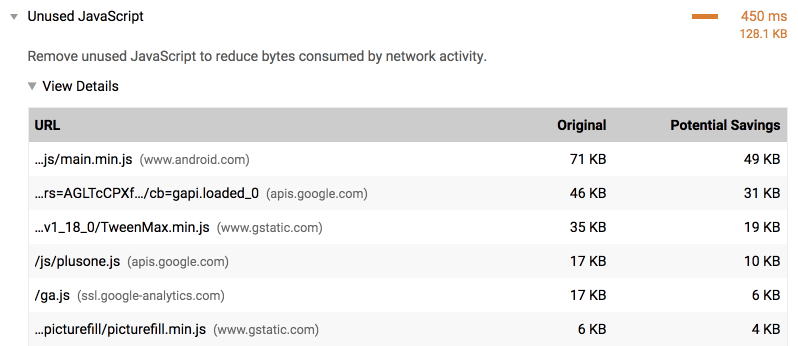
With this audit, you can identify dead code in your applications and remove it to improve loading performance and reduce system resource usage. Pro tip: You can also use the code coverage panel in Chrome's DevTools to find this information!
Uses Inefficient Cache Policy on Static Assets
While much performance advice tends to focus on boosting the speed of a website for first time users, it's also important to use caching to improve loading performance for returning users. The Uses Inefficient Cache Policy on Static Assets audit inspects caching headers for network resources, and notifies you if cache policies for static resources are substandard.
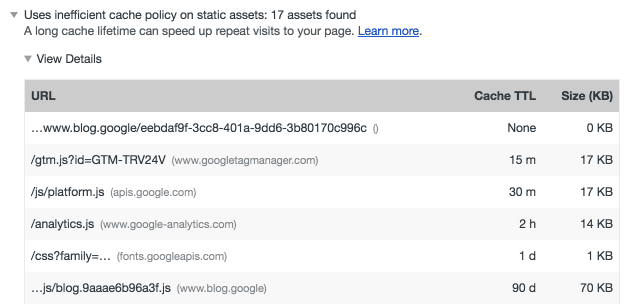
With the help of this audit, you'll be able to easily find and fix problems with your current cache policy. This will greatly improve performance for returning users, and they'll appreciate the extra speed!
Avoid Costly Multiple Round-Trips to Any Origin
When browsers retrieve resources from a server, it can take significant time to
perform a DNS lookup and establish a connection to a server.
rel=preconnect
allows developers to mask this latency by establishing connections to other
servers before the browser would in due course. The Avoid Costly Multiple
Round-Trips to Any Origin audit will help you discover opportunities to use
rel=preconnect!
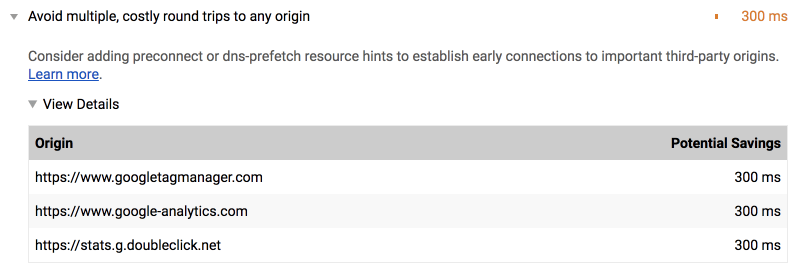
rel=preconnect in Lighthouse.When latency for cross-origin assets is reduced, users will perceive that things
are moving along a bit quicker. With this new Lighthouse audit, you'll learn of
new opportunities to use rel=preconnect to do just that.
Use Video Formats for Animated Content
Animated GIFs are huge, often consuming at least several hundred kilobytes if not several megabytes of data. If you care about loading performance, converting those GIFs to video is the way to go. Thankfully, the Use Video Formats for Animated Content audit has your back.

If your site has any GIFs that are over 100 KB, this audit will automatically flag them and direct you to some guidance on how to convert them to video and embed them. Sites like Imgur have significantly improved loading performance by converting their GIFs to video. Additionally, if your site is on a hosting plan with metered bandwidth, the potential cost savings alone should be enough to persuade you!
All Text Remains Visible During Web Font Loads
When we load web fonts for pages, browsers often render invisible text until the font loads. This phenomenon, known as the Flash of Invisible Text (FOIT)), may be preferable to you from a design standpoint, but it's actually a problem. Text that's blocked from rendering can't be read until it renders and becomes visible. On high latency and/or high bandwidth connections, this means a core part of your user experience is missing. It can also be a sort of perceptual performance issue in that the page is not rendering meaningful content as quickly as it otherwise could. Thankfully, the All Text Remains Visible During Web Font Loads audit helps you to find opportunities to fix this on your site!

If Lighthouse finds web fonts in your application that are delaying text
rendering, there's a few potential remedies. You can control text rendering with
the font-display CSS property,
and/or the Font Loading API.
If you want to dig deeper, consider reading A Comprehensive Guide to Font Loading Strategies, an
excellent guide by Zach Leatherman which is an
excellent resource for optimal font loading.
Unminified CSS & JavaScript
Minification has been a suggested technique since web performance has been a thing, and for good reason. It significantly reduces the size of text-based resources, which in turn is good for loading performance. However, it's easy to overlook this optimization, especially if build processes don't take care of it for you. The Minify CSS and Minify JavaScript audits will compile a list of unminified resources it finds on the current page. From there, you can take action by minifying those files manually, or augmenting your build system to do it for you.
Unused CSS Rules
As a site gets a bit long in the tooth, it's inevitable that the cruft left over from refactoring begins to build up. One such source of cruft comes in the form of unused CSS rules which are no longer necessary for the site to function, yet still consume bandwidth. For your convenience, the Unused CSS Rules audit reveals which CSS resources on the page contain unused CSS.
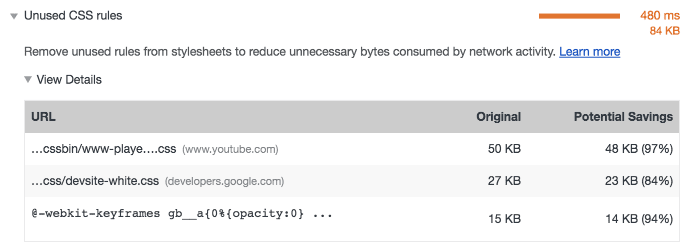
If Lighthouse finds unused CSS on the page, there are ways to get rid of it. UnCSS is one such utility that does this for you automatically (although it must be used with care). A more manual method involves using the code coverage panel in DevTools. Just remember, though, that unused CSS on one page could be necessary on another. Another approach may be to split your CSS into template-specific files that are only loaded where necessary. Whatever you decide to do, Lighthouse will be there to let you know if your CSS cruft is getting to be a bit much.
Give Lighthouse a try!
If you're excited about these new audits, update Lighthouse and give them a try!
- The Lighthouse Chrome extension
should automatically update, but you can manually update it via
chrome://extensions. - In DevTools, you can run Lighthouse in the audits panel. Chrome updates to a new version about every 6 weeks, so some newer audits may not be available. If you're antsy to use the latest audits available, you can run the latest Chrome code by downloading Chrome Canary.
- For Node users: Run
npm update lighthouse, ornpm update lighthouse -gif you installed Lighthouse globally.
Special thanks to Kayce Basques, Patrick Hulce, Addy Osmani, and Vinamrata Singal for their valuable feedback, which significantly improved the quality of this article.
