In the last quarter of 2019, the Chrome DevTools team started improving the developer experience in DevTools around cookies. This was particularly important because Google Chrome and other browsers had begun to change their default cookie behavior.
While researching the tools that DevTools already provides, we often found ourselves in a situation like the following:
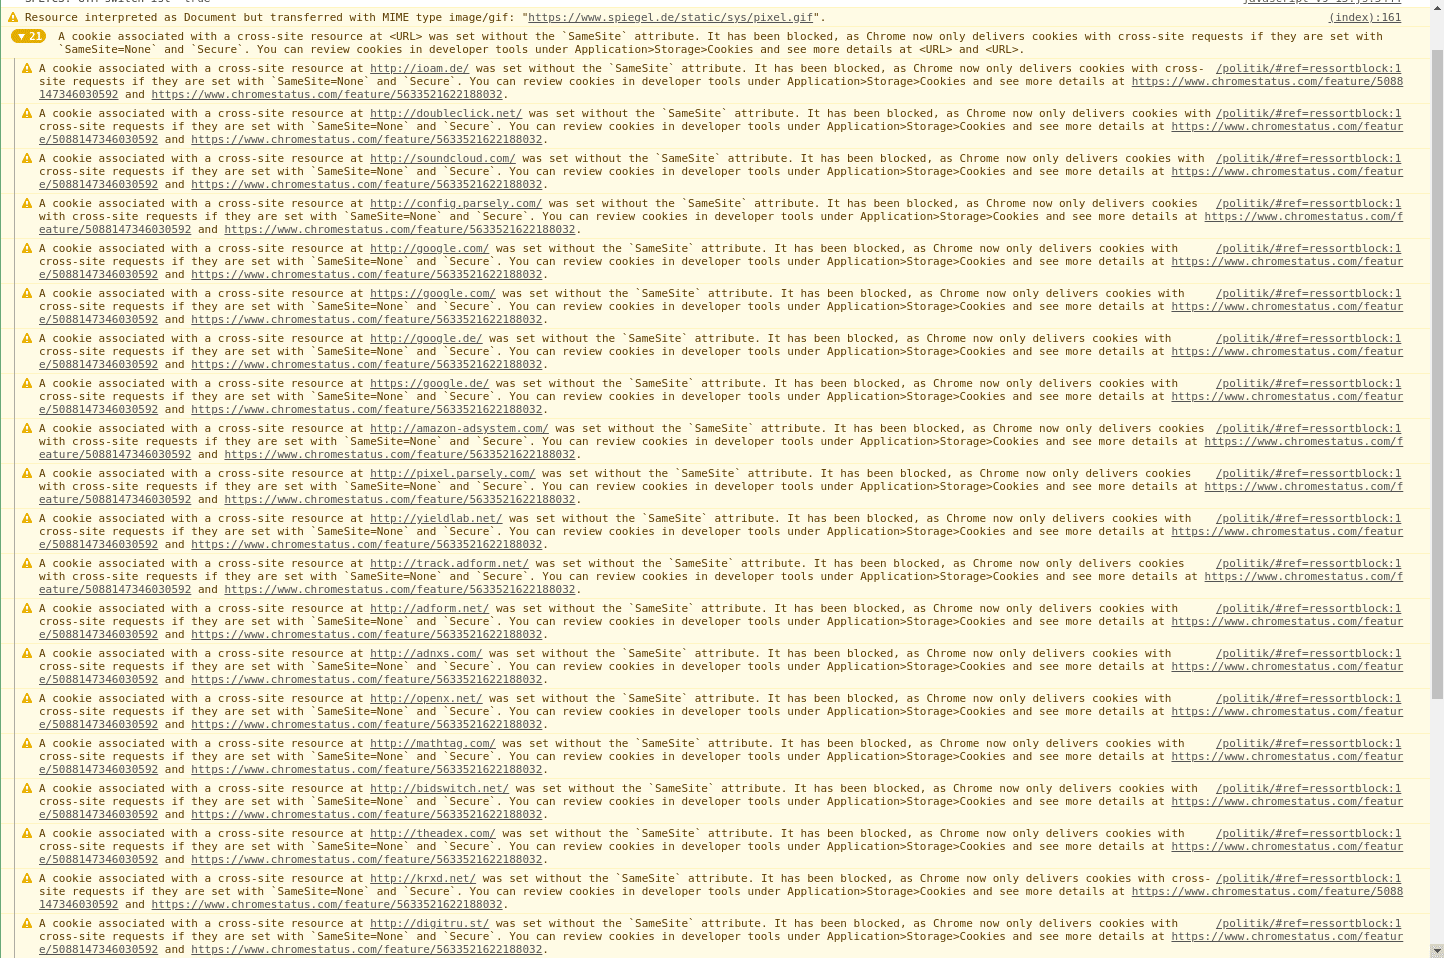
😰 The console was full of warnings and error messages, that contained rather technical explanations and sometimes links to chromestatus.com. All messages looked roughly equally important, making it hard to figure out which to address first. More importantly, the text was not linking to additional information inside DevTools, making it difficult to understand what happened. And finally, the messages often left it entirely to the web developer to figure out how to fix the problem or even learn about the technical context.
If you also use the console for messages from your own application, you'll sometimes have a hard time finding them between all the messages from the browser.
As well as humans, it's also difficult for automated processes to interact with console messages. For example, developers might use Chrome Headless and Puppeteer in a Continuous Integration/Continuous Deployment scenario. Because console messages are just strings, developers need to write regular expressions or some other parser to extract actionable information.
The solution: structured and actionable issue reporting
To find a better solution to the problems we discovered, we first started thinking about the requirements and collected them in a Design Doc.
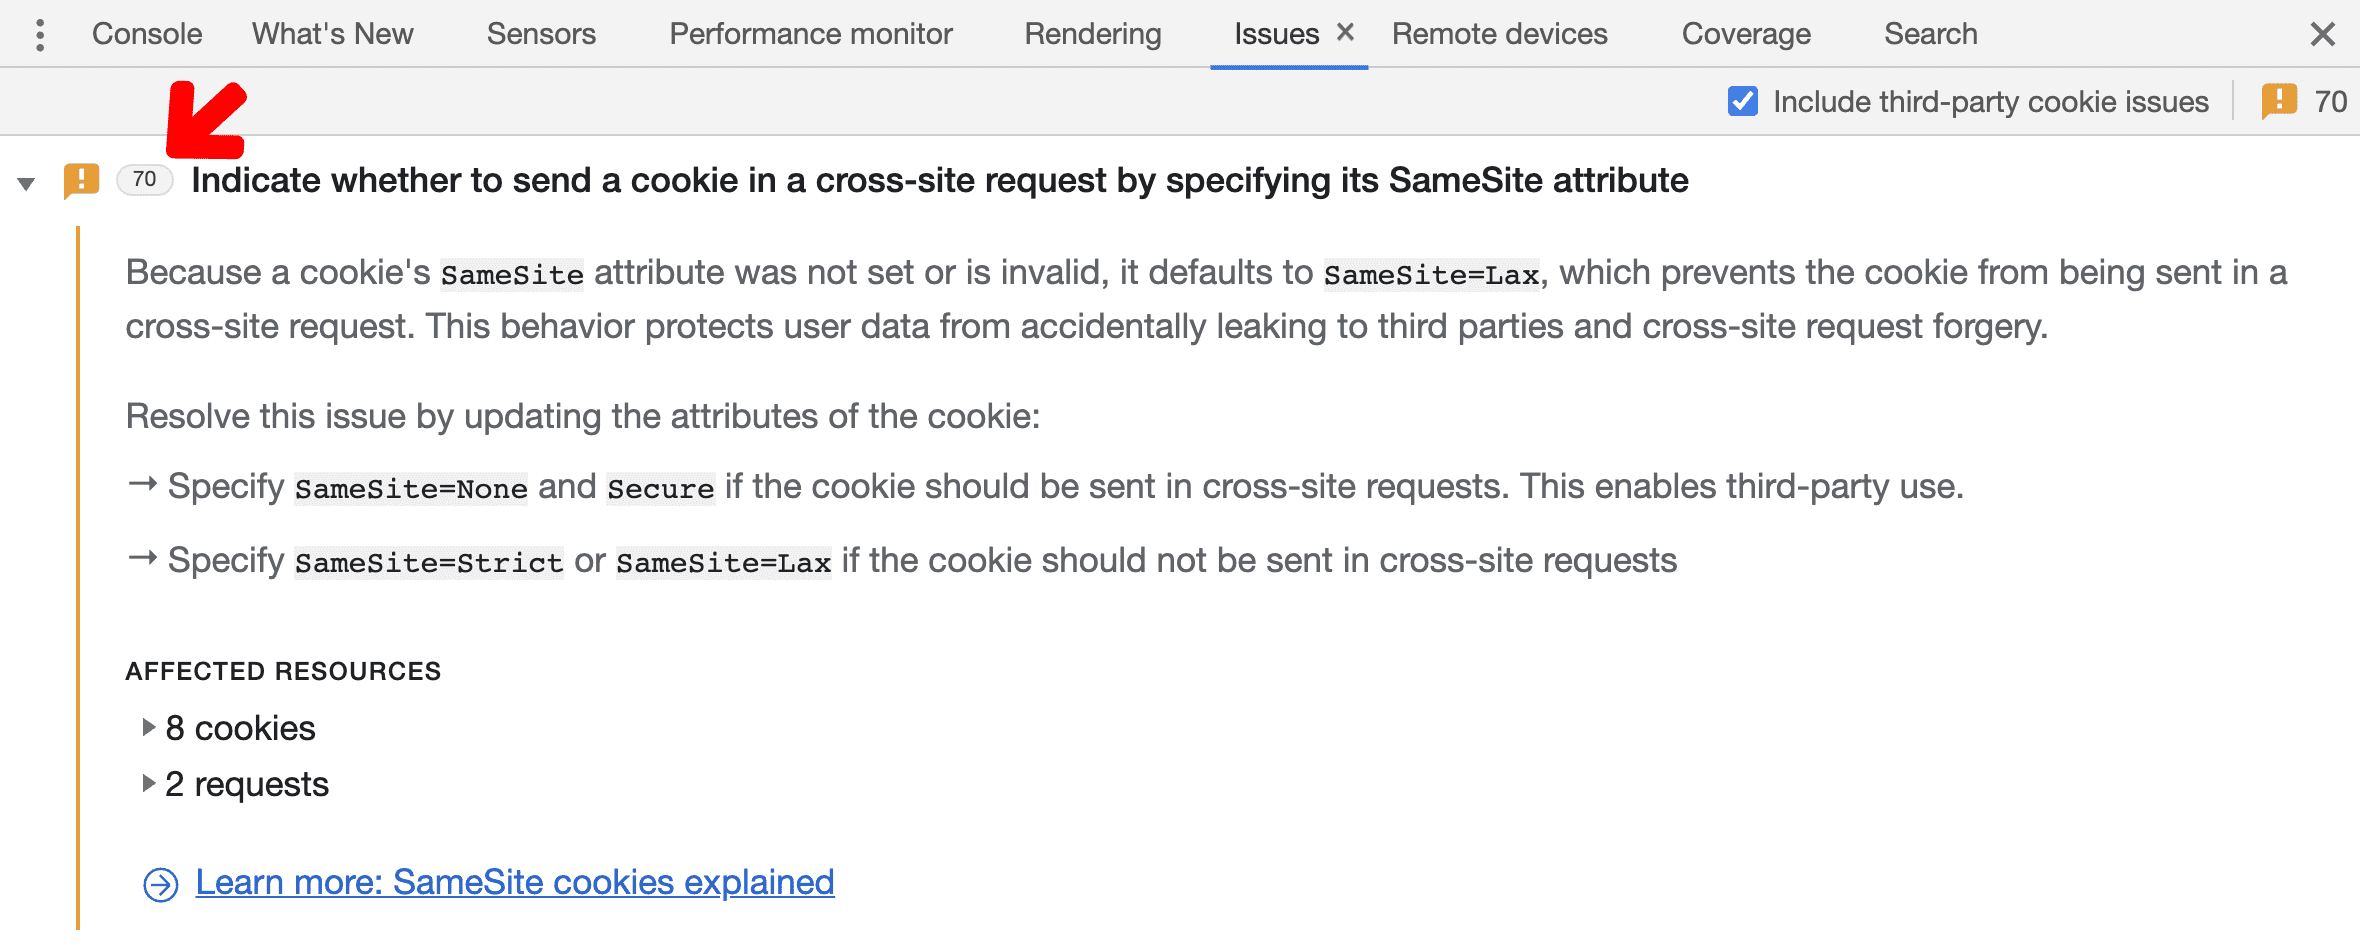
Our goal is to present issues in a way that clearly explains the problem, and how to fix it. From our design process we realised that each issue should contain the following four parts:
- Title
- Description
- Links to affected resources within DevTools
- And a link to further guidance
For the title, we want it to be short and precise to help developers understand the core problem, and often already hints at the fix. For example, a cookie issue now simply reads:
Mark cross-site cookies as Secure to allow setting them in cross-site contexts
Every issue contains more detailed information in a description, which explains what happened, gives actionable advice on how to fix it, and links to other panels inside DevTools to understand the problem in context. We also provide links to in-depth articles on web.dev to enable web developers to learn about the topic in greater detail.
An important part of each issue is the affected resources section, which links to other parts of DevTools and makes it easy to investigate further. For the cookie issue example, there should be a list of network requests that triggered the issue, and clicking on the request directly takes you to the Network panel. We hope that this is not only convenient, but also reinforces which panels and tools inside DevTools can be used to debug a certain kind of issue.
Thinking about developer interaction with the Issues tab long-term, we imagine the following evolution of developer interaction:
- When encountering a particular issue for the first time, a web developer would read the article to understand the issue in-depth.
- When encountering the issue the second time, we hope that the issue description would be enough to remind the developer of what the issue was about, and allow them to immediately investigate and take action to resolve it.
- After encountering an issue for a couple of times, we hope that the issue title is enough for a developer to recognize the type of issue.
Another important aspect we wanted to improve is aggregation. For example, if the same cookie caused the same problem multiple times, we wanted to report the cookie only once. Besides reducing the number of messages considerably, this often helps to identify the root cause of an issue more quickly.
The implementation
With those requirements in mind, the team started to look into how to implement the new feature. Projects for Chrome DevTools usually span three different areas:
- Chromium, the open-source project written in C++ behind Google Chrome
- DevTools frontend, the JavaScript implementation of Chrome DevTools
- Chrome DevTools Protocol (CDP), the layer connecting the two
Implementation was then comprised of three tasks:
- Inside Chromium, we had to identify the components that have the information we want to surface and make that information accessible to the DevTools Protocol without compromising speed or security.
- We then needed to design the Chrome DevTools Protocol (CDP) to define the API that exposes the information to clients, such as the DevTools frontend.
- Finally, we needed to implement a component in DevTools frontend that requests the information from the browser via CDP and displays it in an appropriate UI such that developers can easily interpret and interact with the information.
For the browser side, we first looked into how console messages were handled, because their behavior is very similar to what we had in mind for issues. CodeSearch is usually a good starting point for explorations like these. It allows you to search and explore the whole source code of the Chromium project online. That way, we learned about the implementation of console messages and could build up a parallel, but more structured way around the requirements we collected for the issues.
The work here is especially challenging because of all the security implications we always have to keep in mind. The Chromium project goes a long way to separate things into different processes and have them only communicate through controlled communication channels to prevent information leaks. Issues may contain sensitive information, so we have to take care to not send that information to a part of the browser that shouldn't know about it.
In DevTools frontend
DevTools itself is a web application written in JavaScript and CSS. It's a lot like many other web applications - except that it's been around for more than 10 years. And of course its back-end is basically a direct communication channel to the browser: the Chrome DevTools Protocol.
For the Issues tab, we first thought about user stories and what developers would have to do to resolve an issue. Our ideas mostly evolved around having the Issues tab as a central starting point for investigations that linked people to the panels that show more detailed information. We decided to put the Issues tab with the other tabs at the bottom of DevTools so it can stay open while a developer interacts with another DevTools component, such as the Network or the Application panel.
With that in mind, our UX designer understood what we were aiming at, and prototyped the following initial proposals:
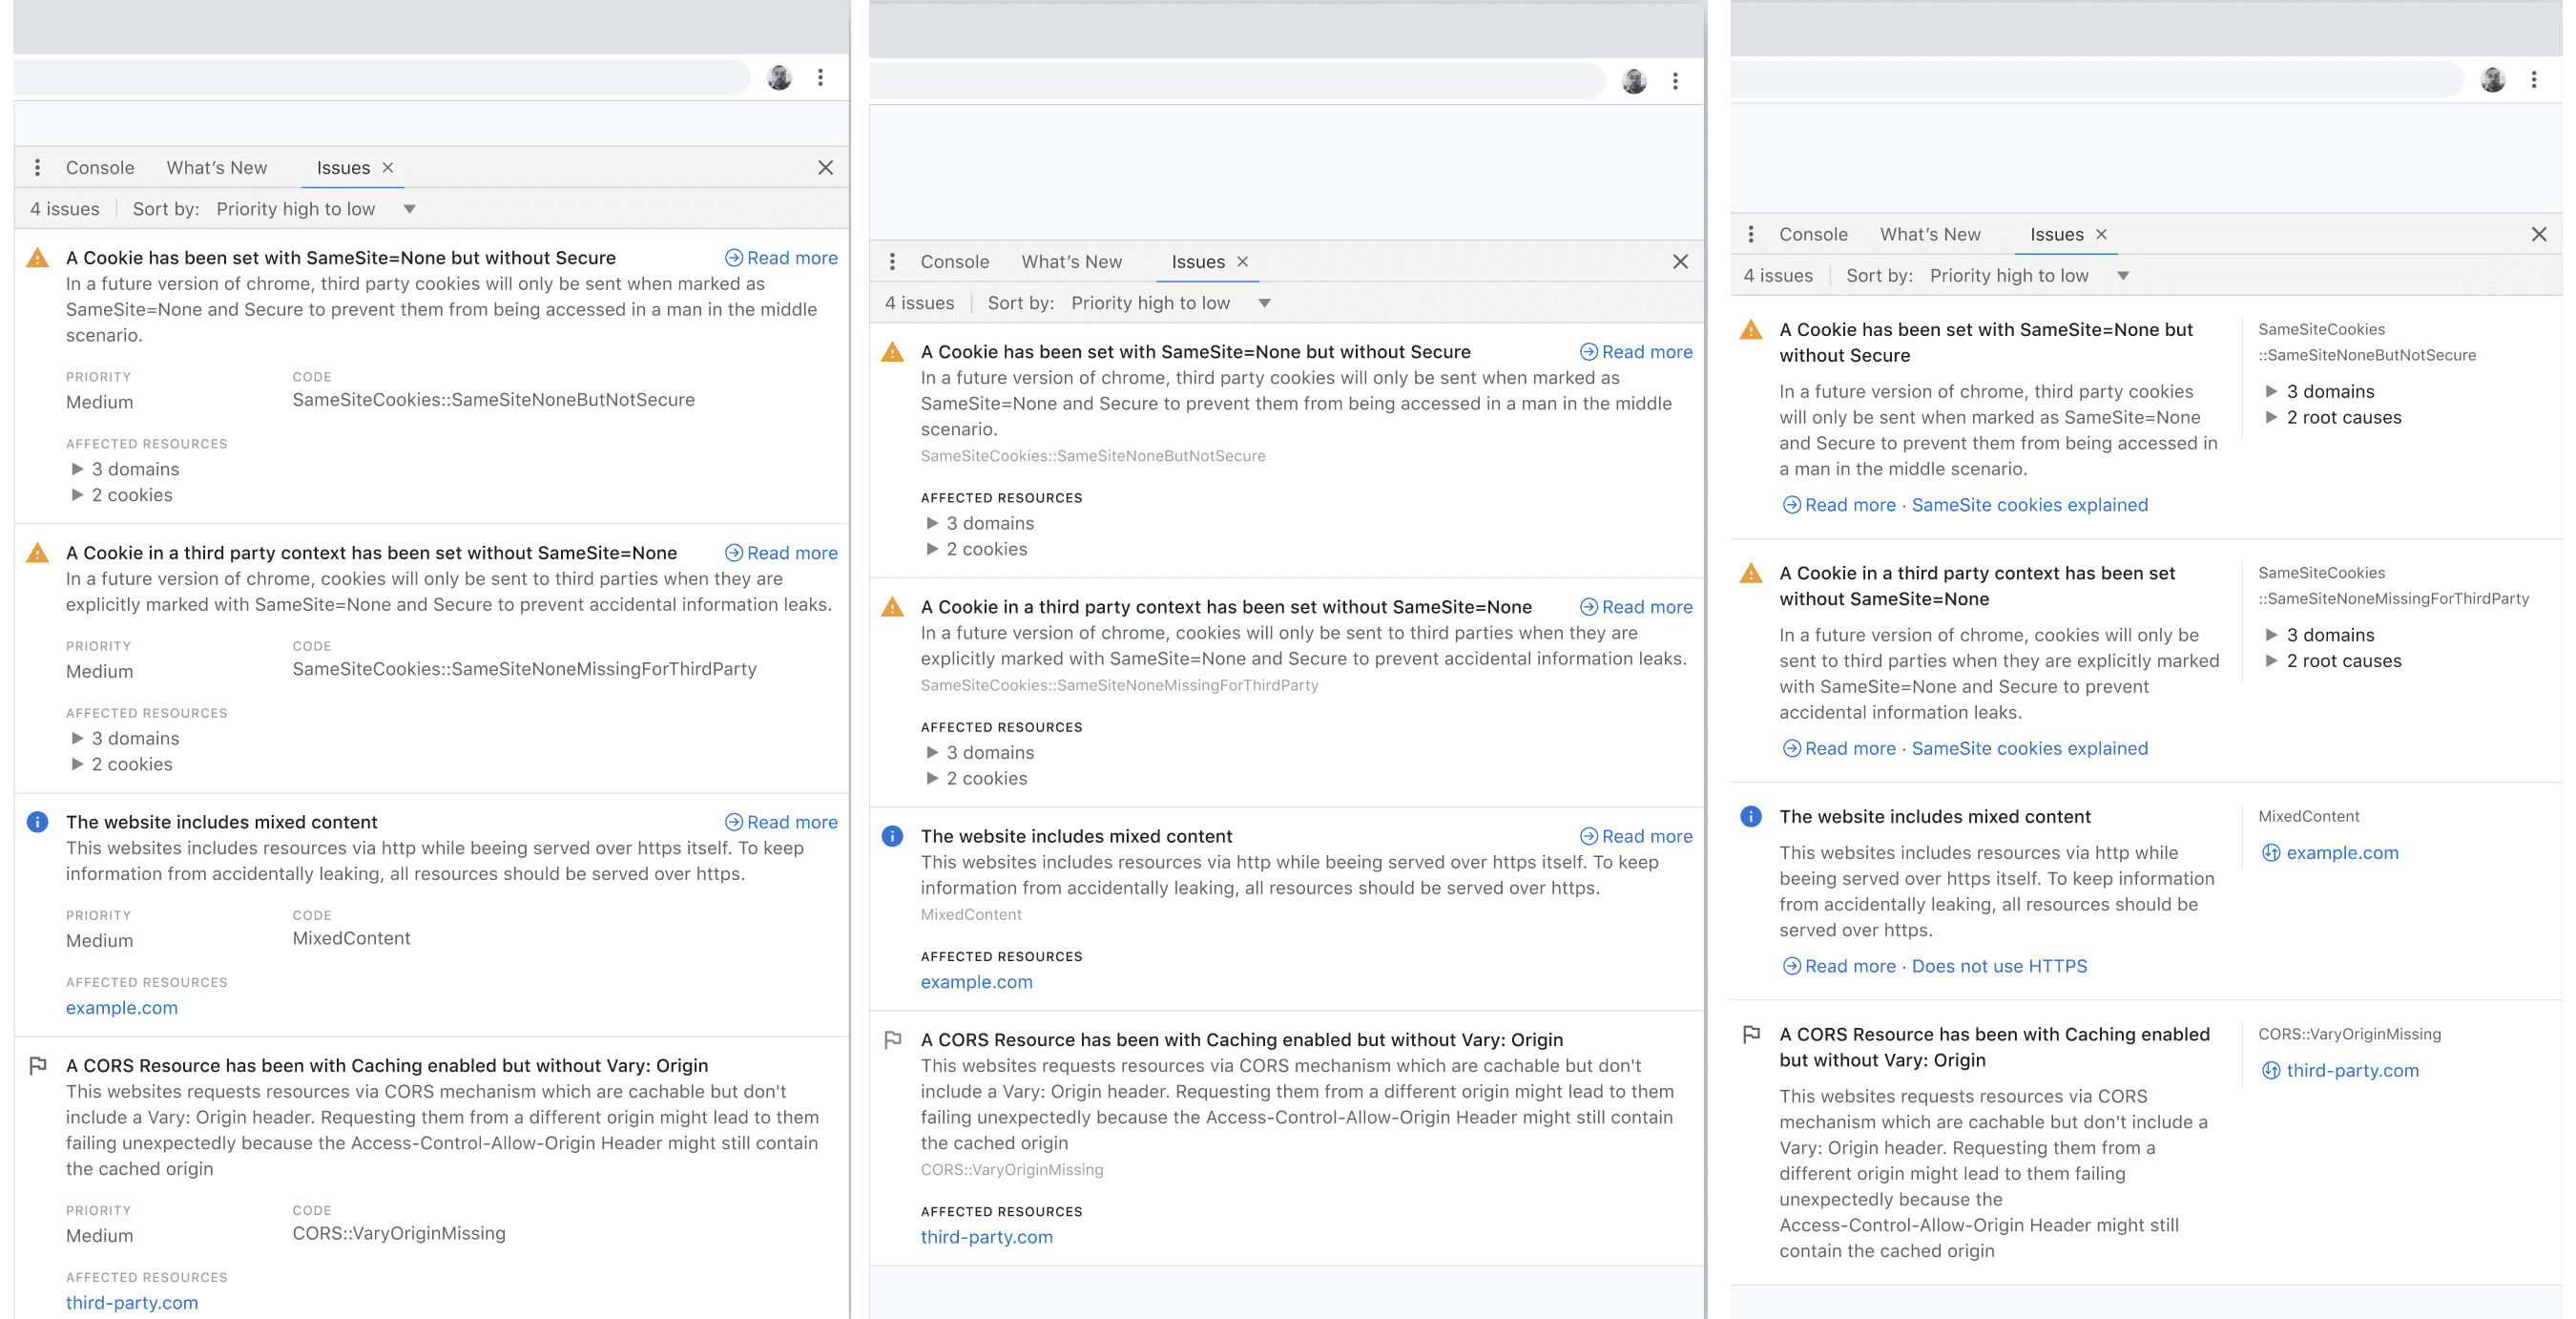
After a lot of discussion around the best solution, we started implementing the design and reiterating decisions to gradually arrive at what the Issues tab looks like today.
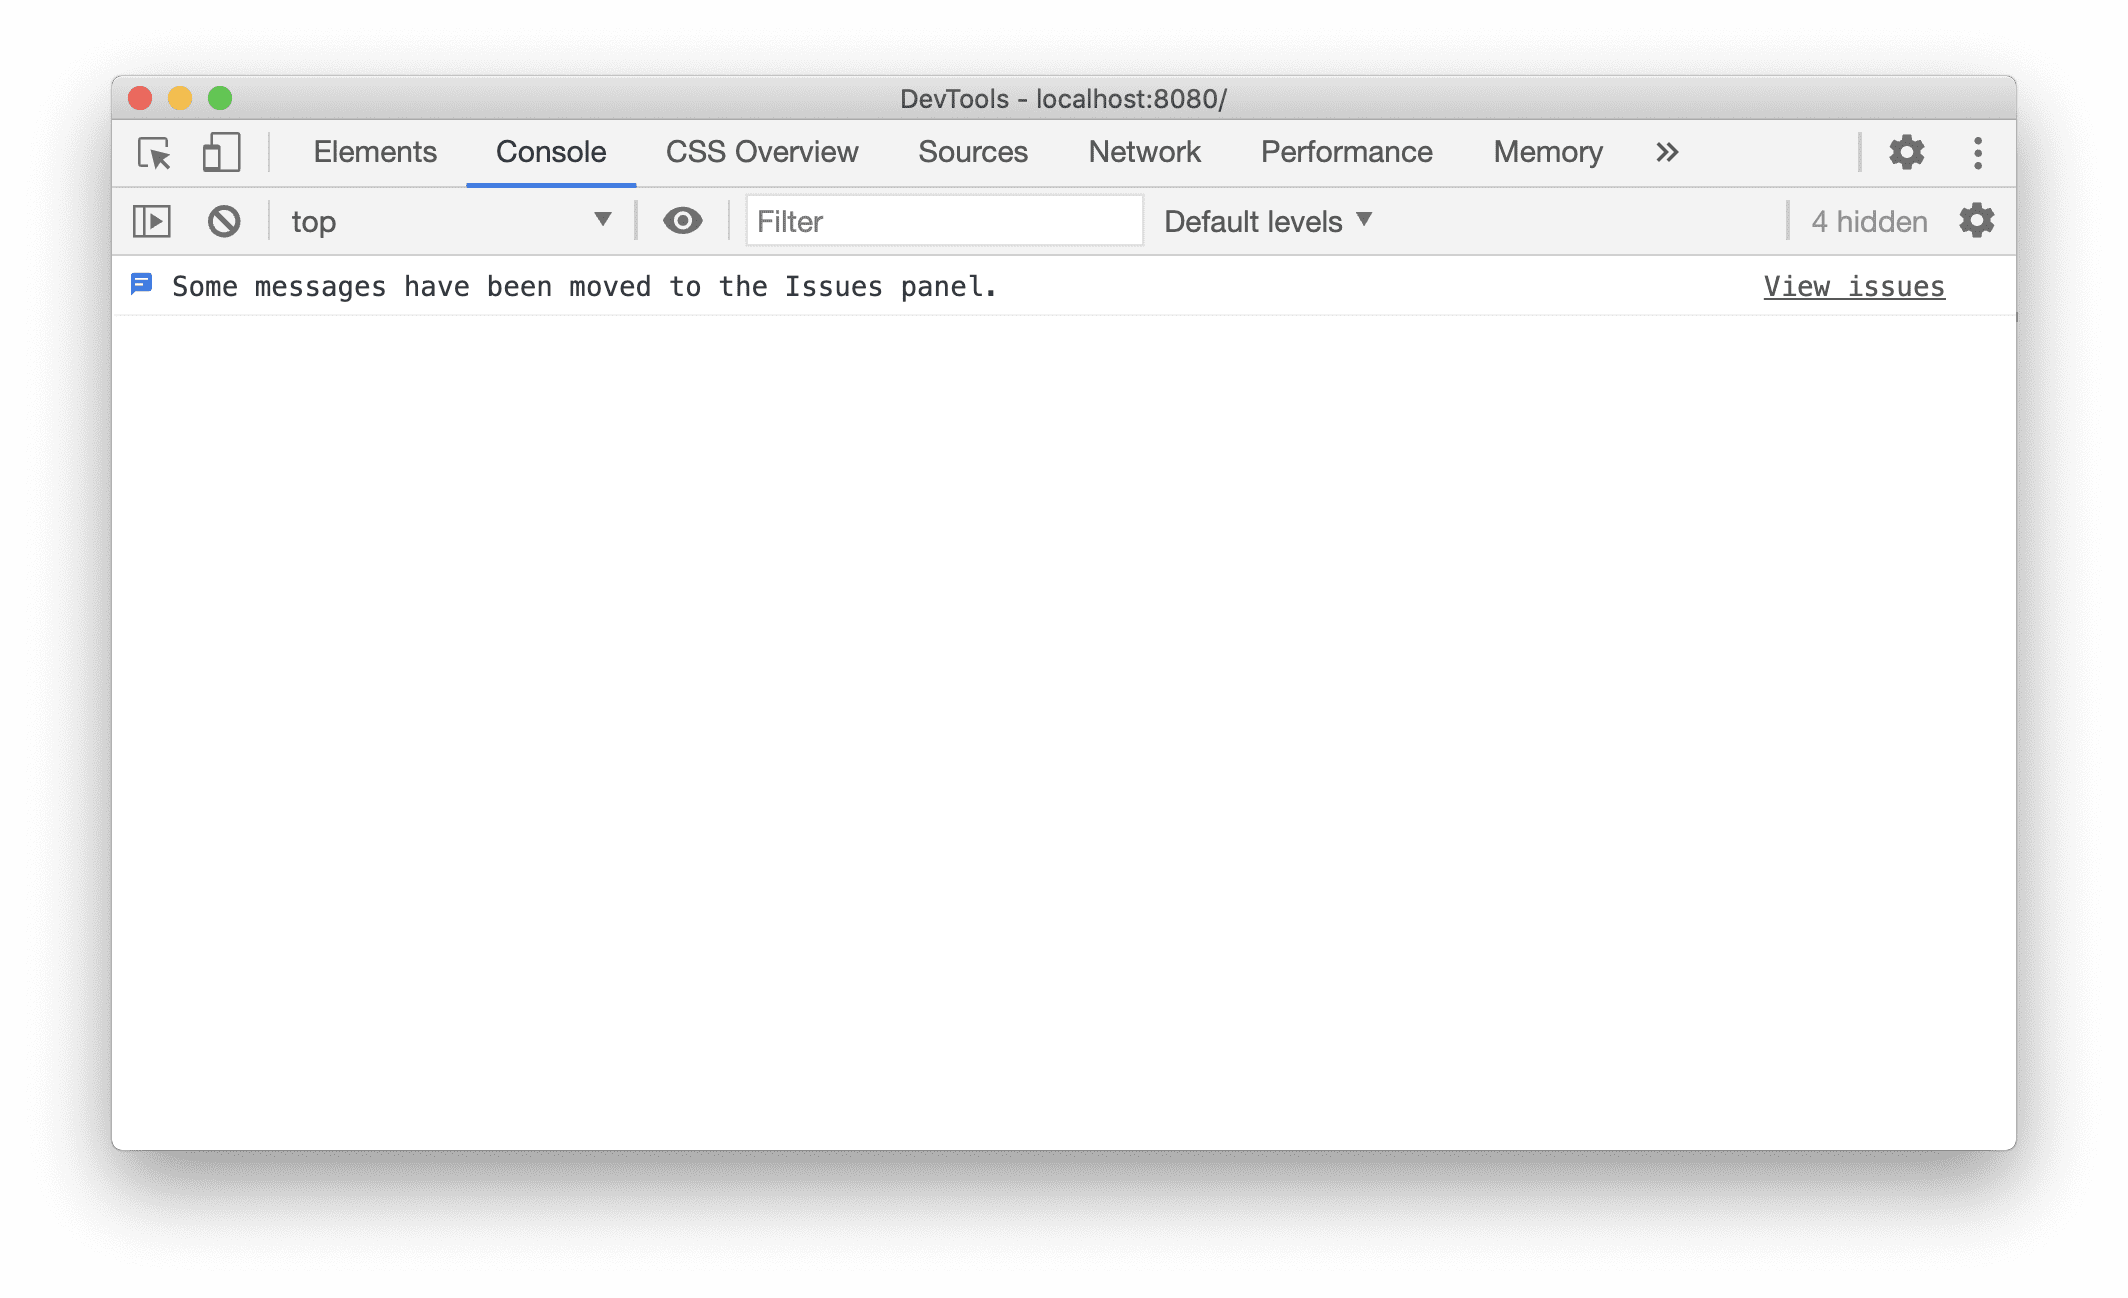
Another very important factor was the discoverability of the Issues tab. In the past, many great Devtools features were not discoverable without the developer knowing what specifically to look for. For the Issues tab, we decided to highlight issues in multiple different areas to make sure developers wouldn't miss important issues.
We decided to add a notification to the console panel, because certain console messages are now removed in favor of issues. We also added an icon to the warnings and errors counter in the top right of the DevTools window.
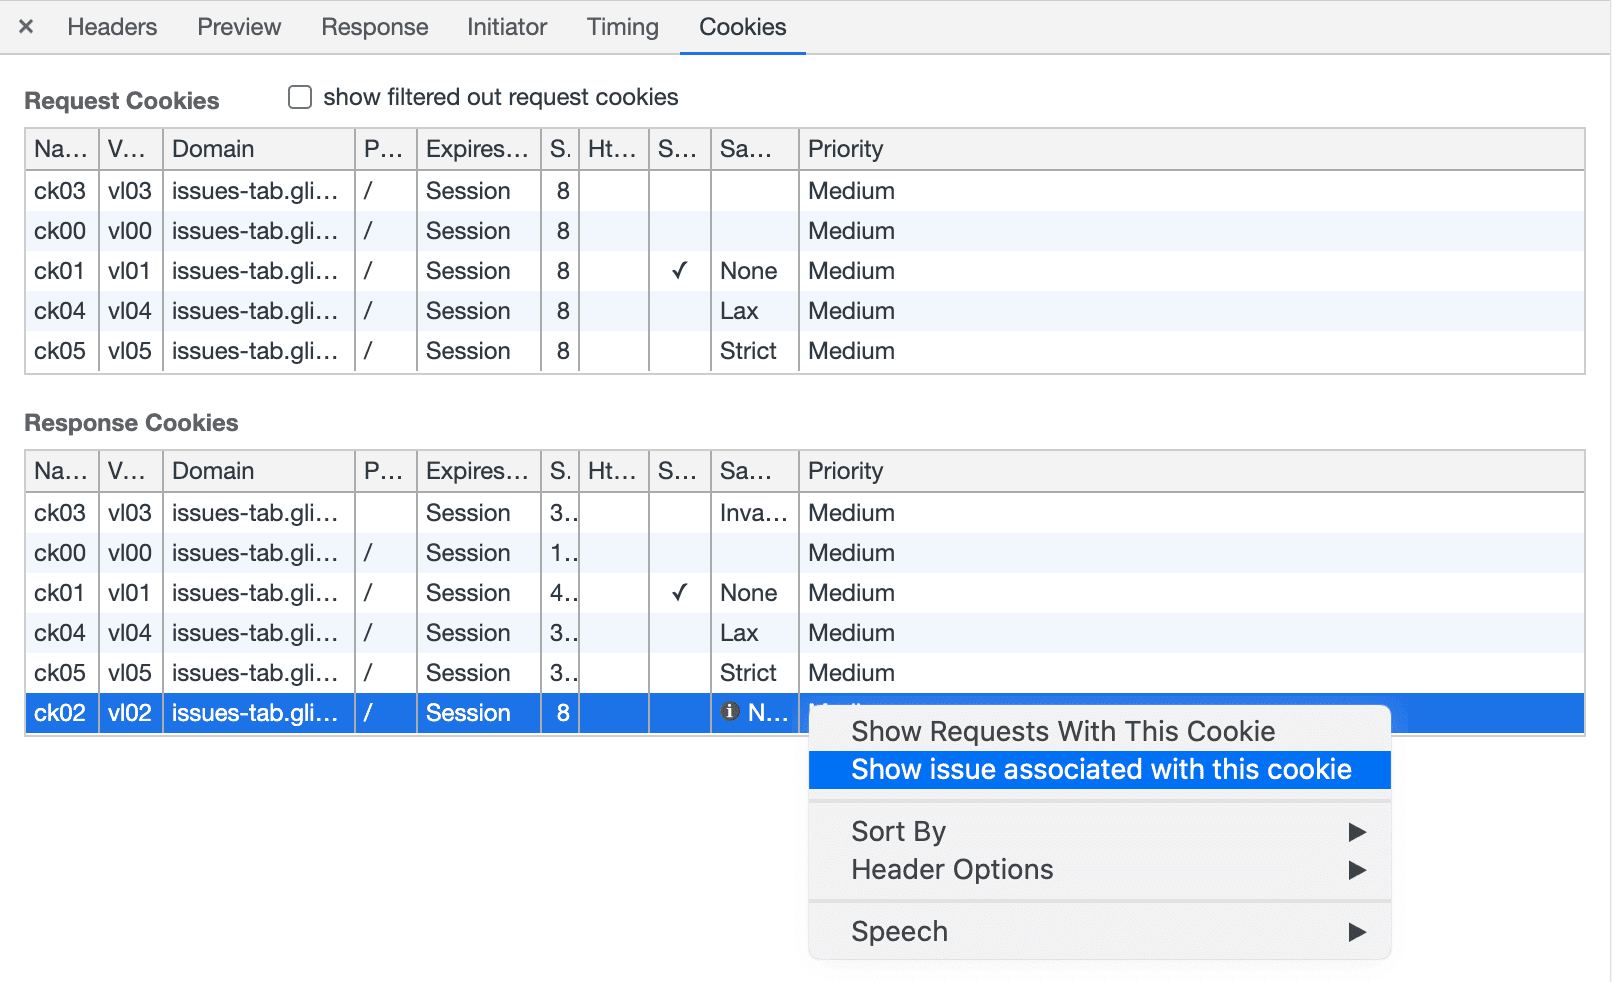
Finally, the Issues tab not only links to other DevTools panels, but resources that are related to an issue also link back to the Issues tab.
In the protocol
The communication between the frontend and the backend works over a protocol called Chromium DevTools Protocol (CDP). The CDP can be thought of as the back-end of the web app that is Chrome DevTools. The CDP is subdivided into multiple domains and every domain contains a number of commands and events.
For the Issues tab, we decided to add a new event to the Audits domain that triggers whenever a new issue is encountered. To make sure that we can also report on issues that arise while DevTools is not yet opened, the Audits domain stores the most recent issues and dispatches them as soon as DevTools connects. DevTools then collects all those issues and aggregates them.
The CDP also enables other protocol clients, such as Puppeteer, to receive and process issues. We hope the structured issue information sent over the CDP will enable and simplify integration into existing continuous integration infrastructure. This way, issues can be detected and fixed even before the page is deployed!
Future
First of all, a lot more messages have to move from the console to the Issues tab. This will take some time, especially because we want to provide clear, actionable documentation for every new issue we add. We hope that in the future developers will go looking for issues in the Issues tab instead of the console!
Furthermore, we are thinking how to integrate issues from other sources besides the Chromium back-end into the Issues tab.
We are looking into ways to keep the Issues tab tidy and improve usability. Searching, filtering, and better aggregation are on our list for this year. To structure the increasing number of reported issues, we are in the process of introducing issue categories that would, for example, make it possible to only show issues that are about upcoming deprecations. We are also thinking about adding a snooze feature, that a developer can use to hide issues temporarily.
To keep issues actionable, we want to make it easier to discover which part of a page triggered an issue. In particular, we are thinking about ways to distinguish and filter issues that are genuinely from your page (i.e. first-party) from issues that are triggered by resources you embed, but are not directly under your control (such as an ad network). As a first step, it will be possible to hide third-party cookie issues in Chrome 86.
If you have any suggestions to improve the Issues tab, let us know by filing a bug!
Download the preview channels
Consider using the Chrome Canary, Dev, or Beta as your default development browser. These preview channels give you access to the latest DevTools features, let you test cutting-edge web platform APIs, and help you find issues on your site before your users do!
Get in touch with the Chrome DevTools team
Use the following options to discuss the new features, updates, or anything else related to DevTools.
- Submit feedback and feature requests to us at crbug.com.
- Report a DevTools issue using the More options > Help > Report a DevTools issue in DevTools.
- Tweet at @ChromeDevTools.
- Leave comments on What's new in DevTools YouTube videos or DevTools Tips YouTube videos.


