In Chrome 58, which is currently Canary, the Timeline panel has been renamed to the Performance panel, the Profiles panel has been renamed to the Memory panel, and the Record JavaScript CPU Profile feature on the Profiles panel has been moved to a more hidden location.
The long-term goal is to remove the old JavaScript CPU Profiler, and get everyone working with the new workflow.
This little migration guide shows you how to record a JS profile in the Performance panel, and how the Performance panel's UI maps to the old workflow that you're used to.
Accessing the old JavaScript CPU profiler
If you prefer the old "Record JavaScript CPU Profile" workflow that used to be available on the Profiles panel, you can still access it like so:
- Open the DevTools main menu.
- Select More tools > JavaScript Profiler. The old profiler opens in a new panel called JavaScript Profiler.
How to record a JS profile
- Open DevTools.
Click the Performance tab.

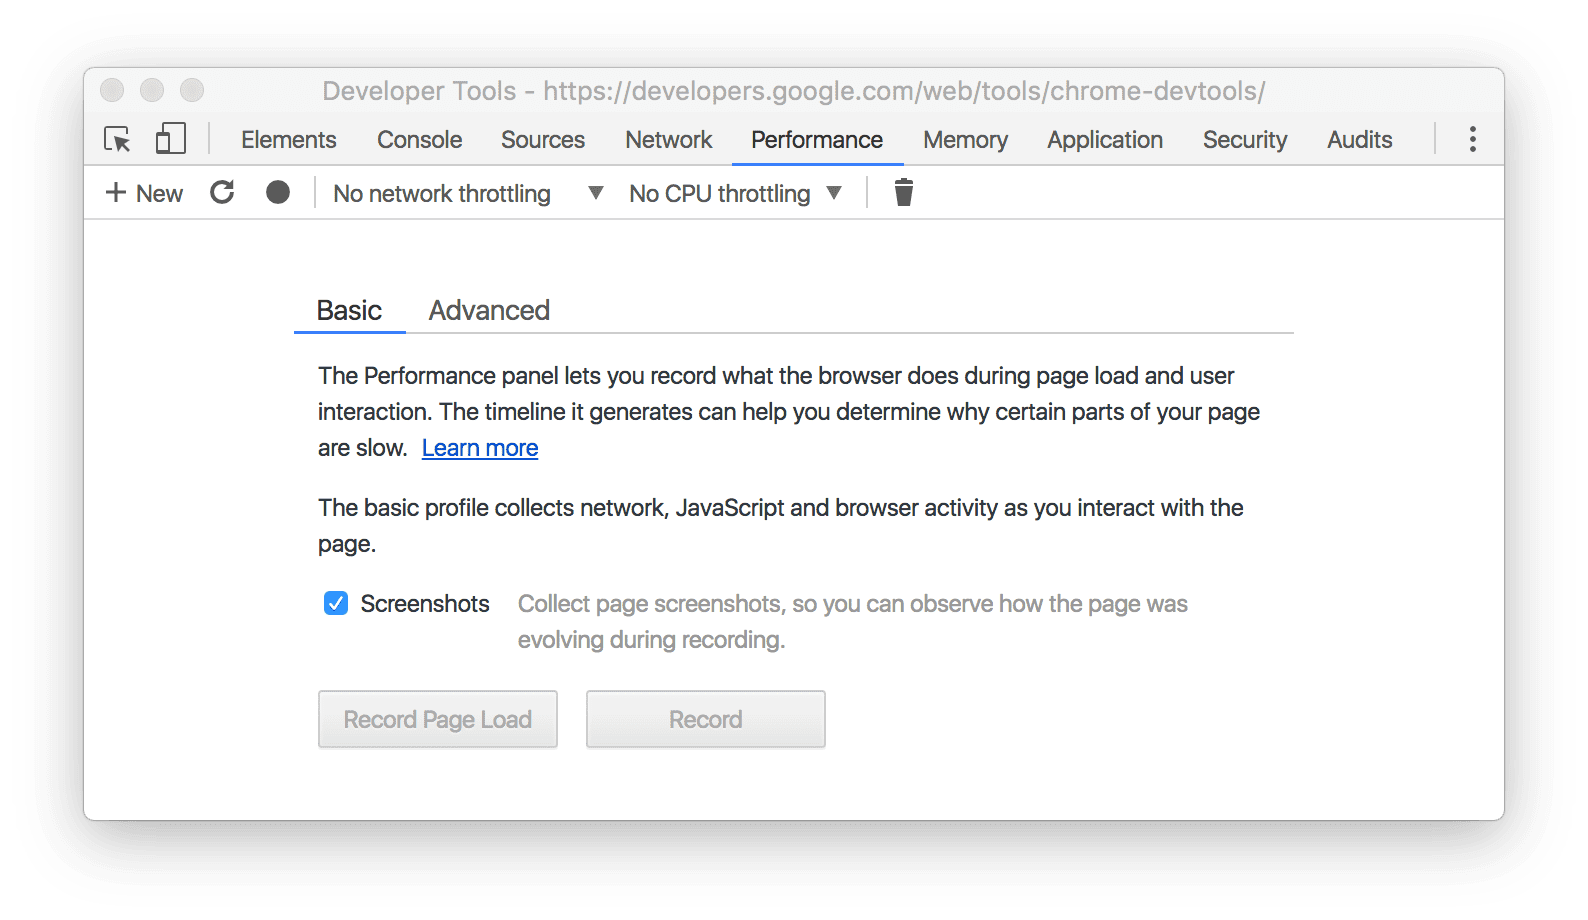
Figure 1. The Performance panel. Record in one of the following ways:
- To profile a page load, click Record Page Load. DevTools automatically starts the recording and then automatically stops when it detects that the page has finished loading.
- To profile a running page, click Record, perform the actions that you want to profile, and then click Stop when you're finished.
How the old workflow maps to the new
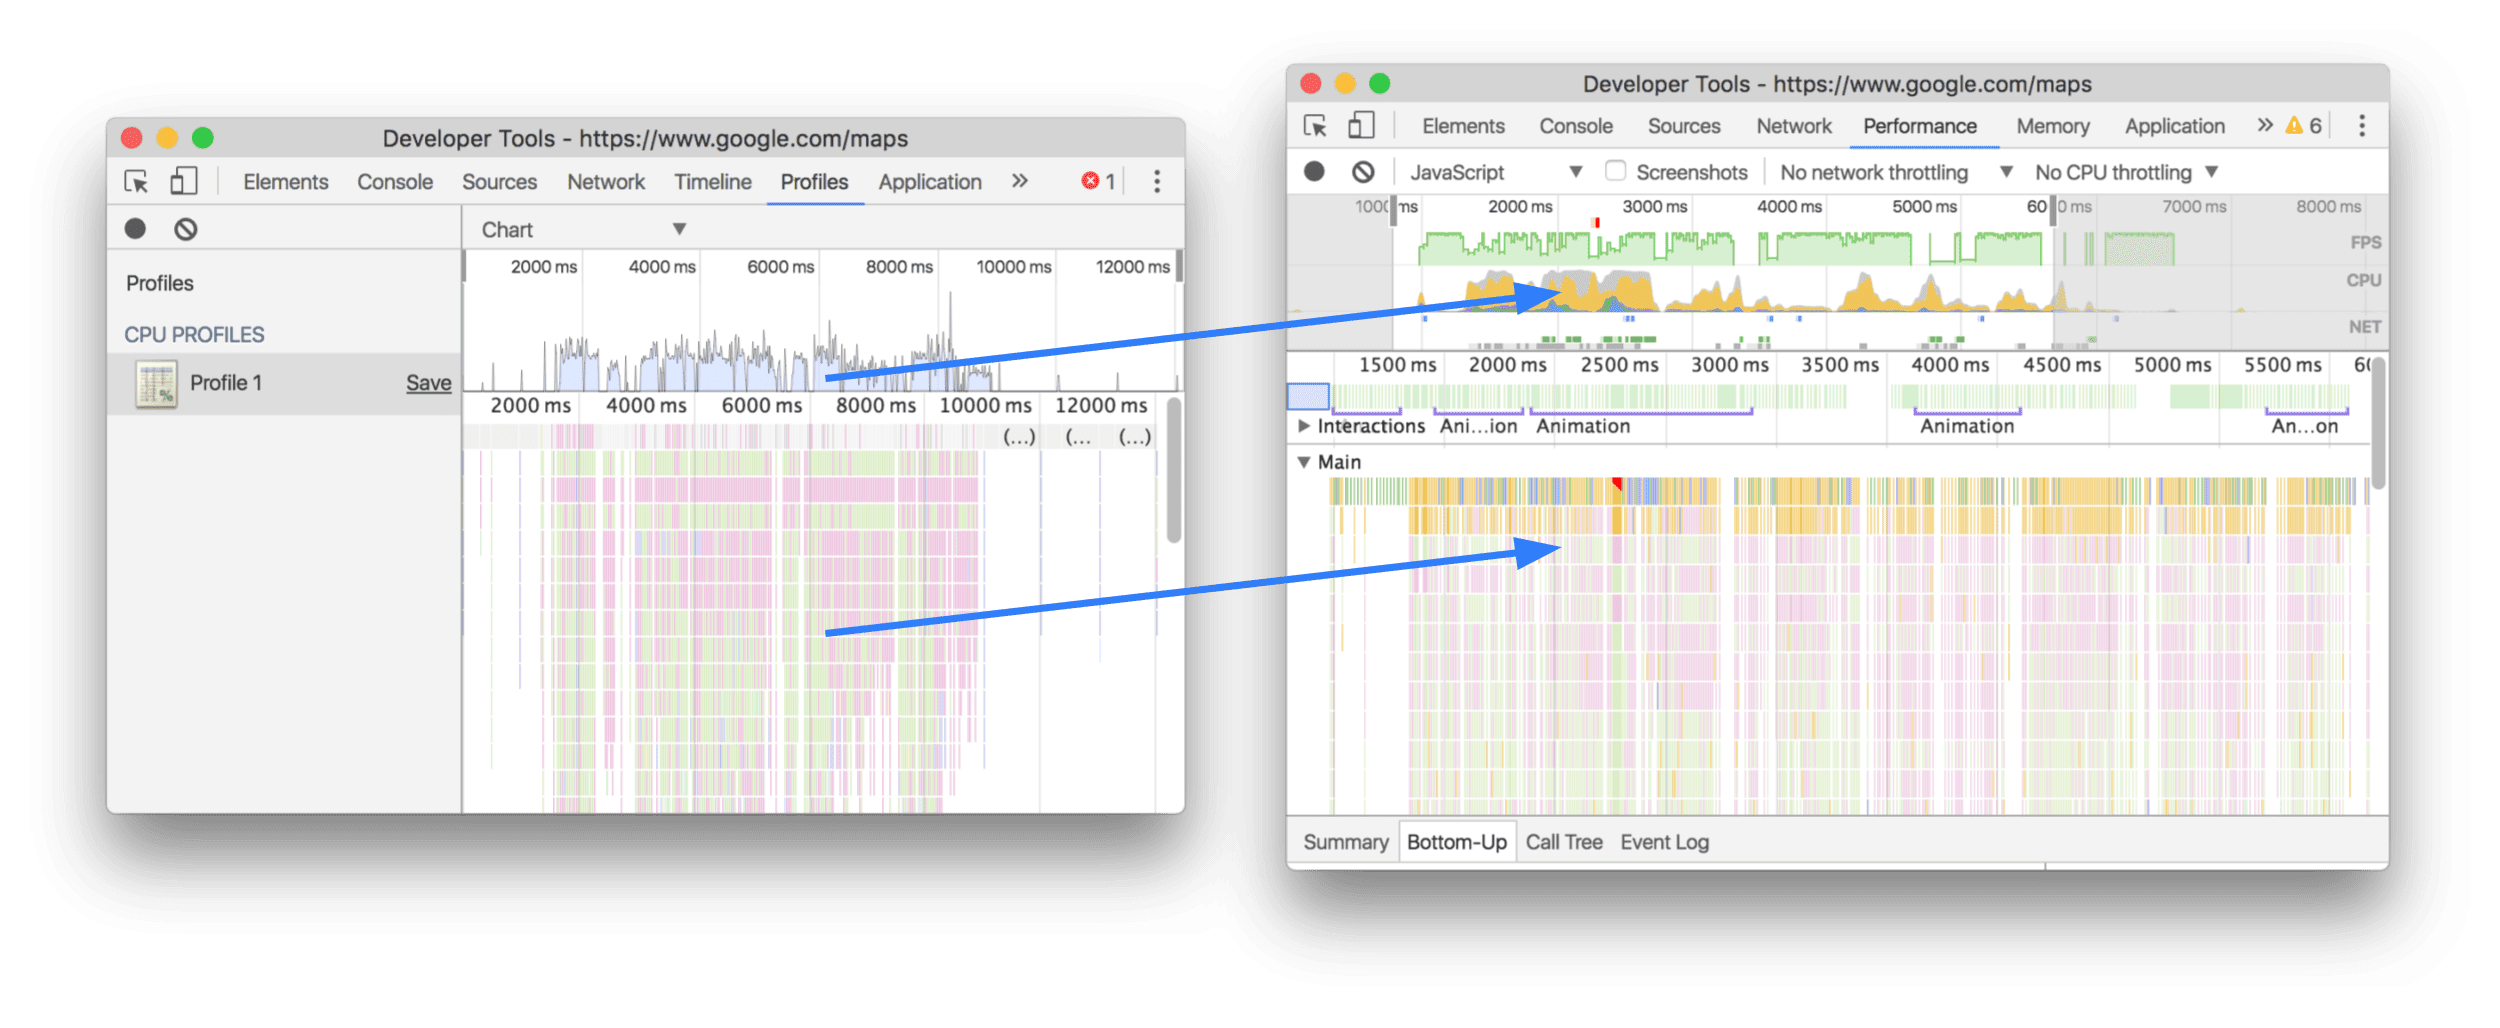
From the Chart view of the old workflow, the screenshot below shows you the position of the CPU usage overview chart (top arrow) and the flame chart (bottom arrow) in the new workflow.

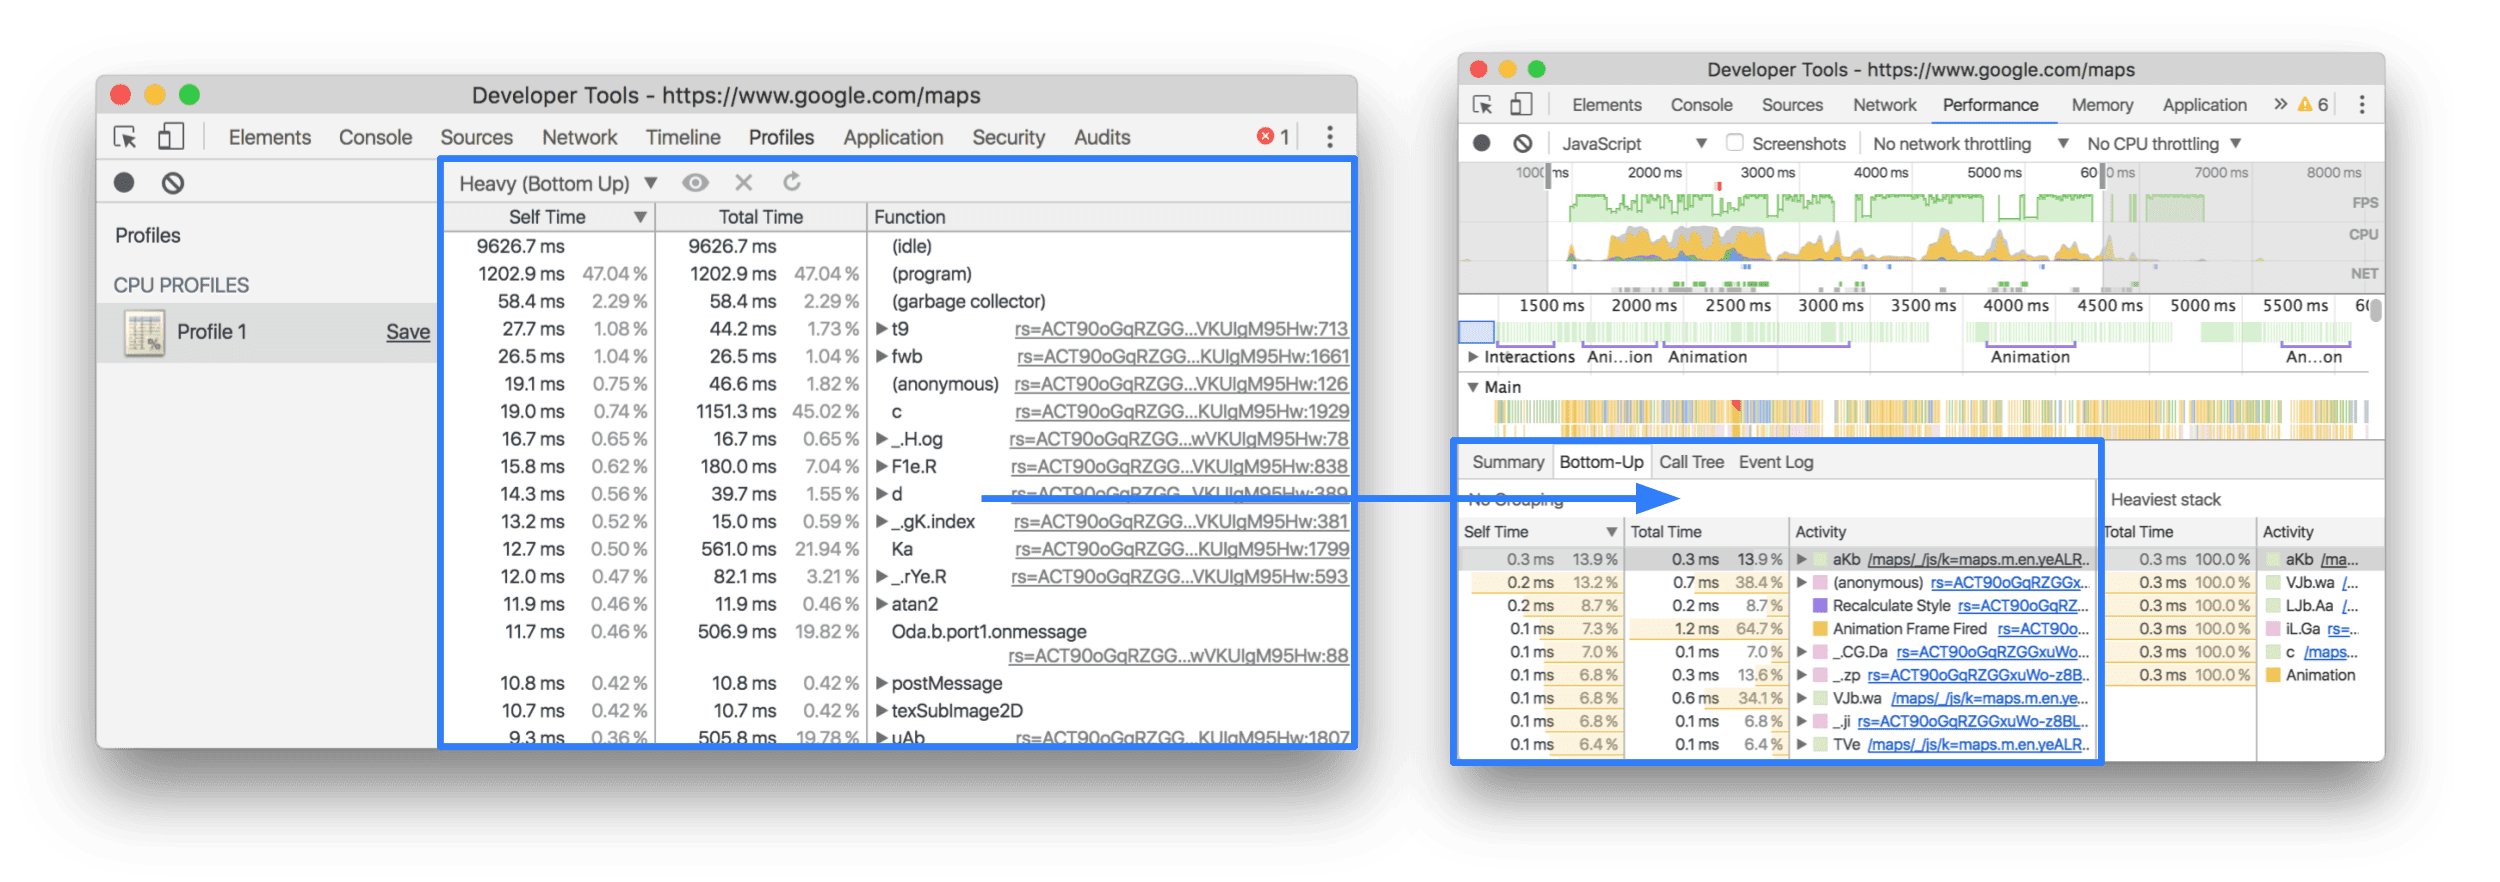
The Heavy (Bottom Up) view is available in the Bottom-Up tab:

And the Tree (Top Down) view is available in the Call Tree tab:

Ping @ChromeDevTools on Twitter or open a GitHub issue on our docs repo if we missed any features, or if you have any other questions about this article.

