An improved debugging experience
Over the past few months the Chrome DevTools team collaborated with the Angular team to launch improvements to the debugging experience in Chrome DevTools. People from both teams worked together and took steps towards enabling developers to debug and profile web applications from the authoring perspective: in terms of their source language and project structure, with access to information that is familiar and relevant to them.
This post takes a look under the hood to see which changes in Angular and Chrome DevTools were required to achieve this. Even though some of these changes are demonstrated through Angular, they can be applied to other frameworks as well. The Chrome DevTools team encourages other frameworks to adopt the new console APIs and source map extension points so they too can offer a better debugging experience to their users.
Ignore-listing code
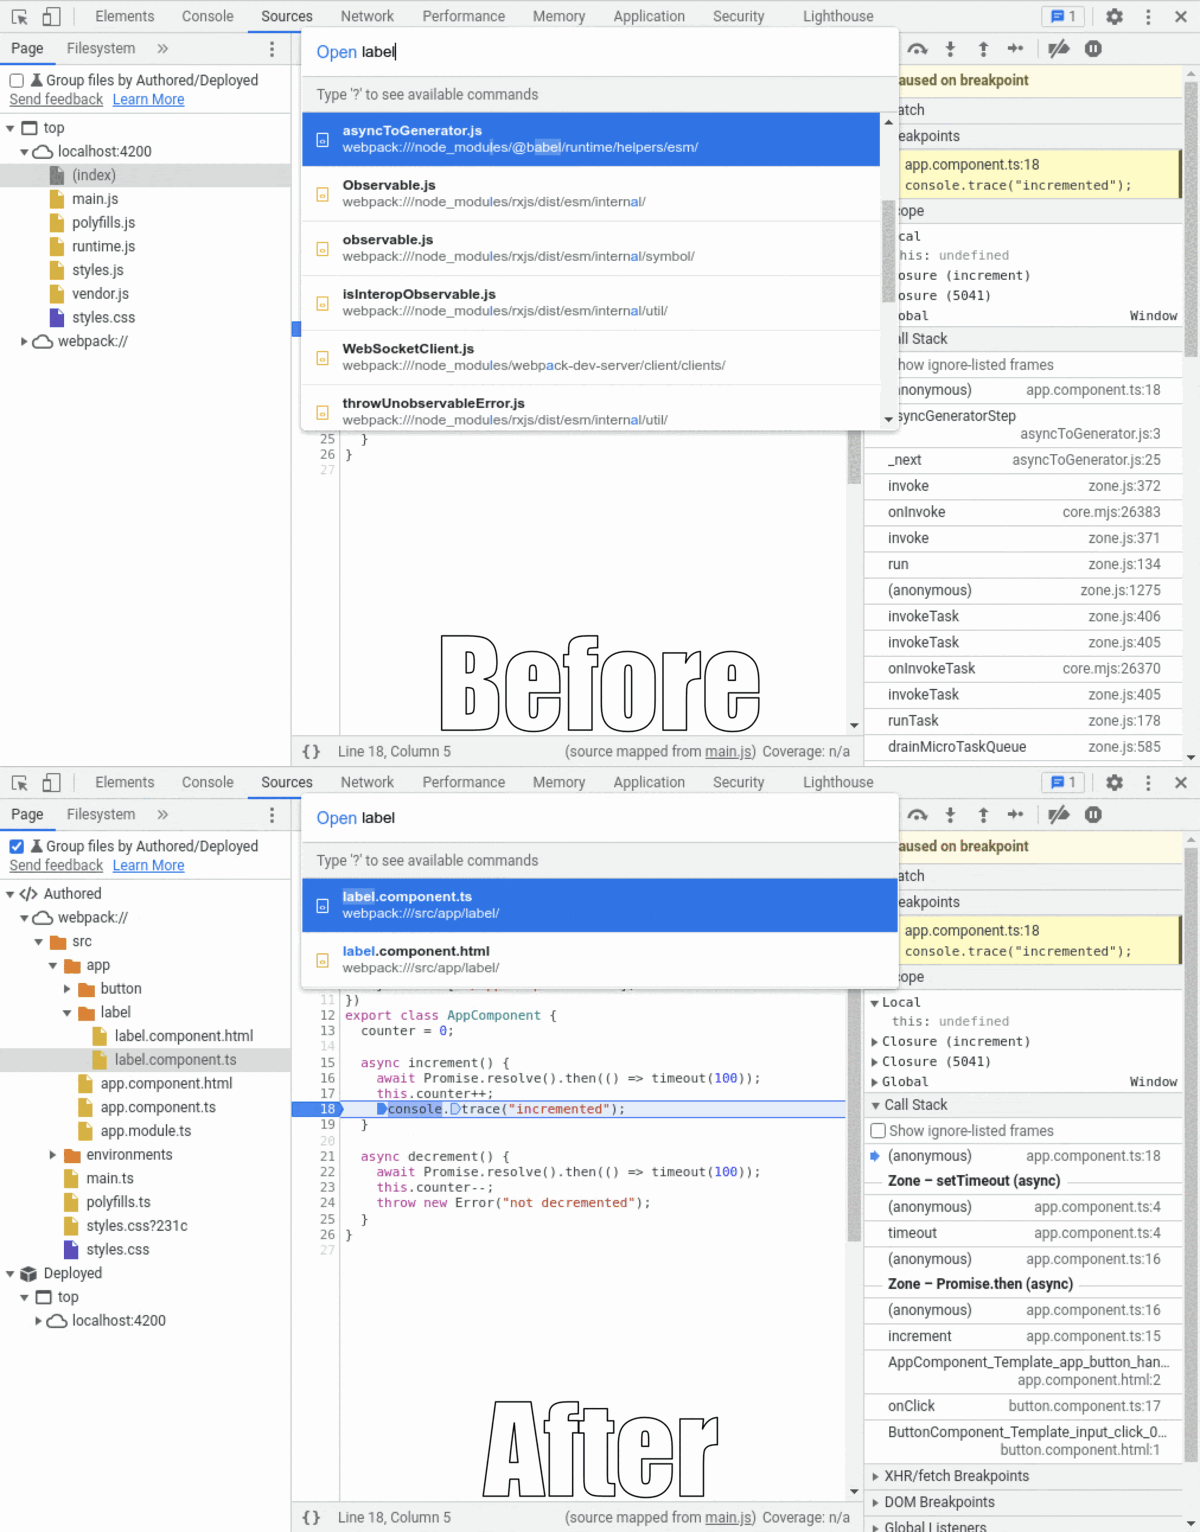
When debugging applications using Chrome DevTools, authors generally only want to see just their code, not that of the framework underneath or some dependency tucked away in the node_modules folder.
To achieve this, the DevTools team has introduced an extension to source maps, called x_google_ignoreList. This extension is used to identify third-party sources such as framework code or bundler-generated code. When a framework uses this extension, authors now automatically avoid code that they don't want to see or step through without having to manually configure this beforehand.
In practice, Chrome DevTools can automatically hide code identified as such in stack traces, the Sources tree, the Quick Open dialog, and also improve the stepping and resuming behavior in the debugger.

The x_google_ignoreList source map extension
In source maps, the new x_google_ignoreList field refers to the sources array, and lists the indices of all the known third-party sources in that source map. When parsing the source map, Chrome DevTools will use this to figure out which sections of the code should be ignore-listed.
Below is a source map for a generated file out.js. There are two original sources that contributed to generating the output file: foo.js and lib.js. The former is something a web site developer wrote and the latter is a framework they used.
{
  "version" : 3,
  "file": "out.js",
  "sourceRoot": "",
  "sources": ["foo.js", "lib.js"],
  "sourcesContent": ["...", "..."],
  "names": ["src", "maps", "are", "fun"],
  "mappings": "A,AAAB;;ABCDE;"
}
The sourcesContent is included for both of these original sources and Chrome DevTools would display these files by default across the Debugger:
- As files in the Sources tree.
- As results in the Quick Open dialog.
- As mapped call frame locations in error stack traces while paused on a breakpoint and while stepping.
There is one additional piece of information that can now be included in source maps to identify which of those sources is first or third-party code:
{
  ...
  "sources": ["foo.js", "lib.js"],
  "x_google_ignoreList": [1],
  ...
}
The new x_google_ignoreList field contains a single index referring to the sources array: 1. This specifies that the regions mapped to lib.js are in fact third-party code that should be automatically added to the ignore list.
In a more complex example, shown below, the indices 2, 4, and 5 specify that regions mapped to lib1.ts, lib2.coffee, and hmr.js are all third-party code that should be automatically added to the ignore list.
{
  ...
  "sources": ["foo.html", "bar.css", "lib1.ts", "baz.js", "lib2.coffee", "hmr.js"],
  "x_google_ignoreList": [2, 4, 5],
  ...
}
If you’re a framework or bundler developer, make sure the source maps generated during the build process include this field in order to hook into these new capabilities in Chrome DevTools.
x_google_ignoreList in Angular
As of Angular v14.1.0, the contents of the node_modules and webpack folders have been marked as “to ignore”.
This was achieved through a change in angular-cli by creating a plugin that hooks into webpack’s Compiler module
The webpack plugin that our engineers created hooks into the PROCESS_ASSETS_STAGE_DEV_TOOLING stage and populates the x_google_ignoreList field in the source maps for the final assets that webpack generates and the browser loads.
const map = JSON.parse(mapContent) as SourceMap;
const ignoreList = [];

for (const [index, path] of map.sources.entries()) {
  if (path.includes('/node_modules/') || path.startsWith('webpack/')) {
    ignoreList.push(index);
  }
}

map[`x_google_ignoreList`] = ignoreList;
compilation.updateAsset(name, new RawSource(JSON.stringify(map)));
Linked stack traces
Stack traces answer the question of “how did I get here”, but oftentimes this is from the machine’s perspective, and not necessarily something that matches the developer’s perspective or their mental model of the application runtime. This is especially true when some operations are scheduled to happen asynchronously later: it could still be interesting to know the “root cause” or the scheduling side of such operations, but that’s exactly something that won’t be part of an asynchronous stack trace.
V8 internally has a mechanism for keeping track of such asynchronous tasks when standard browser scheduling primitives are used, such as setTimeout. This is done by default in those cases, so the developers can inspect these already! But in more complex projects, it’s not as simple as that, especially when using a framework with more advanced scheduling mechanisms—for example, one that performs zone tracking, custom task queueing, or that splits updates into several units of work that are run over time.
To address this, DevTools exposes a mechanism called the “Async Stack Tagging API” on the console object, that enables framework developers to hint both the locations where operations are scheduled as well as where these operations are executed.
The Async Stack Tagging API
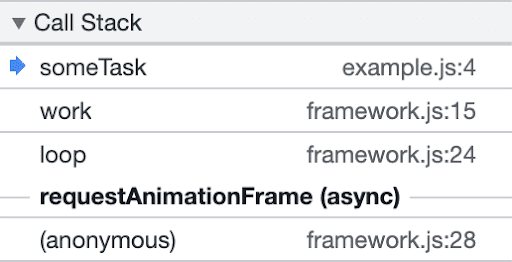
Without Async Stack Tagging, stack traces for code that is asynchronously executed in complex ways by frameworks, shows up with no connection to the code where it was scheduled.

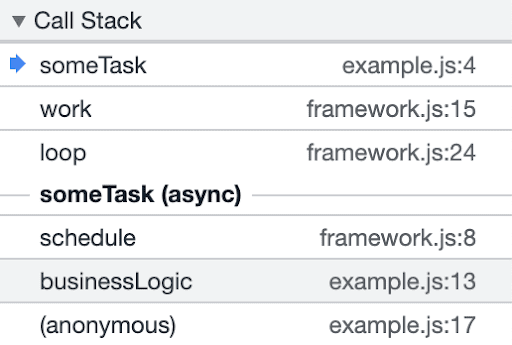
With Async Stack Tagging it is possible to provide this context, and the stack trace looks like this:

To achieve this, use a new console method named console.createTask() which the Async Stack Tagging API provides. Its signature is as follows:
interface Console {
  createTask(name: string): Task;
}

interface Task {
  run<T>(f: () => T): T;
}
Invoking console.createTask() returns a Task instance which you can later use to run the async code.
// Task Creation
const task = console.createTask(name);

// Task Execution
task.run(f);
The asynchronous operations can also be nested, and the “root causes” will be displayed in the stack trace in sequence.
Tasks can be run any number of times and the work payload can differ between each run. The call stack at the scheduling site will be remembered until the task object is garbage collected.
The Async Stack Tagging API in Angular
In Angular, changes have been made to NgZone – Angular’s execution context that persists across async tasks.
When scheduling a task it uses console.createTask() when available. The resulting Task instance is stored for further use. Upon invoking the task, NgZone will use the stored Task instance to run it.
These changes landed in Angular’s NgZone 0.11.8 through pull requests #46693 and #46958.
Friendly Call Frames
Frameworks often generate code from all kinds of templating languages when building a project, such as Angular or JSX templates that turn HTML-looking code into plain JavaScript that eventually runs in the browser. Sometimes, these kinds of generated functions are given names that aren’t very friendly — either single letter names after they’re minified or some obscure or unfamiliar names even when they’re not.
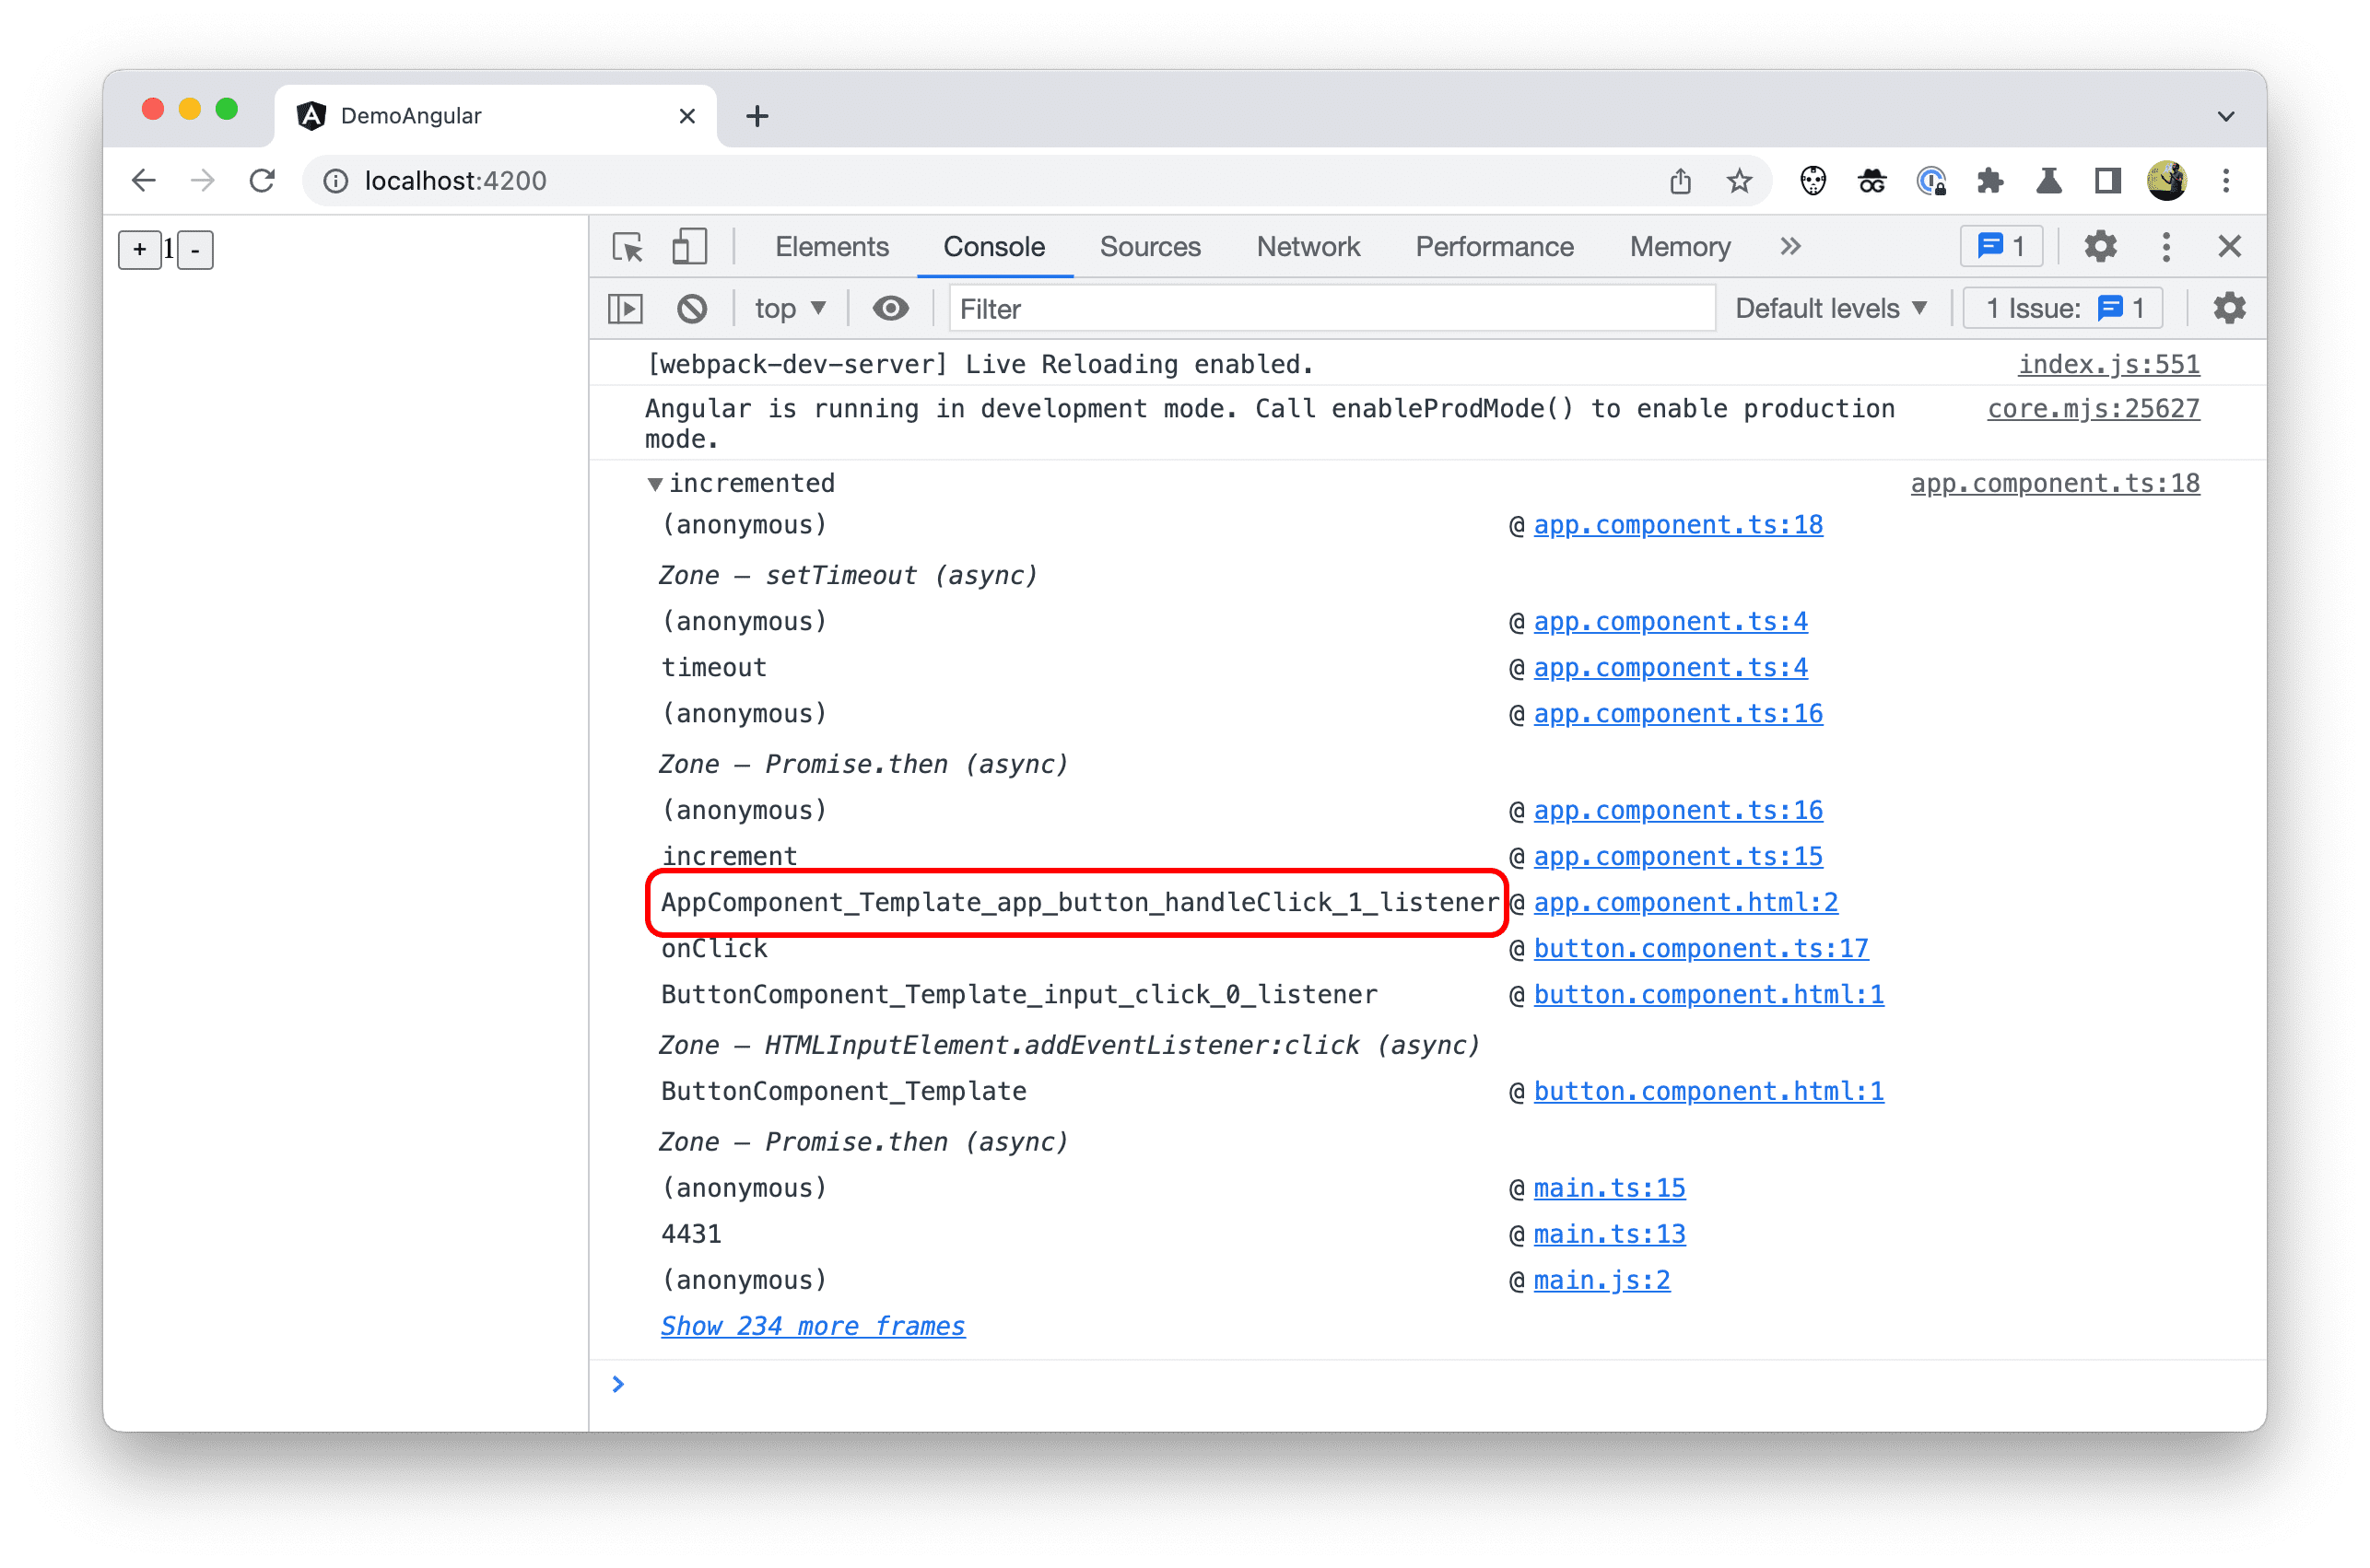
In Angular it’s not uncommon to see call frames with names such as AppComponent_Template_app_button_handleClick_1_listener in stack traces.

To address this, Chrome DevTools now supports renaming these functions through source maps. If a source map has a name entry for the start of a function scope (that is, the left paren of the parameter list), the call frame should display that name in the stack trace.
Friendly Call Frames in Angular
Renaming call frames in Angular is an ongoing effort. We expect these improvements to land gradually over time.
While parsing the HTML templates that authors have written, the Angular compiler generates TypeScript code, which is eventually transpiled into JavaScript code that the browser loads and runs.
As part of this code generation process, source maps are also created. We are currently exploring ways of including function names in the “names” field of source maps, and referencing those names in the mappings between the generated code and original code.
For example, if a function for an event listener is generated and its name is either unfriendly or removed during minification, source maps can now include the more friendly name for this function in the “names” field and the mapping for the beginning of the function scope can now refer to this name (that is, the left paren of the parameter list). Chrome DevTools will then use these names to rename call frames in stack traces.
Looking ahead
Using Angular as a test pilot to verify our work has been a wonderful experience. We would love to hear from framework developers and provide us feedback on these extension points.
There are more areas that we would like to explore. In particular, how to improve the profiling experience in DevTools.


