The Chrome Web Store is home to themes and extensions for a growing number of web businesses. To accommodate the needs of these publishers, we are rolling out a revamped item analytics experience for the Chrome Web Store Developer Dashboard.
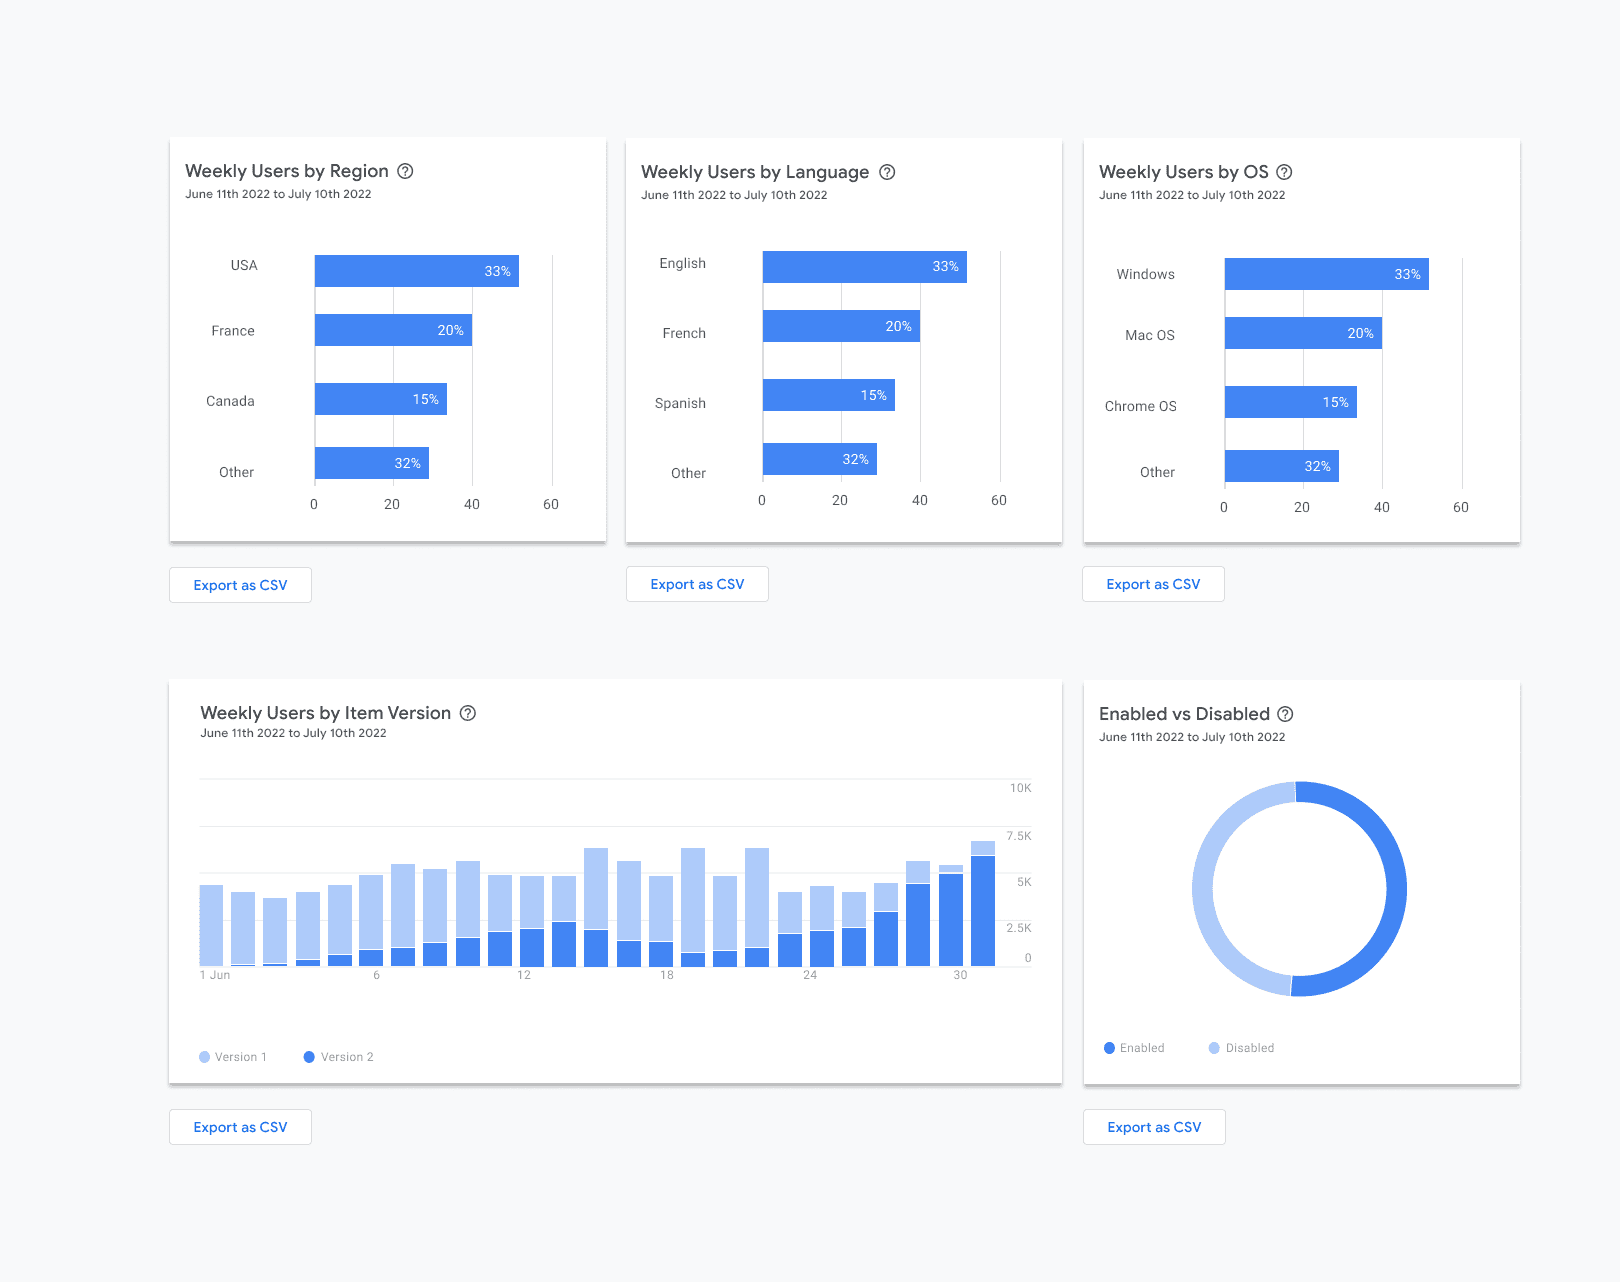
Simple and easy to understand at a glance
The improved analytics dashboard is designed to be easily scannable and understandable. To this end, the visualizations and graphs have been updated with simplicity in mind.
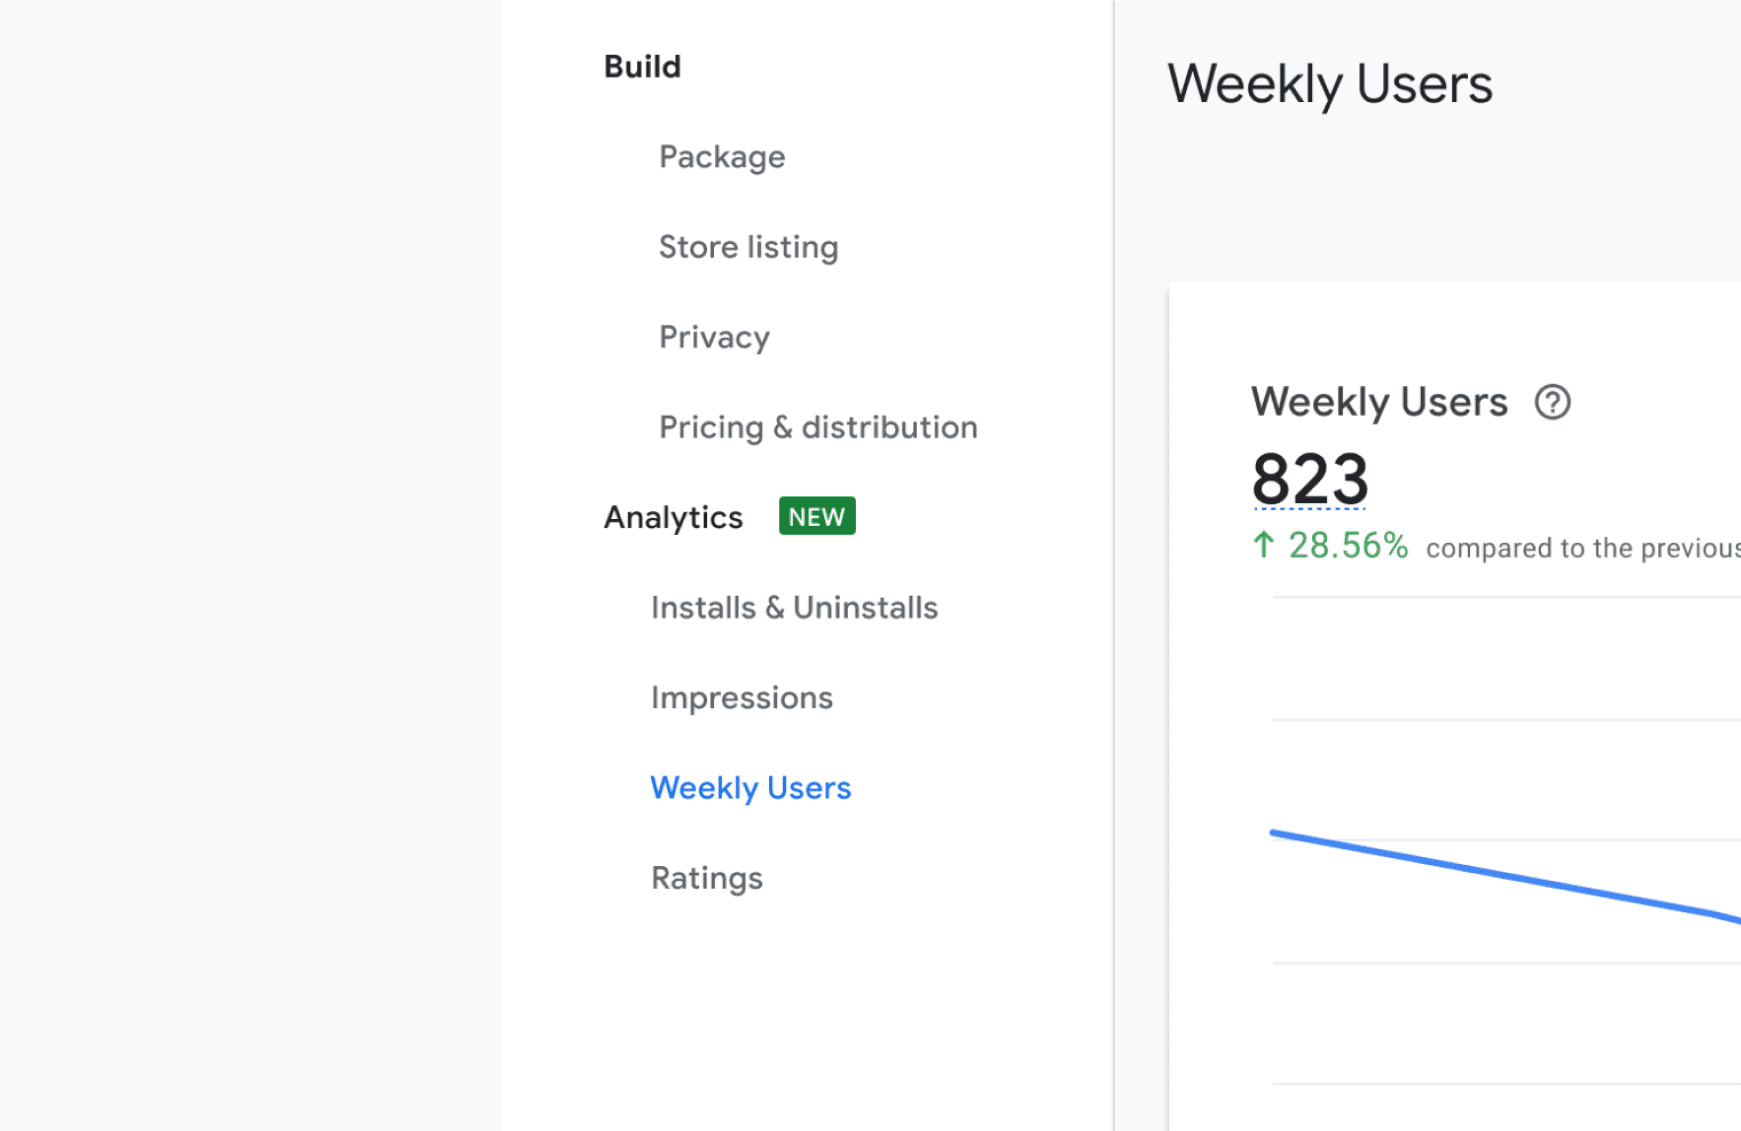
The former "Stats" tab has been rearranged and reorganized into 3 separate pages: "Installs & Uninstalls," "Impressions," and "Weekly Users." Each of these pages has a top-level graph showing the most important metric for the tab and supplemental breakout data beneath the main graph.
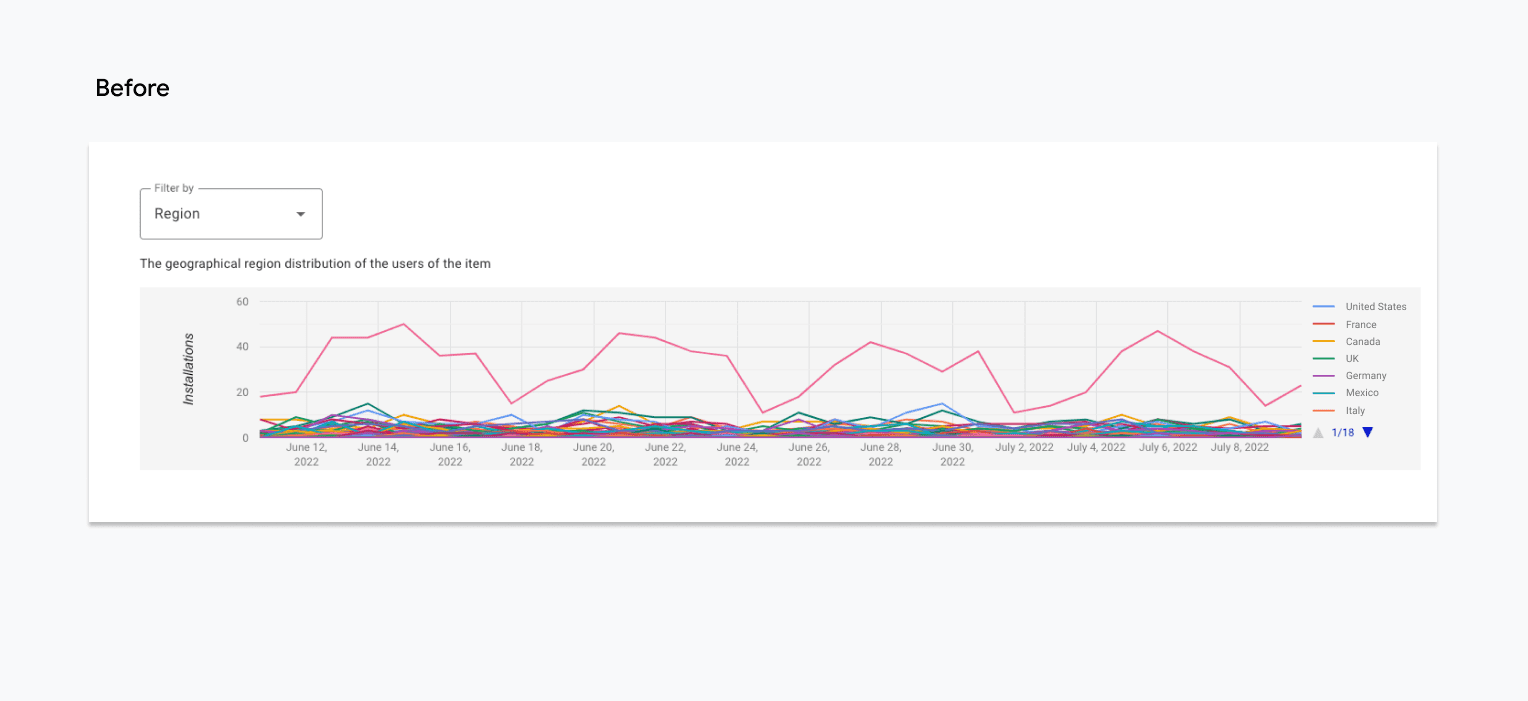
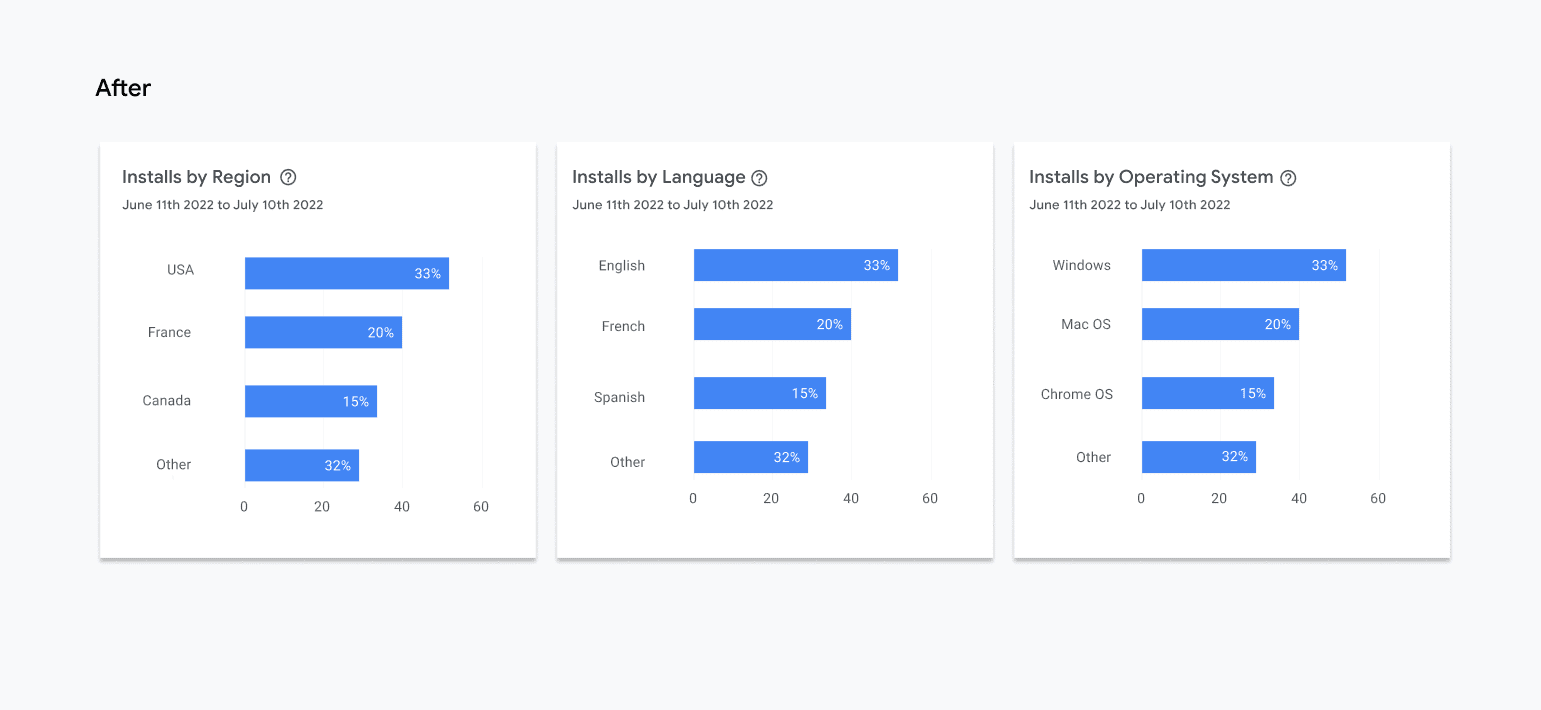
The visualizations on the dashboard have been pared down to focus on only the most important information. As an example, for "Installs by Region," instead of showing dozens of indistinguishable lines on a crowded graph, the dashboard now displays the relative popularity of the top regions as a percentage of total installs for a given period of time.
We also believe developers should be able to immediately see how their extension is trending month to month, as well as key inflection points on their extension’s performance. This trend data is calculated automatically and displayed prominently on the main graph of each new analytics tab.
While developers still have the ability to export more detailed metrics as a CSV, they can now see at a glance the most critical details needed to make decisions about their item.
Intentional and useful data consolidated and upfront
One of the new tabs - Impressions - has been upgraded with new metrics and filters. It recognizes the importance of letting publishers know how popular their item listings are and where the traffic is coming from.
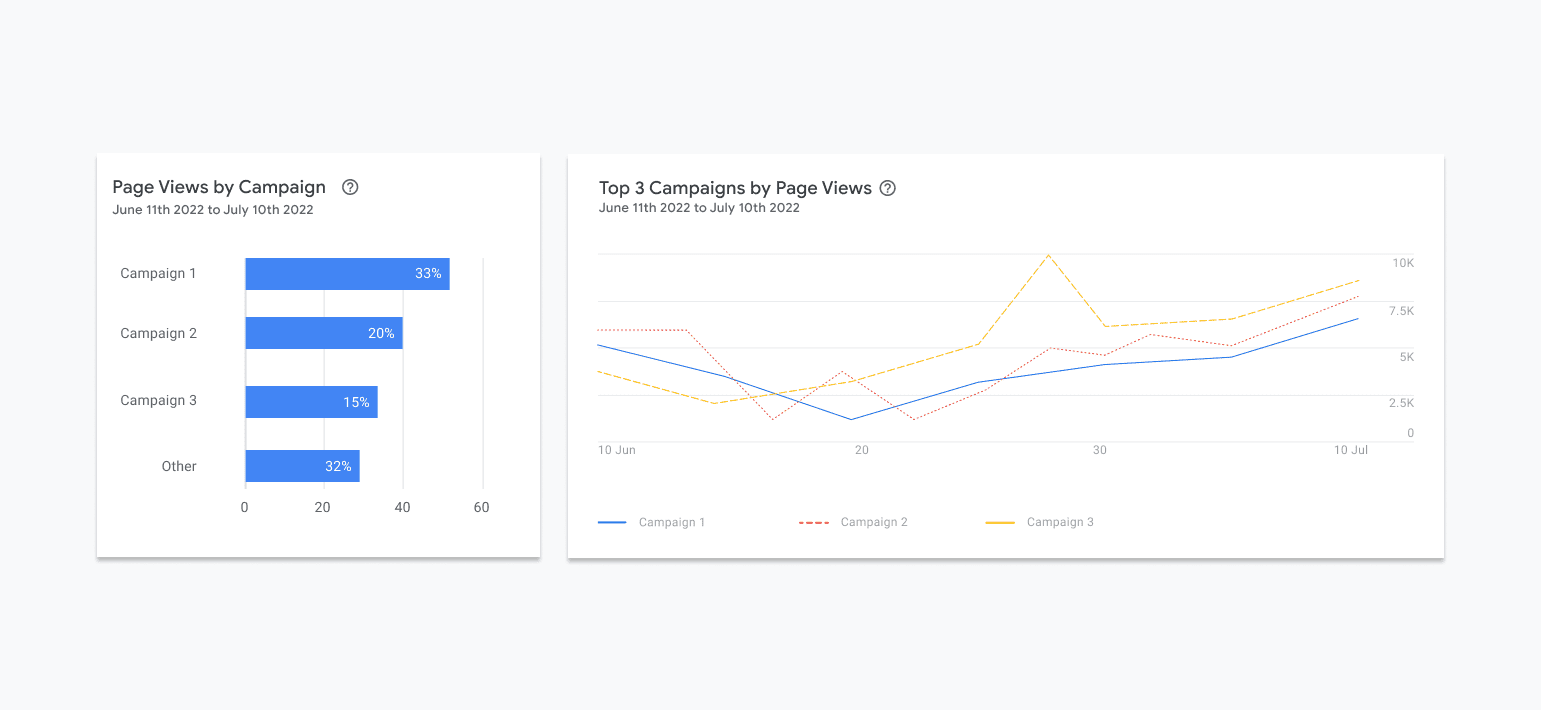
The main graph on the Impressions tab is "Page views", which measures the number of views of the item’s store listing page. For publishers that use UTM parameters for traffic attribution, they will now see a breakdown of this page view data by utm_source, utm_medium, and utm_campaign.
Publishers can also view the impressions of their item shown to users navigating the web store, such as in "Recommended for You" sections and in other places the item is featured. This additional transparency helps developers better understand how users find their items in the store.
The Chrome Web Store team is committed to continuing to improve and refine the Analytics dashboard to enable publishers to effectively monitor and iterate on their store items. The new analytics experience is going live today and can be viewed by developers for all their published items.


