![Kayce Basques](https://web.dev/images/authors/kaycebasques.jpg) Kayce Basques [X](https://twitter.com/kaycebasques) [GitHub](https://github.com/kaycebasques)

<br />

This guide teaches you how to use Chrome DevTools to view a web page's resources. Resources are the
files that a page needs in order to display correctly. Examples of resources include CSS,
JavaScript, and HTML files, as well as images.

This guide assumes that you're familiar with the basics of [web development](https://developer.mozilla.org/docs/Learn) and [Chrome
DevTools](https://developer.chrome.com/docs/devtools/overview#start).

## Open resources

When you know the name of the resource that you want to inspect, the **Command Menu** provides a
fast way of opening the resource.

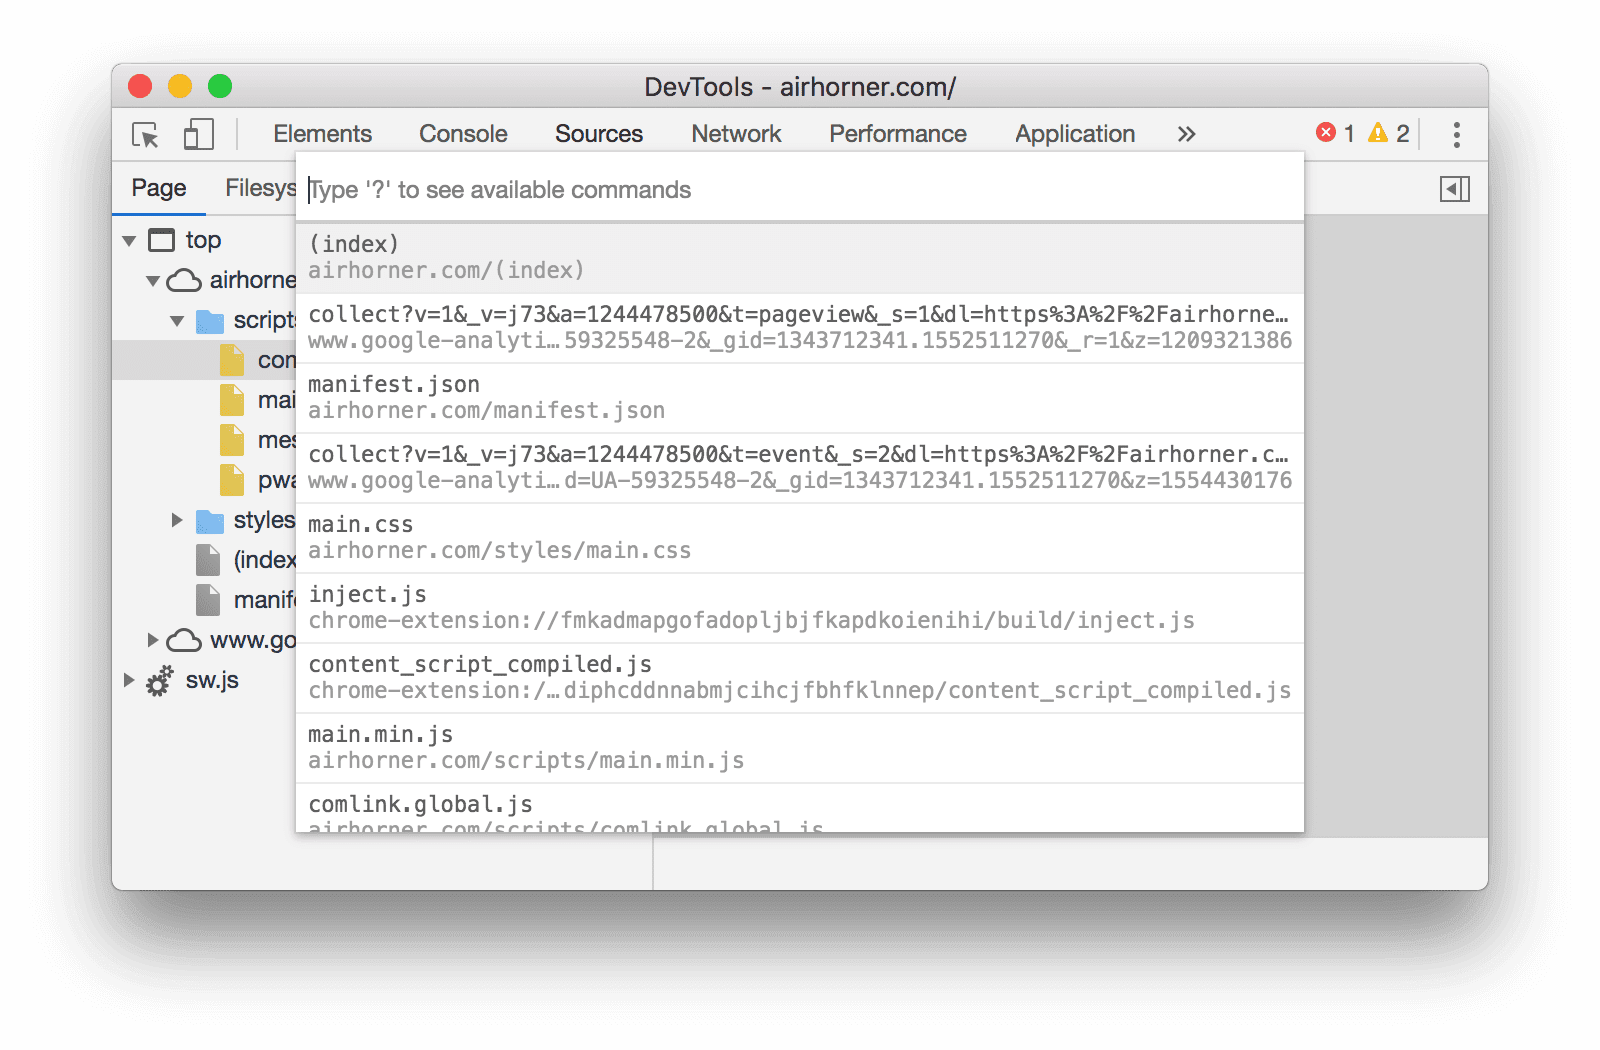
1. Press <kbd>Control</kbd>+<kbd>P</kbd> or <kbd>Command</kbd>+<kbd>P</kbd> (Mac). The **Open
   File** dialog opens.
   ![The Open File dialog](https://developer.chrome.com/static/docs/devtools/resources/image/the-open-file-dialog-900264467667a.png)

   **Figure 1** . The **Open File** dialog
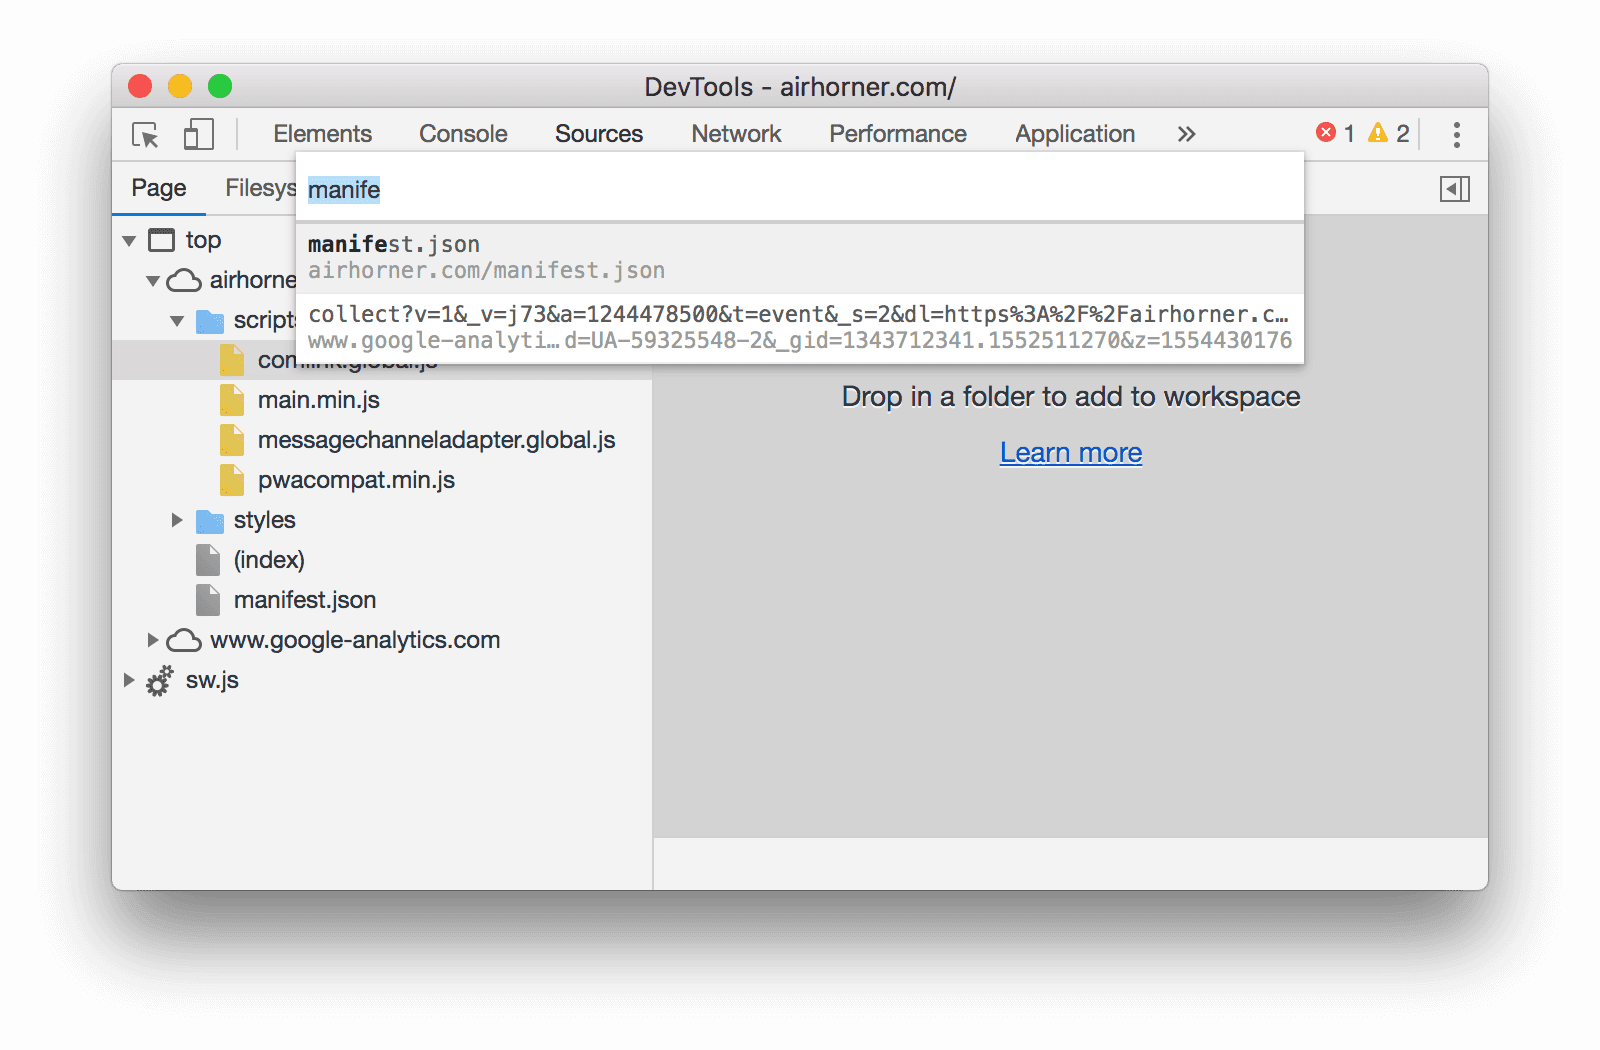
2. Select the file from the dropdown, or start typing the filename and press <kbd>Enter</kbd> once
   the correct file is highlighted in the autocomplete box.
   ![Typing a filename in the Open File dialog](https://developer.chrome.com/static/docs/devtools/resources/image/typing-filename-the-ope-70f00e3b3eabc.png)

   **Figure 2** . Typing a filename in the **Open File** dialog

### Open resources in the Network panel

See [Inspect a resource's details](https://developer.chrome.com/docs/devtools/network.md.txt#details).

![Inspecting a resource in the Network panel](https://developer.chrome.com/static/docs/devtools/resources/image/inspecting-resource-the-9c28cda2491e.png)

**Figure 3** . Inspecting a resource in the **Network** panel

### Reveal resources in the Network panel from other panels

The [Browse resources](https://developer.chrome.com/docs/devtools/resources.md.txt#browse) section below shows you how to view resources from various parts of the
DevTools UI. If you ever want to inspect a resource in the **Network** panel, right-click the
resource and select **Reveal in Network panel**.

![Reveal in Network panel](https://developer.chrome.com/static/docs/devtools/resources/image/reveal-network-panel-d33d37808bf67.png)

**Figure 4** . The **Reveal in Network panel** option

## Browse resources

### Browse resources in the Network panel

See [Log network activity](https://developer.chrome.com/docs/devtools/network.md.txt#load).

![Page resources in the Network Log](https://developer.chrome.com/static/docs/devtools/resources/image/page-resources-the-netwo-5aae0ad2913ba.png)

**Figure 5**. Page resources in the Network Log

### Browse by directory

To view a page's resources organized by directory:

1. Click the **Sources** tab to open the **Sources** panel.
2. Click the **Page** tab to show the page's resources. The **Page** pane opens.

   ![The Page pane](https://developer.chrome.com/static/docs/devtools/resources/image/the-page-pane-ac301f62d982.png)

   **Figure 6** . The **Page** pane

   Here's a breakdown of the non-obvious items in **Figure 6**:
   - **top** is the main document [browsing context](https://developer.mozilla.org/docs/Web/HTML/Element/iframe).
   - **airhorner.com** represents a domain. All resources nested under it come from that domain. For example, the full URL of the **comlink.global.js** file is probably `https://airhorner.com/scripts/comlink.global.js`.
   - **scripts** is a directory.
   - **(index)** is the main HTML document.
   - **iu3** is another browsing context. This context was probably created by an `<iframe>` element embedded in the main document HTML.
   - **sw.js** is a service worker execution context.
3. Click a resource to view it in the **Editor**.

   ![Viewing a file in the Editor](https://developer.chrome.com/static/docs/devtools/resources/image/viewing-file-the-editor-0aacf93c27f6c.png)

   **Figure 7** . Viewing a file in the **Editor**

### Browse by filename

By default the **Page** pane groups resources by directory. To disable this grouping and view each
domain's resources as a flat list:

1. Open the **Page** pane. See [Browse by directory](https://developer.chrome.com/docs/devtools/resources.md.txt#directory).
2. Click **More Options** ![More Options](https://developer.chrome.com/static/docs/devtools/resources/image/more-options-e89dff8c23679.png) and
   disable **Group By Folder**.

   ![Group By Folder](https://developer.chrome.com/static/docs/devtools/resources/image/group-folder-0cf9f5cbf413d.png)

   **Figure 8** . The **Group By Folder** option

   Resources are organized by file type. Within each file type the resources are organized
   alphabetically.

   ![The Page pane after disabling Group By Folder](https://developer.chrome.com/static/docs/devtools/resources/image/the-page-pane-disabling-7a05f9890cbc4.png)

   **Figure 9** . The **Page** pane after disabling **Group By Folder**

### Browse by file type

To group resources together based on their file type:

1. Click the **Application** tab. The **Application** panel opens. By default the **Manifest** pane
   usually opens first.

   ![The Application panel](https://developer.chrome.com/static/docs/devtools/resources/image/the-application-panel-67c1779ce4986.png)

   **Figure 10** . The **Application** panel
2. Scroll down to the **Frames** pane.

   ![The Frames pane](https://developer.chrome.com/static/docs/devtools/resources/image/the-frames-pane-9d2432adb0aea.png)

   **Figure 11** . The **Frames** pane
3. Expand the sections that you're interested in.

4. Click a resource to view it.

   ![Viewing a resource in the Application panel](https://developer.chrome.com/static/docs/devtools/resources/image/viewing-resource-the-ap-873c25a92d586.png)

   **Figure 11** . Viewing a resource in the **Application** panel

#### Browse files by type in the Network panel

See [Filter by resource type](https://developer.chrome.com/docs/devtools/network.md.txt#type).

![Filtering for CSS in the Network Log](https://developer.chrome.com/static/docs/devtools/resources/image/filtering-css-the-netwo-f90c7f5fd51e4.png)

**Figure 12**. Filtering for CSS in the Network Log