Use the Reporting API to monitor security violations, deprecated API calls, and
more.
 Maud Nalpas [GitHub](https://github.com/maudnals) [LinkedIn](https://www.linkedin.com/in/maudnalpas) [Bluesky](https://bsky.app/profile/maudnals.bsky.social)
> [!CAUTION]
> **Caution:**
>
> This is an API guide with detailed usage examples for the **Reporting
> API (v1)** , which uses the `Reporting-Endpoints` header.
>
> If you're using the legacy Reporting API (`Report-To` header), read about [API migration](https://developer.chrome.com/docs/capabilities/web-apis/reporting-api) instead.
>
> Are you looking for [Network Error Logging](https://web.dev/network-error-logging) documentation? Head over to Network Error logging instead.
Some errors only occur in production. You won't see them locally or during
development because **real users** , **real networks** , and **real devices**
change the game. The Reporting API helps catch some of these errors---such
as security violations or deprecated and soon-to-be-deprecated API calls across
your site, and transmits them to an endpoint you've specified.
It lets you declare what you'd like to monitor using HTTP headers, and is
operated **by the browser**.
Setting up the Reporting API gives you peace of mind that when users experience
these types of errors, you'll know, so you can fix them.
This post covers what this API can do and how to use it. Lets dive in!
## Overview
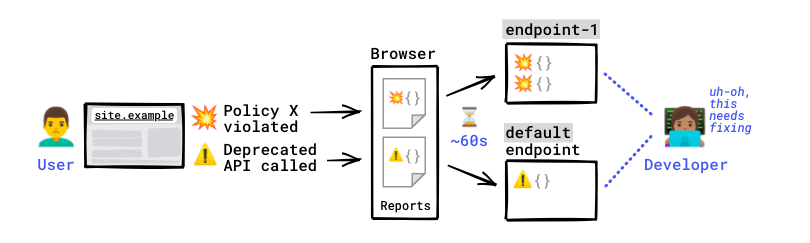 How reports are generated and sent.
Lets assume that your site, `site.example`, has a Content-Security-Policy and a
Document-Policy. Don't know what these do? That's okay, you'll still be able to
understand this example.
You decide to monitor your site in order to know when these policies are
violated, but also because you want to keep an eye on deprecated or
soon-to-be-deprecated APIs your codebase may be using.
To do so, you configure a `Reporting-Endpoints` header, and map these endpoint
names using the `report-to` directive in your policies where needed.
Reporting-Endpoints: main-endpoint="https://reports.example/main", default="https://reports.example/default"
# Content-Security-Policy violations and Document-Policy violations
# will be sent to main-endpoint
Content-Security-Policy: script-src 'self'; object-src 'none'; report-to main-endpoint;
Document-Policy: document-write=?0; report-to=main-endpoint;
# Deprecation reports don't need an explicit endpoint because
# these reports are always sent to the `default` endpoint
Something unforeseen happens, and these policies get violated for some of your
users.
Example violations
`index.html`
`script.js`, loaded by `index.html`
// DOCUMENT-POLICY VIOLATION: Attempt to use document.write despite the document policy
try {
document.write('hi
');
} catch (e) {
console.log(e);
}
// DEPRECATION: Call a deprecated API
const webkitStorageInfo = window.webkitStorageInfo;
The browser generates a CSP violation report, a Document-Policy violation
report, and a Deprecation report that capture these issues.
With a short delay---up to a minute---the browser then sends the reports to the
endpoint that was configured for this violation type. The reports are sent
**[out-of-band](https://en.wikipedia.org/wiki/Out-of-band_data)** by the browser
itself (not by your server nor by your site).
The endpoint(s) receive(s) these reports.
You can now access the reports on these endpoints and monitor what went wrong.
You're ready to start troubleshooting the problem that's affecting your users.
Example report
{
"age": 2,
"body": {
"blockedURL": "https://site2.example/script.js",
"disposition": "enforce",
"documentURL": "https://site.example",
"effectiveDirective": "script-src-elem",
"originalPolicy": "script-src 'self'; object-src 'none'; report-to main-endpoint;",
"referrer": "https://site.example",
"sample": "",
"statusCode": 200
},
"type": "csp-violation",
"url": "https://site.example",
"user_agent": "Mozilla/5.0... Chrome/92.0.4504.0"
}
## Use cases and report types
The Reporting API can be configured to help you monitor many types of
interesting warnings or issues that happen throughout your site:
> [!CAUTION]
> **Caution:** [Network Error Logging](https://w3c.github.io/network-error-logging/) isn't listed because it isn't supported in the new version of the API. Check the [migration
> guide](https://developer.chrome.com/blog/reporting-api-migration#network_error_logging) for details.
| Report type | Example of a situation where a report would be generated |
|---|---|
| [CSP](https://developer.mozilla.org/docs/Web/HTTP/CSP) violation (Level 3 only) | You've set a `Content-Security-Policy` (CSP) on one of your pages, but the page is trying to load a script that's not allowed by your CSP. |
| [COOP](https://web.dev/articles/why-coop-coep#coop) violation | You've set a `Cross-Origin-Opener-Policy` on a page, but a cross-origin window is trying to interact directly with the document. |
| [COEP](https://web.dev/articles/why-coop-coep#coep) violation | You've set a `Cross-Origin-Embedder-Policy` on a page, but the document includes a cross-origin iframe that has not opted into being loaded by cross-origin documents. |
| Document Policy violation | The page has a document policy that prevents usage of `document.write`, but a script tries to call `document.write`. |
| [Permissions policy](https://developer.chrome.com/docs/privacy-security/permissions-policy) violation | The page has a permissions policy that prevents microphone usage, and a script that requests audio input. |
| Deprecation warning | The page is using an API that is deprecated or will be deprecated; it calls it directly or using a top-level third-party script. |
| Intervention | The page is trying to do something that the browser decides not to honor, for security, performance or user experience reasons. Example in Chrome: the page uses [`document.write` on slow networks](https://developers.google.com/web/updates/2016/08/removing-document-write) or calls `navigator.vibrate` in a cross-origin frame that the user hasn't interacted with yet. |
| Crash | The browser crashes while your site is open. |
## Reports
The browser sends reports to the endpoint you've configured. It sends requests
that look as follows:
POST
Content-Type: application/reports+json
The payload of these requests is a list of reports.
Example list of reports
[
{
"age": 420,
"body": {
"columnNumber": 12,
"disposition": "enforce",
"lineNumber": 11,
"message": "Document policy violation: document-write is not allowed in this document.",
"policyId": "document-write",
"sourceFile": "https://site.example/script.js"
},
"type": "document-policy-violation",
"url": "https://site.example/",
"user_agent": "Mozilla/5.0... Chrome/92.0.4504.0"
},
{
"age": 510,
"body": {
"blockedURL": "https://site.example/img.jpg",
"destination": "image",
"disposition": "enforce",
"type": "corp"
},
"type": "coep",
"url": "https://dummy.example/",
"user_agent": "Mozilla/5.0... Chrome/92.0.4504.0"
}
]
Here's the data you can find in each of these reports:
| Field | Description |
|---|---|
| `age` | The number of milliseconds between the report's timestamp and the current time. |
| `body` | The actual report data, serialized into a JSON string. The fields contained in a report's `body` are determined by the report's `type`. **⚠️ Reports of different types have different bodies**. |
| `type` | A report type, for example `csp-violation` or `coep`. |
| `url` | The address of the document or worker from which the report was generated. Sensitive data such as username, password, and fragment are [stripped from this URL](https://w3c.github.io/reporting/#capability-urls). |
| `user_agent` | The `User-Agent` header of the request from which the report was generated. |
#### Credentialed reports
Reporting endpoints that have the [same
origin](https://web.dev/articles/same-site-same-origin#same_origin_and_cross_origin)
as the page that generates the report receive the credentials (cookies) in the
requests that contain the reports.
Credentials may give useful additional context about the report; for example,
whether a given user's account is triggering errors consistently, or if a
certain sequence of actions taken on other pages is triggering a report on this
page.
> [!NOTE]
> **Note:** [Cross-origin](https://web.dev/articles/same-site-same-origin#same_origin_and_cross_origin) endpoints don't receive credentials. This is a security measure and can't be changed.
### When and how does the browser send reports?
**Reports are delivered out-of-band from your site**: the browser controls when
they're sent to the configured endpoint(s). There's also no way to control when
the browser sends reports; it captures, queues, and sends them automatically at
a suitable time.
This means that there's little to no performance concern when using the
Reporting API.
**Reports are sent with a delay**---up to a minute---to increase the
chances to send reports in batches. This saves bandwidth to be respectful to the
user's network connection, which is especially important on mobile. The browser
can also delay delivery if it's busy processing higher priority work, or if the
user is on a slow or congested network at the time.
> [!NOTE]
> **Note:** When you're debugging locally, you can turn off this delay for convenience. [See how](https://developer.chrome.com/docs/capabilities/web-apis/reporting-api#save_time).
### Third-party and first-party issues
Reports that are generated due to violations or deprecations happening **on your
page** will be sent to the endpoint(s) you've configured. This includes
violations committed by **third-party scripts** running on your page.
Violations or deprecations that happened **in a cross-origin iframe embedded in
your page** will
**not** be reported to your endpoint(s) (at least not by default). An iframe
could set up its own reporting and even report to your site's---that is, the
first-party's---reporting service; but that's up to the framed site. Also
note that most reports are generated only if a page's policy is violated, and
that your page's policies and the iframe's policies are different.
> [!IMPORTANT]
> **Key point:** In Chrome DevTools, you'll see a console error or warning pop up for violations that are committed by third-party scripts *and* cross-origin iframes. Not all of these will translate into reports being sent to your endpoint: the formers will, the latters won't.
#### Example with deprecations
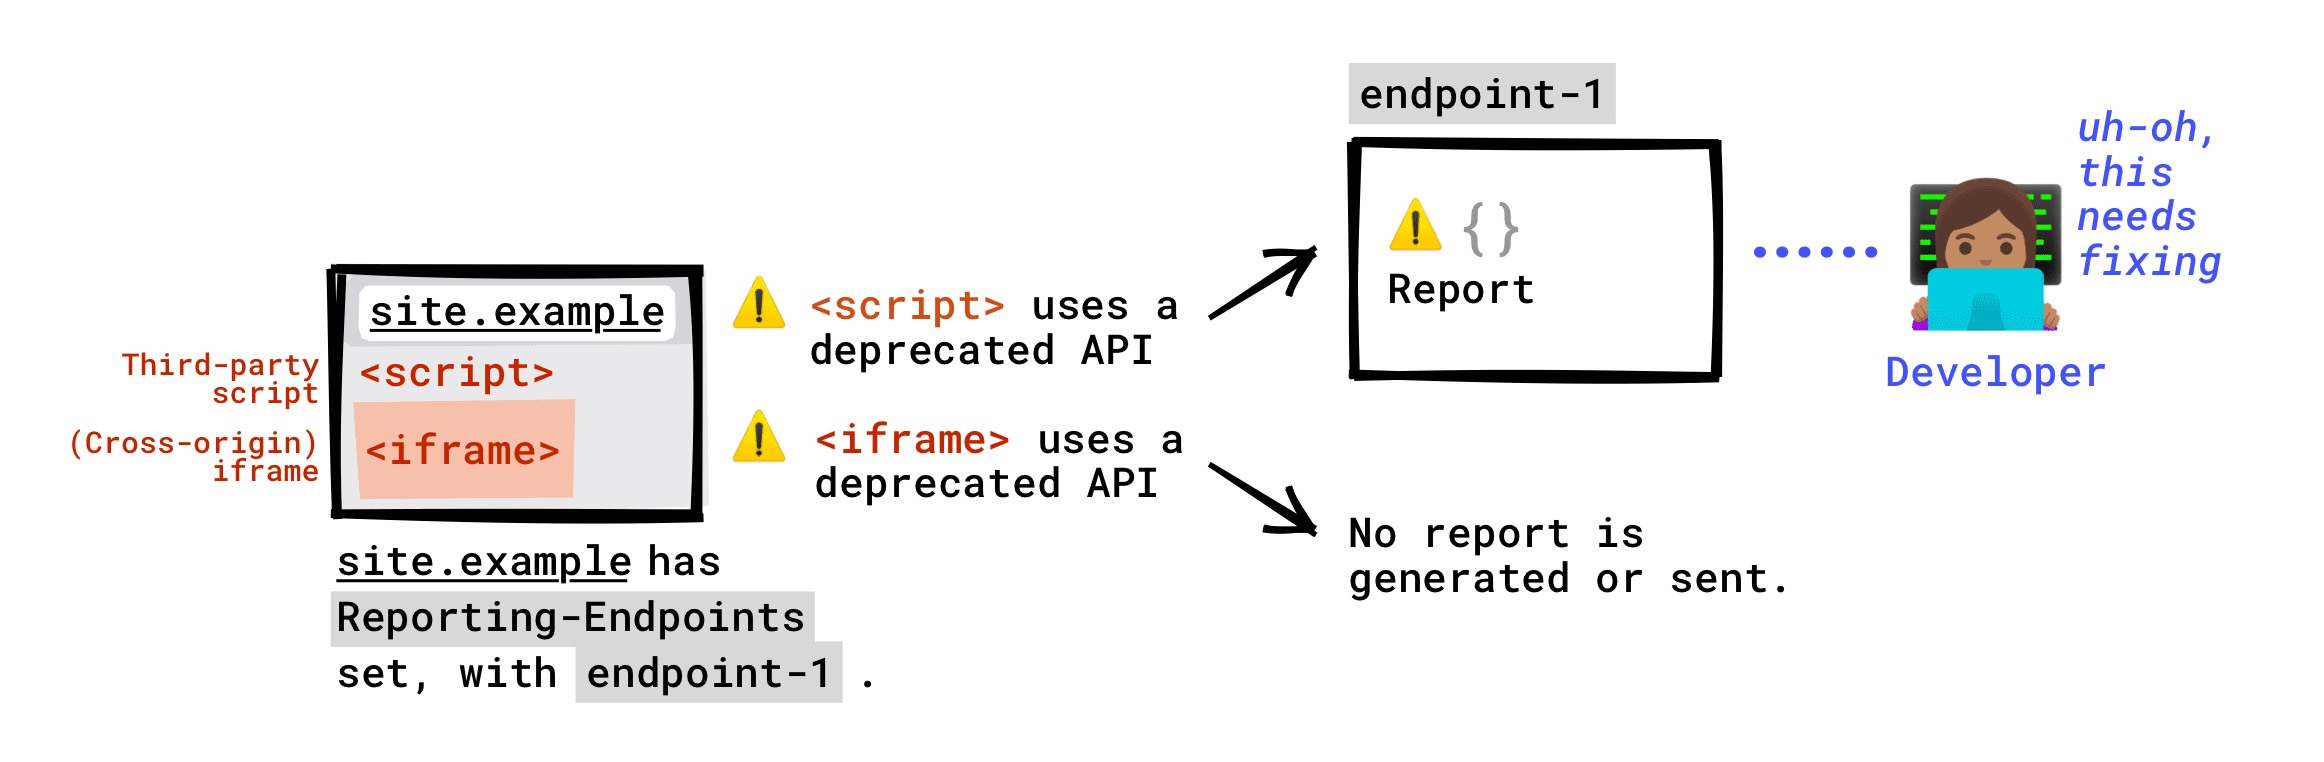 If the Reporting-Endpoints header is set up on your page: deprecated API called by third-party scripts running on your page will be reported to your endpoint. Deprecated API called by an iframe embedded in your page won't be reported to your endpoint. A deprecation report will be generated only if the iframe server has set up Reporting-Endpoints, and this report will be sent to whichever endpoint the iframe's server has set up.
## Browser support
The following table sums up browser support for the **Reporting API v1** , that
is with the `Reporting-Endpoints` header. Browser support for the Reporting API
v0 (`Report-To` header) is the same, except for one report type: Network Error
Logging isn't supported in the new Reporting API. Read the [migration
guide](https://developer.chrome.com/blog/reporting-api-migration#network_error_logging) for details.
| Report type | Chrome | Chrome iOS | Safari | Firefox | Edge |
|---|---|---|---|---|---|
| CSP violation (Level 3 only)\* | ✔ Yes | ✔ Yes | ✔ Yes | ✘ No | ✔ Yes |
| Network Error Logging | ✘ No | ✘ No | ✘ No | ✘ No | ✘ No |
| COOP/COEP violation | ✔ Yes | ✘ No | ✔ Yes | ✘ No | ✔ Yes |
| All other types: Document Policy violation, Deprecation, Intervention, Crash | ✔ Yes | ✘ No | ✘ No | ✘ No | ✔ Yes |
> [!CAUTION]
> **Caution:**
>
> Browser support for CSP reporting is different from other reporting types, because CSP has been around for some time. CSP reports can be generated using:
>
> - The legacy `report-uri` directive that doesn't rely on the Reporting API.
> - The newer `report-to` directive that relies on the Reporting API (and the `Reporting-To` or the newer `Reporting-Endpoints` headers).
This table only summarizes support for `report-to` with the new
`Reporting-Endpoints` header. Read the [CSP reporting migration
tips](https://developer.chrome.com/blog/reporting-api-migration#csp_reporting_migration) if you're looking
to migrate to `Reporting-Endpoints`.
## Using the Reporting API
### Decide where reports should be sent
You have two options:
- Send reports to an existing report collector service.
- Send reports to a reporting collector you build and operate yourself.
#### Option 1: Use an existing report collector service
Some examples of report collector services are:
- [report-uri](https://report-uri.com)
- [uriports](https://uriports.com)
- [HeaderHawk](https://headerhawk.com/)
- [Sentry](https://docs.sentry.io/)
If you know of other solutions, [open an
issue](https://github.com/GoogleChrome/web.dev/issues) to let us know, and we'll
update this post!
**Beside pricing, consider the following points when selecting a report
collector:** 🧐
- Does this collector support all report types? For example, not all reporting endpoint solutions support COOP/COEP reports.
- Are you comfortable sharing any of your application's URLs with a third-party report collector? Even if the browser strips sensitive information from these URLs, sensitive information [may get leaked this
way](https://w3c.github.io/reporting/#capability-urls). If this sounds too risky for your application, operate your own reporting endpoint.
#### Option 2: Build and operate your own report collector
Building your own server that receives reports isn't that trivial. To get
started, you can fork our lightweight boilerplate. It's built with Express and
can receive and display reports.
When you build your own report collector:
- Check for `POST` requests with a `Content-Type` of `application/reports+json` to recognize reports requests sent by the browser to your endpoint.
- If your endpoint lives on a different origin than your site, ensure it supports [CORS preflight
requests](https://developer.mozilla.org/docs/Glossary/Preflight_request).
> [!IMPORTANT]
> **Key point:** Make sure your endpoint supports [CORS preflight
> requests](https://developer.mozilla.org/docs/Glossary/Preflight_request).
#### Option 3: Combine Option 1 and 2
You may want to let a specific provider take care of some types of reports, but
have an in-house solution for others.
In this case, set multiple endpoints as follows:
Reporting-Endpoints: endpoint-1="https://reports-collector.example", endpoint-2="https://my-custom-endpoint.example"
### Configure the `Reporting-Endpoints` header
Set a `Reporting-Endpoints` response header. Its value must be one or a series
of comma-separated key-value pairs:
Reporting-Endpoints: main-endpoint="https://reports.example/main", default="https://reports.example/default"
If you're migrating from the legacy Reporting API to the new Reporting API, it
may make sense to set **both** `Reporting-Endpoints` and `Report-To`. See
details in the [migration guide](https://developer.chrome.com/blog/reporting-api-migration#migration_steps).
In particular, if you're using reporting for `Content-Security-Policy`
violations using the `report-uri` directive only, check the [migration steps for
CSP reporting](https://developer.chrome.com/blog/reporting-api-migration#migration_steps_for_csp_reporting).
Reporting-Endpoints: main-endpoint="https://reports.example/main", default="https://reports.example/default"
Report-To: ...
#### Keys (endpoint names)
Each key can be a name of your choice, such as `main-endpoint` or `endpoint-1`.
You can decide to set different named endpoints for different report
types---for example, `my-coop-endpoint`, `my-csp-endpoint`. With this, you
can route reports to different endpoints depending on their type.
If you want to receive **intervention** , **deprecation** , **crash** reports or a
combination of these, set an endpoint named `default`.
If the `Reporting-Endpoints` header defines no `default` endpoint, reports of
this type will **not** be sent (although they will be generated).
> [!IMPORTANT]
> **Key point:** Despite its name, `default` is **not** a fallback endpoint. For example, if you set up `report-to my-endpoint` for `Document-Policy` and omit to define `my-endpoint` in `Reporting-Endpoints`, `Document-Policy` violations reports will be generated but will **not** be sent because the browser doesn't know where to send them to.
#### Values (URLs)
Each value is a URL of your choice, where the reports will be sent to. The URL
to set here depends on what you decided in Step 1.
An endpoint URL:
- Must start with a slash (`/`). Relative paths are **not** supported.
- Can be cross-origin; but in that case [credentials are not sent with the
reports](https://developer.chrome.com/docs/capabilities/web-apis/reporting-api#credentialed_reports).
#### Examples
Reporting-Endpoints: my-coop-endpoint="https://reports.example/coop", my-csp-endpoint="https://reports.example/csp", default="https://reports.example/default"
You can then use each named endpoint in the appropriate policy, or use one
single endpoint across all policies.
#### Where to set the header?
In the new Reporting API---the one that is covered in this post---
reports are scoped to **documents** . This means that for one given origin,
different documents, such as `site.example/page1` and `site.example/page2`, can
send reports to different endpoints.
To receive report for violations or deprecations take place on any page of your
site, set the header as a middleware on all responses.
Here's an example in Express:
const REPORTING_ENDPOINT_BASE = 'https://report.example';
const REPORTING_ENDPOINT_MAIN = `${REPORTING_ENDPOINT_BASE}/main`;
const REPORTING_ENDPOINT_DEFAULT = `${REPORTING_ENDPOINT_BASE}/default`;
app.use(function (request, response, next) {
// Set up the Reporting API
response.set(
'Reporting-Endpoints',
`main-endpoint="${REPORTING_ENDPOINT_MAIN}", default="${REPORTING_ENDPOINT_DEFAULT}"`,
);
next();
});
> [!NOTE]
> **Note:** This is different from the legacy Reporting API (`Report-To` header), where you could set an "ambient" endpoint for one page, and automatically get reports for any page on the same origin. If you're migrating from the legacy Reporting API to the new Reporting API, check the [migration guide](https://developer.chrome.com/blog/reporting-api-migration).
### Edit your policies
Now that the `Reporting-Endpoints` header is configured, add a `report-to`
directive to each policy header for which you want to receive violation reports.
The value of `report-to` should be one of the named endpoints you've configured.
You can use the multiple endpoint for multiple policies, or use different
endpoints across policies.

`report-to` is not needed for **deprecation** , **intervention** and **crash**
reports. These reports aren't bound to any policy. They're generated as long as
a `default` endpoint is set up and are sent to this `default` endpoint.
#### Example
# Content-Security-Policy violations and Document-Policy violations
# will be sent to main-endpoint
Content-Security-Policy: script-src 'self'; object-src 'none'; report-to main-endpoint;
Document-Policy: document-write=?0;report-to=main-endpoint;
# Deprecation reports don't need an explicit endpoint because
# these reports are always sent to the default endpoint
> [!WARNING]
> **Warning:** Getting the `report-to` syntax right can be tricky, because not all policies use the same header structure. Depending on the policy, the right syntax may be `report-to=main-endpoint` or `report-to main-endpoint`.
## Debug your reporting setup
### Intentionally generate reports
When setting up the Reporting API, you'll likely need to intentionally violate
your policies in order to check if reports are generated and sent as expected.
### Save time
Reports may be sent with a delay---about a minute, which is a *long* time
when debugging. 😴 Luckily, when debugging in Chrome, you can use the flag
`--short-reporting-delay` to receive reports as soon as they're generated.
Run this command in your terminal to turn on this flag:
YOUR_PATH/TO/EXECUTABLE/Chrome --short-reporting-delay
> [!IMPORTANT]
> **Key point:** This flag is not available using the Chrome UI, it's a command line flag only. Learn [how to run Chromium with
> flags](https://www.chromium.org/developers/how-tos/run-chromium-with-flags).
### Use DevTools
In Chrome, use DevTools to see the reports that have been sent or will be sent.
As of October 2021, this feature is experimental. To use it, follow these steps:
1. Use Chrome version **96** and newer (check by typing `chrome://version` in your browser)
2. Type or paste `chrome://flags/#enable-experimental-web-platform-features` in Chrome's address bar.
3. Click **Enabled**.
4. Restart your browser.
5. Open Chrome DevTools.
6. In Chrome DevTools, open the Settings. Under Experiments, click **Enable
Reporting API panel in the Application panel**.
7. Reload DevTools.
8. Reload your page. Reports generated by the page DevTools is open in will be listed in Chrome DevTools' **Application** panel, under **Reporting API**.
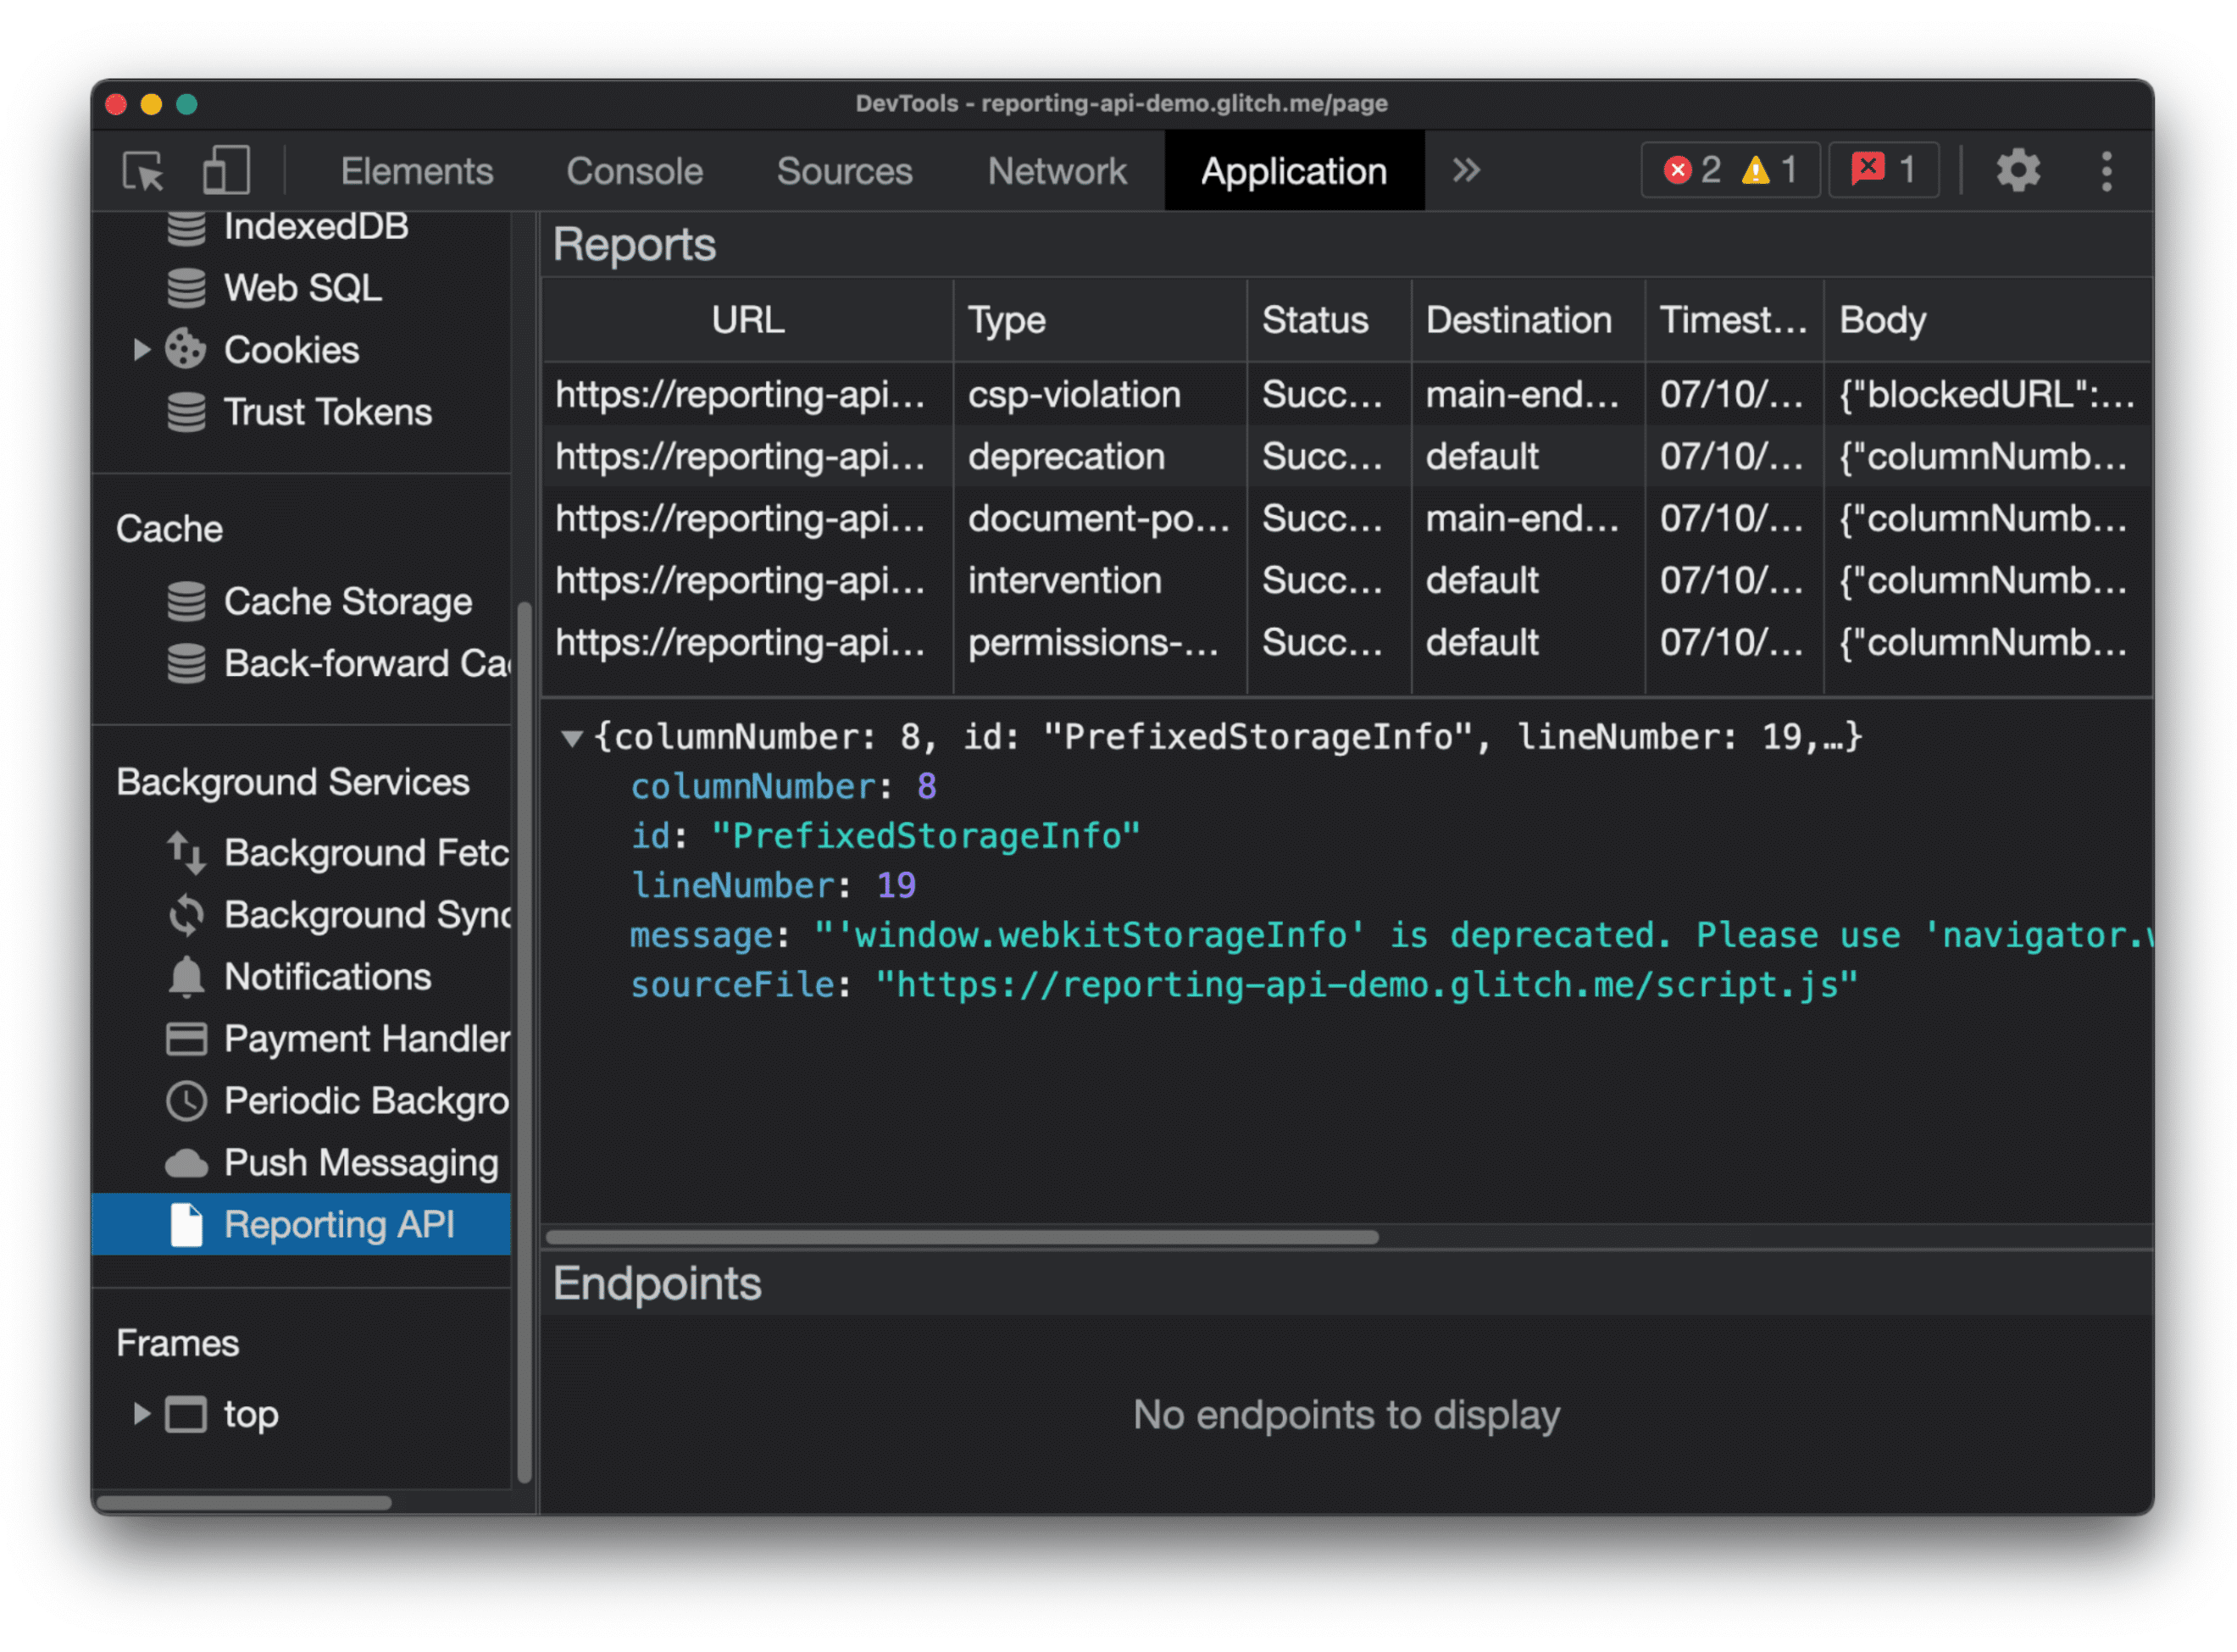 Chrome DevTools displays the reports generated on your page and their status.
#### Report status
The **Status** column tells you if a report has been successfully sent.
| Status | Description |
|---|---|
| `Success` | The browser has sent the report and the endpoint replied with a success code (`200` or another success response code `2xx`). |
| `Pending` | The browser is making an attempt to send the report. |
| `Queued` | The report has been generated and the browser is not trying to send it. A report appears as `Queued` in one of these two cases: - The report is new and the browser is waiting to see if more reports arrive before trying to send it. - The report is not new; the browser has already tried to send this report and has failed, and is waiting before trying again. |
| `MarkedForRemoval` | After retrying for a while (`Queued`), the browser has stopped trying to send the report and will soon remove it from its list of reports to send. |
Reports are removed after a while, whether or not they're successfully sent.
> [!IMPORTANT]
> **Key point:** The `Queued` status isn't always informative, because it doesn't precisely indicate whether sending has failed or has not been attempted yet. Using [short reporting delays](https://developer.chrome.com/docs/capabilities/web-apis/reporting-api#save_time) helps: a report that remains `Queued` in that case likely indicates that sending is failing.
### Troubleshooting
Are reports not generated or not sent as expected to your endpoint? Here are a
few tips to troubleshoot this.
#### Reports are not generated
Reports that show up in DevTools have been correctly generated. If the report
you expect does **not** show up in this list:
- Check `report-to` in your policies. If this is misconfigured, a report won't be generated. Head over to [Edit your policies](https://developer.chrome.com/docs/capabilities/web-apis/reporting-api#edit_your_policies) to fix this. An additional way to troubleshoot this is to check the DevTools console in Chrome: if an error pops up in the console for the violation you expected, this means your policy is probably properly configured.
- Keep in mind that only the reports that were generated for the document DevTools is open in will show up in this list. One example: if your site `site1.example` embeds an iframe `site2.example` that violates a policy and hence generates a report, this report will show up in DevTools only if you open the iframe in its own window and open DevTools for that window.
#### Reports are generated but not sent or not received
What if you can see a report in DevTools, but your endpoint doesn't receive it?
> [!IMPORTANT]
> **Key point:** Because the report is sent out-of-band by the browser itself and not by a certain site, the `POST` requests containing the reports are not displayed in the **Network** panel of your Developer Tools.
- Make sure to use [short delays](https://developer.chrome.com/docs/capabilities/web-apis/reporting-api#save_time). Maybe the reason you can't see a report is because it hasn't been sent yet!
- Check your `Reporting-Endpoints` header configuration. If there's an issue
with it, a report that has been generated correctly won't be sent. In
DevTools, the report's status will remain `Queued` (it might jump to
`Pending`, and then quickly back to `Queued` when a delivery attempt is
made) in this case. Some common mistakes that may cause this:
- The endpoint is used but not configured. Example:
Code with a mistake
```console
Document-Policy: document-write=?0;report-to=endpoint-1;
Reporting-Endpoints: default="https://reports.example/default"
```
Document-Policy violation reports should be sent to `endpoint-1`, but this endpoint name isn't configured in
`Reporting-Endpoints`.
- The `default` endpoint is missing. Some reports types, such as deprecation
and intervention reports, will only be sent to the endpoint named `default`.
Read more in [Configure the Reporting-Endpoints
header](https://developer.chrome.com/docs/capabilities/web-apis/reporting-api#configure_the_reporting-endpoints_header).
- Look for issues in your policy headers syntax, such as missing quotes. [See
details](https://developer.chrome.com/docs/capabilities/web-apis/reporting-api#configure_the_reporting-endpoints_header).
- Check that your endpoint can handle incoming requests.
- Make sure that your endpoint support CORS preflight requests. If it
doesn't, it can't receive reports.
- Test your endpoint's behavior. To do so, instead of generating reports
manually, you can emulate the browser by sending to your endpoint
requests that *look like* what the browser would send. Run the
following:
curl --header "Content-Type: application/reports+json" \
--request POST \
--data '[{"age":420,"body":{"columnNumber":12,"disposition":"enforce","lineNumber":11,"message":"Document policy violation: document-write is not allowed in this document.","policyId":"document-write","sourceFile":"https://dummy.example/script.js"},"type":"document-policy-violation","url":"https://dummy.example/","user_agent":"xxx"},{"age":510,"body":{"blockedURL":"https://dummy.example/img.jpg","destination":"image","disposition":"enforce","type":"corp"},"type":"coep","url":"https://dummy.example/","user_agent":"xxx"}]' \
YOUR_ENDPOINT
Your endpoint should respond with a success code (`200` or another success
response code `2xx`). If it doesn't, there's an issue with its
configuration.
## Related reporting mechanisms
### Report-Only
`-Report-Only` policy headers and the `Reporting-Endpoints` work together.
Endpoints configured in `Reporting-Endpoints` and specified in the `report-to`
field of
[`Content-Security-Policy`](https://developer.mozilla.org/docs/Web/HTTP/Headers/Content-Security-Policy),
[`Cross-Origin-Embedder-Policy`](https://developer.mozilla.org/docs/Web/HTTP/Headers/Cross-Origin-Embedder-Policy)
and
[`Cross-Origin-Opener-Policy`](https://developer.mozilla.org/docs/Web/HTTP/Headers/Cross-Origin-Opener-Policy),
will receive reports when these policies are violated.
Endpoints configured in `Reporting-Endpoints` can also be specified in the
`report-to` field of
[`Content-Security-Policy-Report-Only`](https://developer.mozilla.org/docs/Web/HTTP/Headers/Content-Security-Policy-Report-Only),
[`Cross-Origin-Embedder-Policy-Report-Only`](https://developer.chrome.com/coop-coep#:%7E:text=If%20you%20prefer%20to%20receive%20reports%20without%20blocking%20any%20embedded%20content%20or%20without%20isolating%20a%20popup%20window%2C%20append%20-Report-Only%20to%20respective%20headers)
and
[`Cross-Origin-Opener-Policy-Report-Only`](https://developer.chrome.com/coop-coep#:%7E:text=If%20you%20prefer%20to%20receive%20reports%20without%20blocking%20any%20embedded%20content%20or%20without%20isolating%20a%20popup%20window%2C%20append%20-Report-Only%20to%20respective%20headers).
They'll also receive reports when these policies are violated.
While reports are sent in both cases, `-Report-Only` headers don't enforce the
policies: nothing will break or actually get blocked, but you will receive
reports of what *would* have broken or been blocked.
> [!NOTE]
> **Note:** If you're using a `-Report-Only` header and have configured your reporting endpoints using the legacy header `Report-To`, migrate to `Reporting-Endpoints` if you can. Read more in the [migration guide](https://developer.chrome.com/blog/reporting-api-migration).
### `ReportingObserver`
The [`ReportingObserver`](https://developer.chrome.com/docs/capabilities/web-apis/reporting-observer)
JavaScript API can help you observe client-side warnings.
`ReportingObserver` and the `Reporting-Endpoints` header generate reports that
look the same, but they enable slightly different uses cases.
Use `ReportingObserver` if:
- You only want to monitor deprecations or browser interventions. `ReportingObserver` surfaces **client-side warnings** such as deprecations and browser interventions, but unlike `Reporting-Endpoints`, it doesn't capture any other types of reports such as CSP or COOP/COEP violations.
- You need to react to these violations in real-time. `ReportingObserver` makes it possible to [attach a
callback](https://developer.chrome.com/docs/capabilities/web-apis/reporting-observer#the_api) to a violation event.
- You want to attach additional information to a report to aid in debugging, using the custom [callback](https://developer.chrome.com/docs/capabilities/web-apis/reporting-observer#the_api).
Another difference is that `ReportingObserver` is configured only client-side:
you can use it even if you have no control over server-side headers and can't
set `Reporting-Endpoints`.
## Further reading
- [Migration guide from Reporting API v0 to v1](https://developer.chrome.com/blog/reporting-api-migration)
- [ReportingObserver](https://developer.chrome.com/docs/capabilities/web-apis/reporting-observer)
- [Specification: legacy Reporting API (v0)](https://www.w3.org/TR/reporting/)
- [Specification: new Reporting API (v1)](https://w3c.github.io/reporting/)
*Many thanks to Ian Clelland, Eiji Kitamura and Milica Mihajlija for their
reviews and suggestions on this document.*