 Junhey Software Engineer, WeTV (Tencent) [GitHub](https://github.com/junhey) [LinkedIn](https://www.linkedin.com/in/junhey)  Stephani Kurniawan [LinkedIn](https://www.linkedin.com/in/stephani-kurniawan-49786285)  Cecilia Cong [LinkedIn](https://www.linkedin.com/in/cecilia-cong-697368237)
Published: Nov 10, 2026
[WeTV](https://wetv.vip) is Tencent's international video streaming platform. It
serves drama series, anime, and variety shows to viewers in Southeast Asia and
other global markets. For a site built around video, performance decides whether
viewers stay, whether search engines show the content, and whether playback
feels smooth.
The WeTV web engineering team doesn't ship code that misses its performance
targets. For a long time, holding that line meant a developer had to stop what
they were doing, open Chrome, and profile the page by hand every time a build
failed the check. Tracking down and fixing one regression took about four hours.
Today, an AI coding agent does that work as part of the CI/CD pipeline. With
[Chrome DevTools for agents](https://developer.chrome.com/docs/devtools/agents), the agent inspects the page
in a live browser. With [Modern Web Guidance](https://developer.chrome.com/docs/modern-web-guidance.md.txt), it
writes fixes that follow current web platform standards. The workflow now
diagnoses and resolves 90% of failed performance tests automatically, and the
time from a failed check to a verified fix dropped from four hours to 30
minutes---including full build and manual evaluation.
## The challenge: A developer stuck between the editor and the browser
WeTV engineers already used AI coding tools in their IDE. Those tools could
write code, but they couldn't see what the code did once it ran in a browser. So
the work split in two. Engineers write code in the editor, then switch to Chrome
to deploy, inspect, and verify it. Every fix meant going around that loop again
by hand.
The split hurt most at the release gate. WeTV's CI/CD pipeline runs performance
traces on every release and holds Cumulative Layout Shift (CLS) to 0.1 or lower.
When a build crossed that line, the pipeline flagged it, but finding the cause
was still manual. An engineer had to open Chrome DevTools, record a trace, find
the element that moved, carry that finding back to the editor, write a fix, and
run the check again. A single CLS regression cost about four hours of
engineering time.
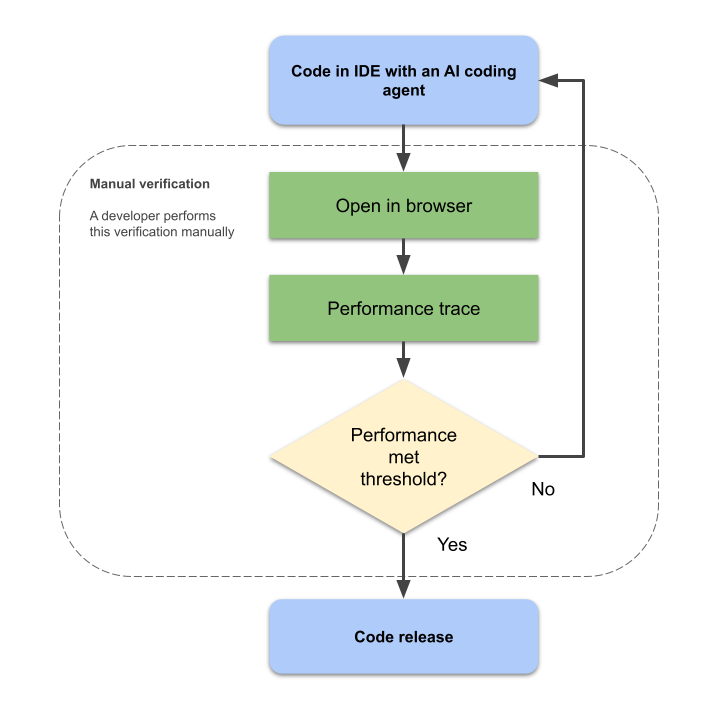 The original workflow: a developer manually verified performance before every release.
The team needed an agent that could handle both halves of the job: Look at the
running page, and then fix the code to a known standard.
## The solution: Connect the agent to the browser and to web standards
WeTV moved performance verification into its merge request (MR) flow. When a
developer opens an MR, the CI/CD pipeline starts an environment where the AI
coding agent runs locally with two capabilities that the team's IDE tools
lacked:
- **[Chrome DevTools for agents](https://developer.chrome.com/docs/devtools/agents):** Runs a Model Context Protocol (MCP) server and connects the agent to a live Chrome instance. The agent can record performance traces (among other Chrome DevTools features) and check how the frontend code actually renders, the same way a developer would in DevTools.
- **[Modern Web Guidance](https://developer.chrome.com/docs/modern-web-guidance.md.txt):** An agent skill that contains web platform best practices and browser compatibility data. It steers the agent away from legacy patterns and toward fixes built on modern web platform features.
DevTools for agents tells the agent what broke. Modern Web Guidance shapes how
it fixes it.
## Real-world example: A layout shift on the episode playback page
During one merge request, the agent ran the `performance_start_trace` tool on
the desktop episode playback page. The trace recorded a CLS of 0.39, nearly four
times the 0.1 limit.
### Tell the agent to diagnose before it edits
WeTV doesn't let the agent improvise. The prompt that drives the workflow tells
it to diagnose the problem before it touches any code, and to check its findings
against Modern Web Guidance instead of relying on whatever the model would
generate by default.
Here is an example of a prompt that the WeTV team used:
Context:
"The CLS (Cumulative Layout Shift) of this page needs inspection. Diagnose
first, then modify the code, do not guess."
Mandatory Execution Steps:
1. Performance Trace: Use Chrome DevTools for agents to run performance traces
on both Desktop and Mobile views.
2. Identify Culprits: Use CLSCulprits insight to pinpoint the exact DOM elements
causing shifts (capture class/id, timing, and score).
3. Use web best practices for performance and CSS to optimize CLS.
4. Multi-Agent Parallelism: Enable parallel agents for efficiency:
- Agent A: Investigate Player/Main Layout SSR placeholders.
- Agent B: Investigate Sidebar Ads, VIP buttons, Tabs, and late-injected
lists.
- Agent C: Investigate Fonts and other minor factors.
Constraint: Each agent modifies only files within its scope to prevent
conflicts.
5. Root Cause Confirmation: Confirm the root cause before applying fixes.
Prioritize reserving space over changing interaction semantics just to fix
CLS.
6. Verification: After modification, re-test CLS via equivalent CSS injection
or local build. Target: CLS < 0.1.
Two parts of this prompt carry most of the weight. "Diagnose first, then modify
the code" keeps the agent from patching symptoms. Step 2 points the agent to use
`performance_analyze_insight` with `insightName: 'CLSCulprits'`, so it reports
the exact element, timing, and score instead of a general suspicion.
In the following video, when the prompt is executed, the agent searches for the
relevant guide in Modern Web Guidance to implement fixes with modern web
features related to CLS, and uses Chrome DevTools for agents to open a Chrome
browser instance and record a performance trace.
Video of the agentic performance debugging workflow.
This combination of runtime diagnostics and structured guidance enables
automated fixes for complex layout shifts. Here is an example of an issue fixed
by the automated workflow.
### Find the root cause
The trace pointed to the video player. WeTV renders the player on the server,
but the player's container didn't reserve any height for it. When the client
hydrated the page, the container's height expanded and the content around it
shifted.
### Apply a standards-based fix
The fix is to reserve the space during server-side rendering, so the container
already has the right height before hydration. The following is an example of a
fix that the agent wrote with reference to the Modern Web Guidance
[css-layout guide](https://github.com/GoogleChrome/modern-web-guidance/blob/main/skills/modern-web-guidance/guides/css/css-layout.md):
```css
.play__block--player .play__aside--left {
inline-size: 100%;
block-size: auto;
aspect-ratio: 16/9;
}
```
After the agent applied the CSS, the pipeline rebuilt the page and the agent ran
the same trace again. Only when CLS came in under 0.1 did the patch move on to
human review.
## Impact: Faster releases and stable layouts
WeTV achieved measurable improvements in engineering efficiency and layout
stability when they added Chrome DevTools for agents and Modern Web Guidance to
its CI/CD workflow:
- 87% reduction in end-to-end debugging and resolution time (from 4 hours to 30 minutes).
- 90% of all recurring performance regressions are diagnosed and resolved automatically.
Engineers no longer lose half a working day to profiling. When a build breaks
the threshold, the agent reads the trace, writes a fix, tests it, and hands a
verified patch to a human reviewer. People still make the final call, but they
start from a fix that has already passed the check that failed.
Because CLS regressions get fixed inside the merge request, they don't reach
production. That keeps pages under the 0.1 target, protects WeTV's search
visibility, and removes a common reason to block a release late in the cycle.
## Lessons for your team
WeTV's setup is specific to its stack, but the pattern behind it carries over to
most teams that gate releases on performance:
- **Run the agent where the failure happens.** WeTV triggers the agent from the merge request, so nobody has to notice a failed check and start a session by hand.
- **Make the agent diagnose before it edits.** Asking for a trace and a named culprit first produces fixes that target the actual element instead of a guess.
- **Pair runtime data with a standard.** A trace tells the agent which element moved. Modern Web Guidance tells it which fix follows current platform practice.
- **Require proof.** Re-running the same trace that failed is the agent's evidence that the fix works. P2ER follows the same principle in its [mandatory empirical verification rule](https://developer.chrome.com/blog/p2er-ui-verification-with-devtools-for-agents.md.txt).
- **Keep a human in the loop.** The agent does the investigation, and an engineer reviews a patch that has already passed the check.
## Feedback and future plans
WeTV found that pairing live runtime telemetry from Chrome DevTools for agents
with the standardized rules in Modern Web Guidance took manual performance
analysis out of the release process, while keeping the agent's code changes in
line with current web platform standards.
> "The results have been very effective in terms of both speed and quality. The
> diagnostic insights provided by Chrome DevTools for agents and Modern Web
> Guidance gave us reliable references for fixing complex layout issues. We
> perform strict verification after every fix, and the current success rate and
> stability have significantly improved our release confidence."
>
> ---**Yangjie Zheng**, Head of Engineering, WeTV (Tencent)
Next, the WeTV engineering team plans to bring Chrome DevTools for agents and
Modern Web Guidance across end-to-end testing for upcoming code releases.
## Resources
To set up a similar workflow, explore these resources:
- [Get started with Chrome DevTools for agents](https://developer.chrome.com/docs/devtools/agents/get-started.md.txt)
- [Get started with Modern Web Guidance](https://developer.chrome.com/docs/modern-web-guidance/get-started.md.txt)
- [Optimize Cumulative Layout Shift](https://web.dev/articles/optimize-cls)
- [How P2ER built a high-trust environment for agentic coding with Chrome DevTools for agents](https://developer.chrome.com/blog/p2er-ui-verification-with-devtools-for-agents.md.txt)