> Documentation index: https://developer.chrome.com/blog/llms.txt

![Matthias Rohmer](https://web.dev/images/authors/mrohmer.jpg) Matthias Rohmer [X](https://twitter.com/matthiasrohmer) [GitHub](https://github.com/matthiasrohmer) [LinkedIn](https://www.linkedin.com/in/matthias-rohmer-b09191b0) [Bluesky](https://bsky.app/profile/matthiasrohmer.bsky.social)

<br />


Published: November 13, 2026

<br />

Welcome to the December 2026 edition of New in DevTools! Everything that rolled out to Chrome Stable during November in **Chrome 157** and **Chrome 158** is now available in your browser. Highlights from this cycle include logpoints, virtual WebAuthn authenticators, live configuration reloading, and offline heap snapshot analysis in the Chrome DevTools MCP server, multi-category and `agentic-browsing` **Lighthouse** audits in **AI assistance** , `:buffering` and `:stalled` state forcing and a `position-try-fallbacks` swatch in the **Elements** panel, original variable and function names in the **Scope** view, stack traces, and expression evaluation powered by ECMA-426 source map `scopes` in **Sources** , and **Sub apps** inspection in the **Application** panel.

## DevTools for agents

Releases **v1.11.0** through **v1.13.0** of the Chrome DevTools MCP server introduce logpoint debugging, virtual WebAuthn authenticators, live configuration reloading, offline heap snapshot analysis, and parallel tool execution:

- **Logpoints (`set_logpoints`) and virtual WebAuthn authenticators (`configure_webauthn`)** : Inject logpoints (`set_logpoints`) at served script URLs or source-mapped file paths to log expressions using original variable names directly to `list_console_messages` without pausing execution, and configure virtual `ctap2` or `u2f` authenticators (`configure_webauthn`) to test passkey and security key flows.
- **Live configuration reloading and automatic discovery** : Pass `--watchConfig` to watch and hot-reload configuration file changes---including `blockedUrlPattern` and `allowedUrlPattern` rules---without restarting the server, or let the server automatically discover configuration files in standard workspace locations.
- **Offline and paginated heap snapshot analysis** : Analyze `.heapsnapshot` files without an active browser connection, inspect memory retained by V8 execution contexts with `analyze_heapsnapshot_contexts`, and paginate heap snapshot queries and `compare_heapsnapshots` diffs by default with class objects sorted by self size.
- **Parallel tool execution and browser-powered screencasts**: Run independent tool calls and page-scoped tools across different pages in parallel, and record browser-powered screencasts at device pixel resolution by default without requiring external dependencies.
- **Inline Lighthouse failures, uncached traces, and local script evaluation** : Receive failing audits and affected DOM nodes inline from `lighthouse_audit`, pass `ignoreCache` to `performance_start_trace`, evaluate scripts directly from local files, match only visible text in `wait_for`, and debug WebMCP tools exposed in third-party developer tools.

Learn more in the [chrome-devtools-mcp repository](https://github.com/ChromeDevTools/chrome-devtools-mcp).

> [!TIP]
> **Tip:** [Modern Web Guidance](https://goo.gle/mwg) helps your coding agent to use the platform's newest features through guides. Notable additions in November include a new guide for [content-first-noise-reduction](https://github.com/GoogleChrome/modern-web-guidance/blob/v0.0.197/skills/modern-web-guidance/guides/user-experience/content-first-noise-reduction.md), along with updates to [accessible-generated-content](https://github.com/GoogleChrome/modern-web-guidance/blob/v0.0.197/skills/modern-web-guidance/guides/accessibility/accessible-generated-content.md), [faster-spa-view-transitions](https://github.com/GoogleChrome/modern-web-guidance/blob/v0.0.197/skills/modern-web-guidance/guides/performance/faster-spa-view-transitions.md), and [cpp-on-the-web](https://github.com/GoogleChrome/modern-web-guidance/blob/v0.0.197/skills/modern-web-guidance/guides/wasm/cpp-on-the-web.md).
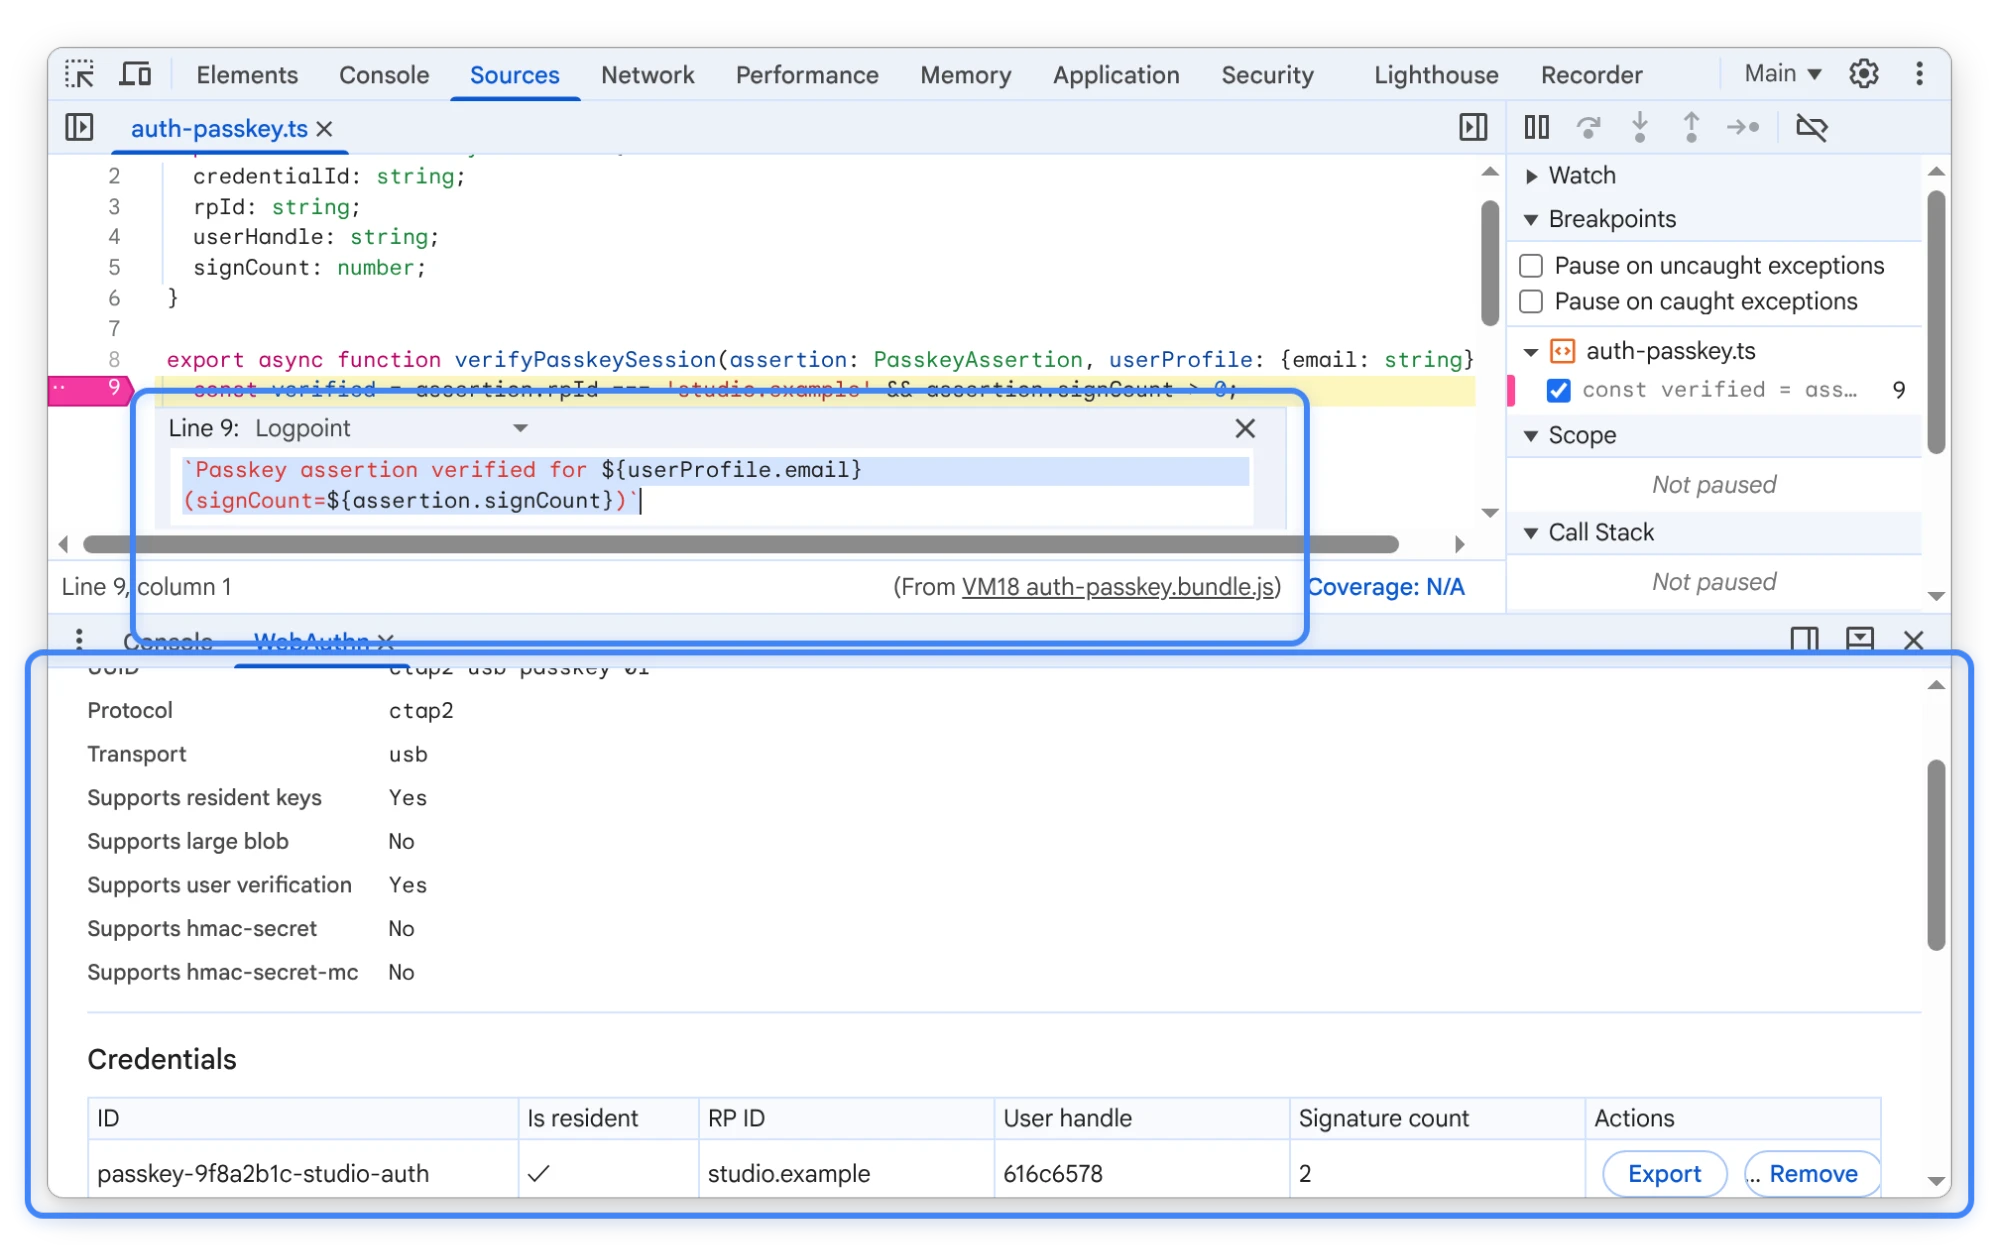
![Setting a source-mapped logpoint in the Sources panel and inspecting a CTAP2 virtual passkey authenticator in the WebAuthn pane.](https://developer.chrome.com/static/blog/new-in-devtools-december-2026/images/mcp.webp) Setting a source-mapped logpoint in the Sources panel and inspecting a CTAP2 virtual passkey authenticator in the WebAuthn pane.

Chromium issues: [497855658](https://crbug.com/497855658)

## AI innovations

You can now ask **AI assistance** to run full multi-category (`all`) **Lighthouse** reports across performance, accessibility, best practices, and SEO, as well as `agentic-browsing` audits on request. **AI assistance** also receives a structured summary of failing audit titles and scores directly in the report context so it can interpret and explain **Lighthouse** findings more accurately, and single-category reports now render score gauges inline.
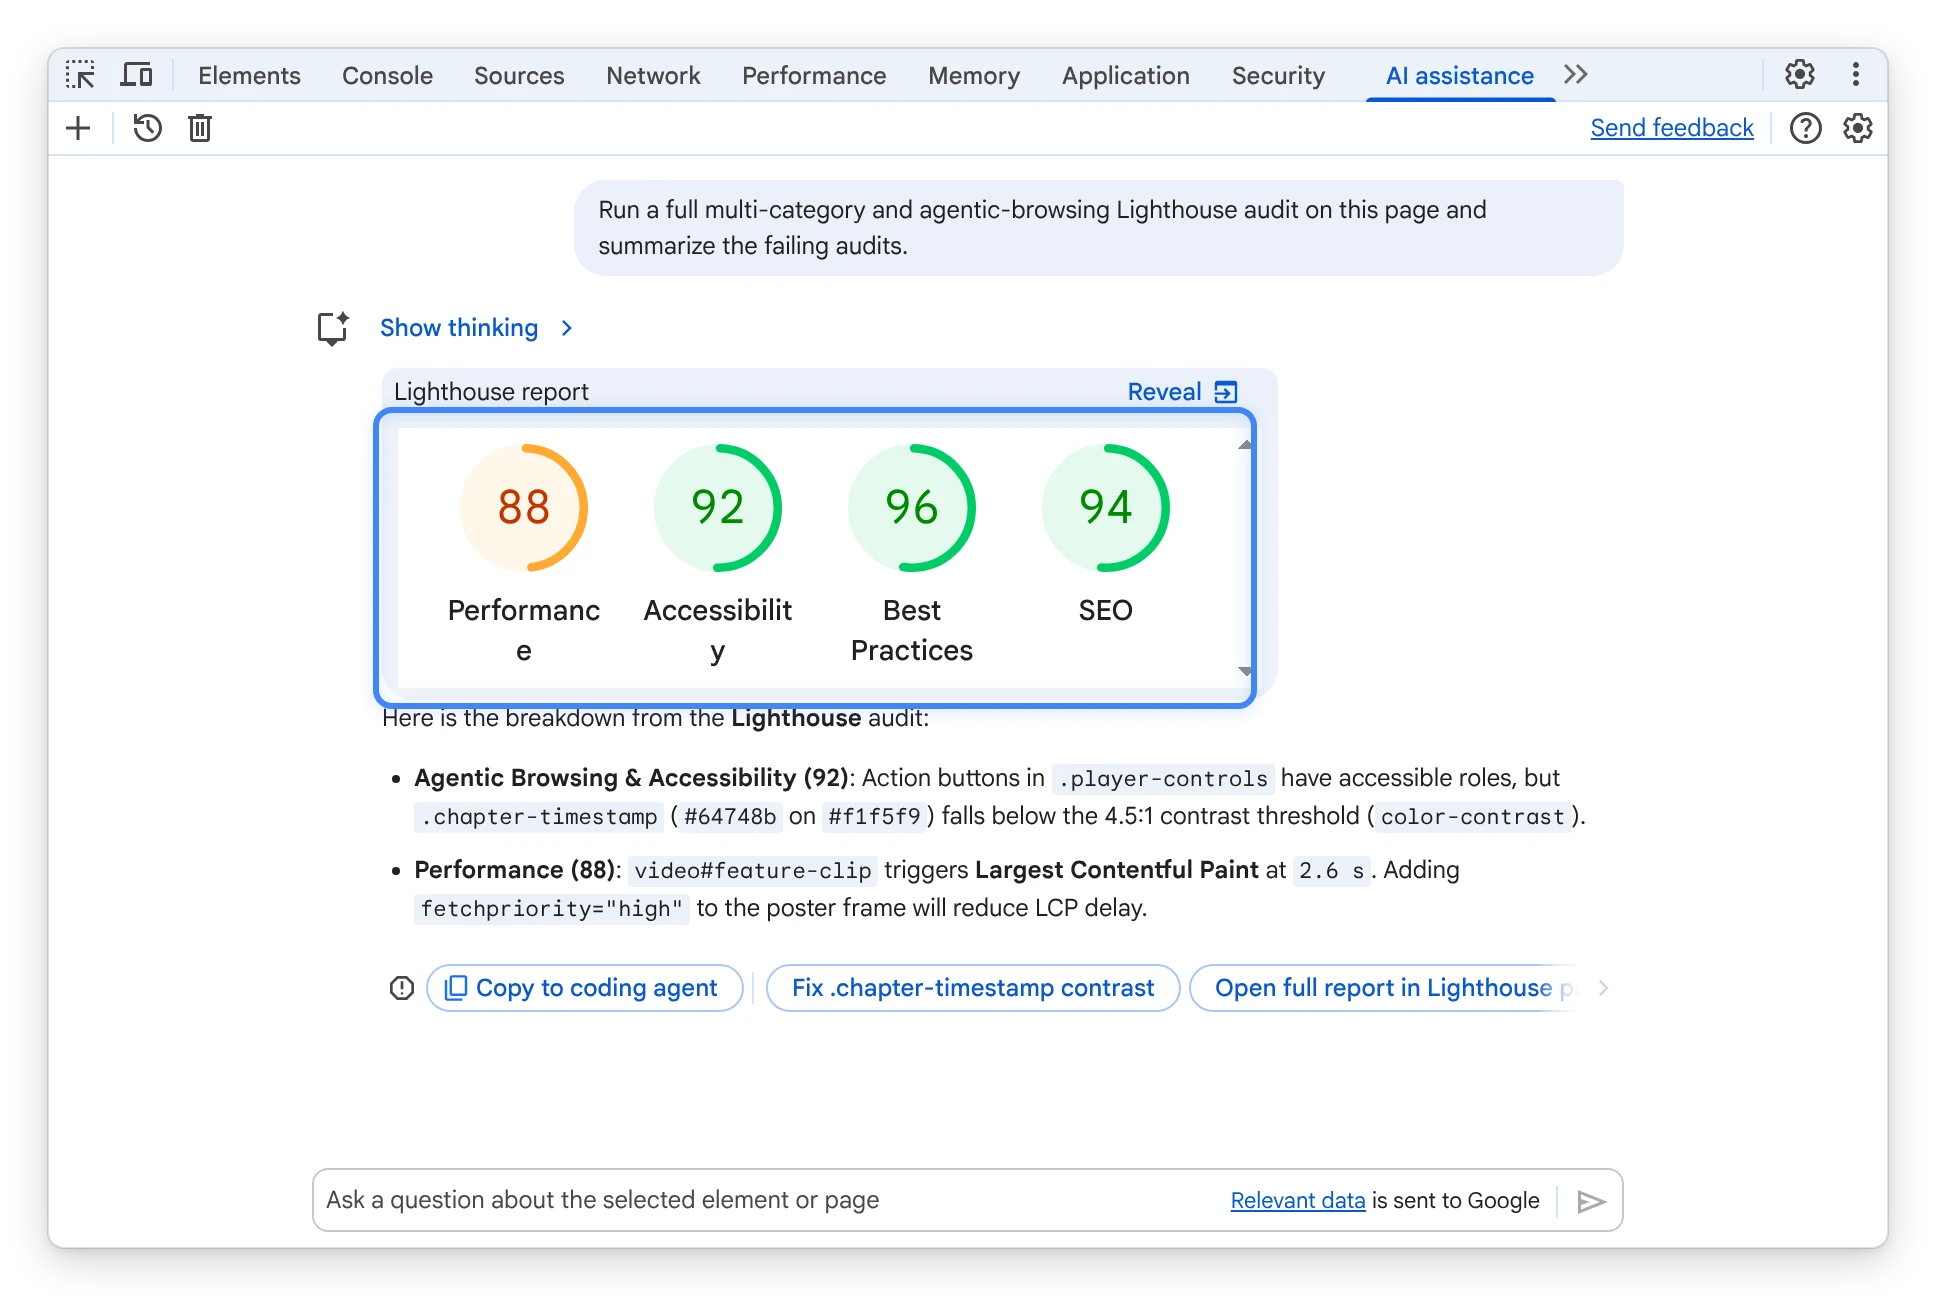
![Running a multi-category Lighthouse audit in AI assistance with inline score gauges and an audit breakdown.](https://developer.chrome.com/static/blog/new-in-devtools-december-2026/images/ai.webp) Running a multi-category Lighthouse audit in AI assistance with inline score gauges and an audit breakdown.

Chromium issues: [530875864](https://crbug.com/530875864)

## Elements: Force :buffering and :stalled, position-try-fallbacks swatch, and CSS cascade fixes

The **Elements** panel adds new forceable media pseudo-classes, interactive CSS anchor positioning controls, and cascade accuracy improvements:

- **Force `:buffering` and `:stalled` media states** : You can now force `:buffering` and `:stalled` pseudo-classes on `<video>` and `<audio>` elements from the **:hov** (**Toggle Element State**) pane to test loading and playback fallback styles without throttling network conditions.
- **`position-try-fallbacks` swatch, `position-area` alignment, and IMCB overlay** : Declarations for `position-try-fallbacks` now include an interactive swatch that opens a context menu to force individual fallback options on the anchored element. In addition, the `position-area` visual editor now configures `justify-self` and `align-self` alignment values, and hovering over positioning properties or DOM nodes highlights the inset-modified containing block (IMCB) in the viewport overlay.
- **Universal custom highlight selector (`::highlight(*)`)** : The **Styles** tab now recognizes and displays rules matching the universal custom highlight pseudo-element selector `::highlight(*)`.
- **Accurate `@layer` and origin priority for `!important` declarations** : The **Styles** tab now respects CSS cascade layer (`@layer`) and origin order when determining which `!important` declaration takes precedence.

![Forcing :buffering and :stalled media states, previewing position-try-fallbacks options, and inspecting the anchor positioning IMCB overlay in Elements.](https://developer.chrome.com/static/blog/new-in-devtools-december-2026/images/elements.webp) Forcing :buffering and :stalled media states, previewing position-try-fallbacks options, and inspecting the anchor positioning IMCB overlay in Elements.

Chromium issues: [40246121](https://crbug.com/40246121), [407678278](https://crbug.com/407678278), [553335561](https://crbug.com/553335561), [413061413](https://crbug.com/413061413), [573299994](https://crbug.com/573299994), [40225557](https://crbug.com/40225557)

## Sources: Original scopes view, stack traces, and expression evaluation with ECMA-426 source map scopes

DevTools now supports the [ECMA-426 source map](https://github.com/tc39/ecma426/blob/main/proposals/scopes.md) [`scopes`](https://github.com/tc39/ecma426/blob/main/proposals/scopes.md) [proposal](https://github.com/tc39/ecma426/blob/main/proposals/scopes.md), bringing original variable and function names from your authored files into the **Scope** view, stack traces, and expression evaluation:

- **Original scope tree in the Scope view** : When paused in the debugger, the **Scope** pane reconstructs the original lexical scope tree of your authored source file and displays original variable names and values---without dimming---instead of minified bundle identifiers.
- **Translated stack traces and logical stepping across DevTools** : Stack traces throughout DevTools resolve original function names, merge outlined helper frames back into their logical callers, and filter out compiler-generated helper frames. In addition, **Step** , **Step over** , and **Step out** use source map scopes to step logically over and out of inlined and outlined functions.
- **Expression evaluation and autocomplete with original variable names** : You can evaluate expressions in the **Console** , **Watch Expressions**, and conditional breakpoints or logpoints using original authored variable names, supported by source map scope completions in the code and breakpoint editors.

![Inspecting original TypeScript lexical scopes in the Scope pane and evaluating expressions with original variable names in the Console drawer.](https://developer.chrome.com/static/blog/new-in-devtools-december-2026/images/sources.webp) Inspecting original TypeScript lexical scopes in the Scope pane and evaluating expressions with original variable names in the Console drawer.

Chromium issues: [40277685](https://crbug.com/40277685)

## Application: Sub apps inspection, custom spellcheck dictionaries, and storage updates

The **Application** and **Issues** panels add dedicated views for multi-app web installations, custom spellcheck dictionaries, and site storage:

- **Sub apps inspection and Isolated Web App identity** : A new **Sub apps** node under the **Application** section displays **Sub apps** and **Sibling sub apps** in structured data grids, while **Manifest \> Identity** surfaces the **Bundle ID** (for Isolated Web Apps) and **Parent app name**.
- **Spellcheck custom dictionary inspection** : Selecting a frame in the **Frames** tree now displays a **Spell check custom dictionary** section whenever custom spellcheck entries are registered for that document.
- **File System site data clearing, reliable storage keys, and geolocation issues** : Clicking **Clear site data** in the **Storage** view now clears **File System** storage alongside other storage buckets, **Local Storage** and **Session Storage** re-fetch storage keys reliably once a frame finishes loading, the **Issues** panel flags `geolocation` permission requests made without a user gesture, and the **Ads** panel clarifies primary display ad versus ad-related DOM highlighting.

![Inspecting registered sub-applications and their manifest IDs in the Application > Sub apps pane.](https://developer.chrome.com/static/blog/new-in-devtools-december-2026/images/application.webp) Inspecting registered sub-applications and their manifest IDs in the Application \> Sub apps pane.

Chromium issues: [428005649](https://crbug.com/428005649), [40227285](https://crbug.com/40227285), [570961818](https://crbug.com/570961818), [569300366](https://crbug.com/569300366), [514957134](https://crbug.com/514957134)

## Performance and Memory: Faster trace parsing, Lantern HTTP/3 simulation, and generator context analysis

The **Performance** and **Memory** panels reduce trace parsing overhead, improve Lantern network simulation accuracy, and refine heap snapshot retention analysis:

- **Faster trace parsing and reduced memory usage** : A series of trace engine optimizations improves trace parsing speed by roughly 26% on large traces while reducing peak memory usage, alongside flame chart canvas redraw optimizations and deduplicated script sizes in **Treemap**.
- **Lantern HTTP/2, HTTP/3, and ES module simulation** : The Lantern simulation engine now resets HTTP/2 overflow bytes across sequential requests, treats HTTP/3 connections as multiplexed in `ConnectionPool`, and accounts for ES module compilation and evaluation trace events.
- **Heap snapshot context analysis for generators, async functions, and ES modules** : Dead context field analysis in the **Memory** panel now recognizes suspended generators and async functions as live closures, ignores top-level functions of finished ES modules, attributes `ScopeInfos` to their parent scripts for uncompiled functions, and scopes live heap timeline statistics strictly to the active recording view.

![Filtering a heap snapshot by Objects retained by contexts and inspecting V8 generator and scope context retainers in the Memory panel.](https://developer.chrome.com/static/blog/new-in-devtools-december-2026/images/performance-and-memory.webp) Filtering a heap snapshot by Objects retained by contexts and inspecting V8 generator and scope context retainers in the Memory panel.

Chromium issues: [553831653](https://crbug.com/553831653), [570004155](https://crbug.com/570004155), [568836981](https://crbug.com/568836981), [497855658](https://crbug.com/497855658)

## Other highlights

These additional improvements landed across DevTools in Chrome 157 and Chrome 158:

- **Network** : The **Messages** tab for WebSocket connections now calculates accurate UTF-8 byte lengths for non-ASCII text frames, network search checks cached response bodies locally before querying the backend, **Copy value** on request payload parameters matches the displayed value, and **Show more** appears only when payload text is truncated.
- **Console** : Selecting and copying text from a console message now copies only the visible text---excluding collapsed stack traces---while preserving expandable object previews, and long error-like strings no longer render as `[object Object]`.
- **Device Mode and Screenshots** : Capturing a device screenshot now copies the image directly to your clipboard with a confirmation notification in addition to downloading the file, **Fit to window** zoom selects the maximum fitting percentage, and explicit device scale adjustments persist across page reloads.

Chromium issues: [573812521](https://crbug.com/573812521), [555055603](https://crbug.com/555055603), [567556613](https://crbug.com/567556613), [566160225](https://crbug.com/566160225), [553616262](https://crbug.com/553616262), [566267314](https://crbug.com/566267314), [40065190](https://crbug.com/40065190), [515328619](https://crbug.com/515328619)

## Accessibility improvements

Chrome 157 and Chrome 158 include the following accessibility improvements across DevTools:

- **Accessibility live announcements** : Clicking an `ariaNotify` announcement in the **Accessibility** live announcements table now navigates directly to its JavaScript call site in the **Sources** panel. You can also right-click an announcement row to reveal its associated node in the **Elements** panel or **Accessibility** tree, and resize the live announcements pane with a draggable splitter.
- **Keyboard focus indicators** : Improved keyboard focus outline contrast across **Quick Open** results, data grid headers, and toolbar drop-down menus.
- **Screen reader semantics in Settings, Application, and Recorder** : Added `combobox` autocomplete semantics to text prompts for VoiceOver, provided an accessible name for the **Settings** dialog, exposed expandable button semantics on **Service Workers** update timing rows, and improved step selection focus and code view landmarks in the **Recorder** panel.

Chromium issues: [527462118](https://crbug.com/527462118), [568010579](https://crbug.com/568010579), [570465256](https://crbug.com/570465256), [565632631](https://crbug.com/565632631), [557063498](https://crbug.com/557063498), [556764892](https://crbug.com/556764892)