 Matthias Rohmer [X](https://twitter.com/matthiasrohmer) [GitHub](https://github.com/matthiasrohmer) [LinkedIn](https://www.linkedin.com/in/matthias-rohmer-b09191b0) [Bluesky](https://bsky.app/profile/matthiasrohmer.bsky.social)
Published: July 28, 2026
[Video](https://www.youtube.com/watch?v=vukchAoaTdE)
Chrome 151 introduces more widgets for the Agent walkthrough in AI assistance,
detailed CSS specificity breakdowns in the Styles tab, support for the
`::interest-button` pseudo-element, and major updates to the DevTools MCP
server.
## DevTools for agents
Across recent releases up to **v1.6.0**, Chrome DevTools for agents has
significantly expanded its debugging capabilities for coding agents like
Antigravity, Claude, Codex and more.
Updates across versions **v1.4.0** through **v1.6.0** include:
- **Improved memory debugging:** The new `get_heapsnapshot_duplicate_strings` tool detects memory waste caused by redundant string allocations in JavaScript heaps. `get_heapsnapshot_details` returns total object counts and memory size aggregates, filterable heap snapshot aggregates, GC root retaining paths, and enables memory diffing across snapshots.
- **GCF format encoding (`experimentalGcfFormat`):** Added support for [GCF-encoded](https://www.gcformat.com/) tool responses to optimize bandwidth and parsing efficiency for supporting clients.
- **Concurrent multi-agent page routing \& isolated contexts:** `--experimentalPageIdRouting` enables parallel subagents to operate on different browser tabs concurrently using explicit `pageId` routing. `--isolated` mode and `isolatedContext` parameters create temporary Chrome profiles and storage per session.
To learn more and get started, visit the [DevTools for agents repository on GitHub](https://github.com/ChromeDevTools/chrome-devtools-mcp).
## AI assistance
*Image/Screencast: The AI assistance panel showing the new Network Track inline
widget and interactive walkthrough with GFM table support.*
The **AI assistance** panel continues to evolve, providing more detail in [Agent walkthroughs](https://developer.chrome.com/docs/devtools/ai-assistance/chat#agent_walkthrough)
with specialized **Network Track** widget (rendering inline performance network
activity with one-click navigation to zoom into the time range in the
Performance panel) and a **Network Requests List** widget (displaying structured
request parameters in interactive tables).
Additionally response messages now fully support rendering GitHub Flavored
Markdown (GFM) tables for formatted tabular data summaries.
## CSS specificity breakdown and `::interest-button` support
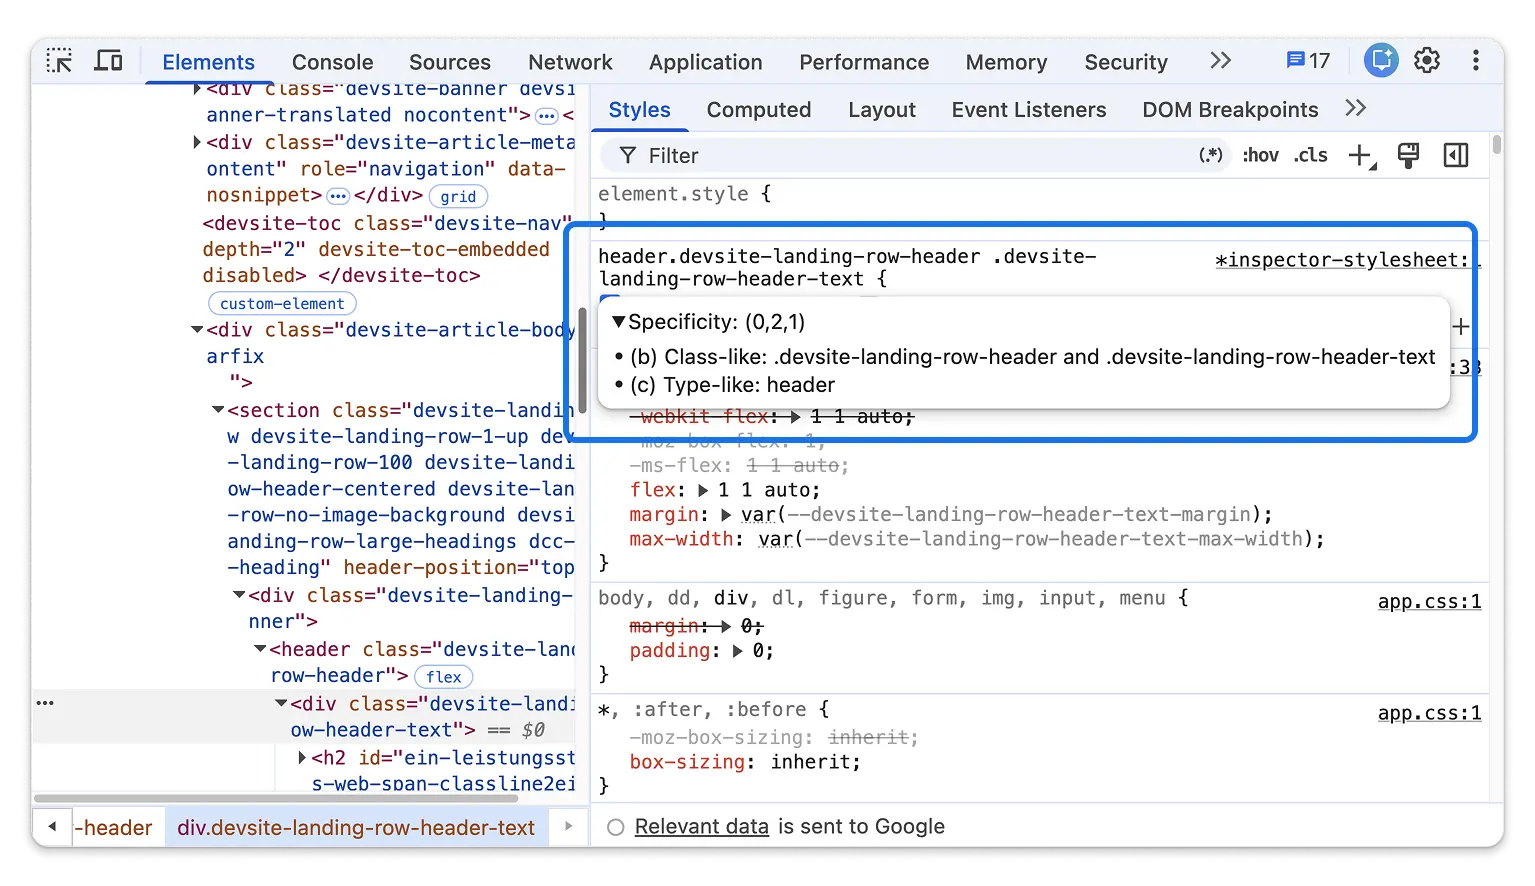
The **Elements** panel brings deeper CSS inspection and authoring tools for
modern web platform APIs:
- **Detailed CSS specificity breakdowns:** Hovering over selector names in the **Styles** tab now displays a detailed tooltip breaking down how each class, ID, element, or pseudo-class contributes to the `(a, b, c)` specificity calculation. *This was a community contribution, thanks to
[@hjanuschka](https://github.com/hjanuschka)!*
- **`::interest-button` pseudo-element:** DevTools now fully parses and presents the new `::interest-button` CSS pseudo-element (part of the HTML `interesttarget` specification) in the Elements tree outline and Styles tab.
- **Asynchronous target linking for HTML relation attributes:** HTML attributes like `popovertarget`, `interesttarget`, and `commandfor` now asynchronously fetch and visually link their target DOM nodes inline.
- **Lazy rendering for large stylesheets:** The Styles tab now uses lazy property decoration when an element exceeds 200 CSS properties, reducing render block times from several seconds down to milliseconds.
Chromium issues: [353436867](https://crbug.com/353436867),
[453705247](https://crbug.com/453705247),
[524406293](https://crbug.com/524406293),
[457696384](https://crbug.com/457696384),
[524131115](https://crbug.com/524131115)
## Memory debugging: Native context attribution and closure retention
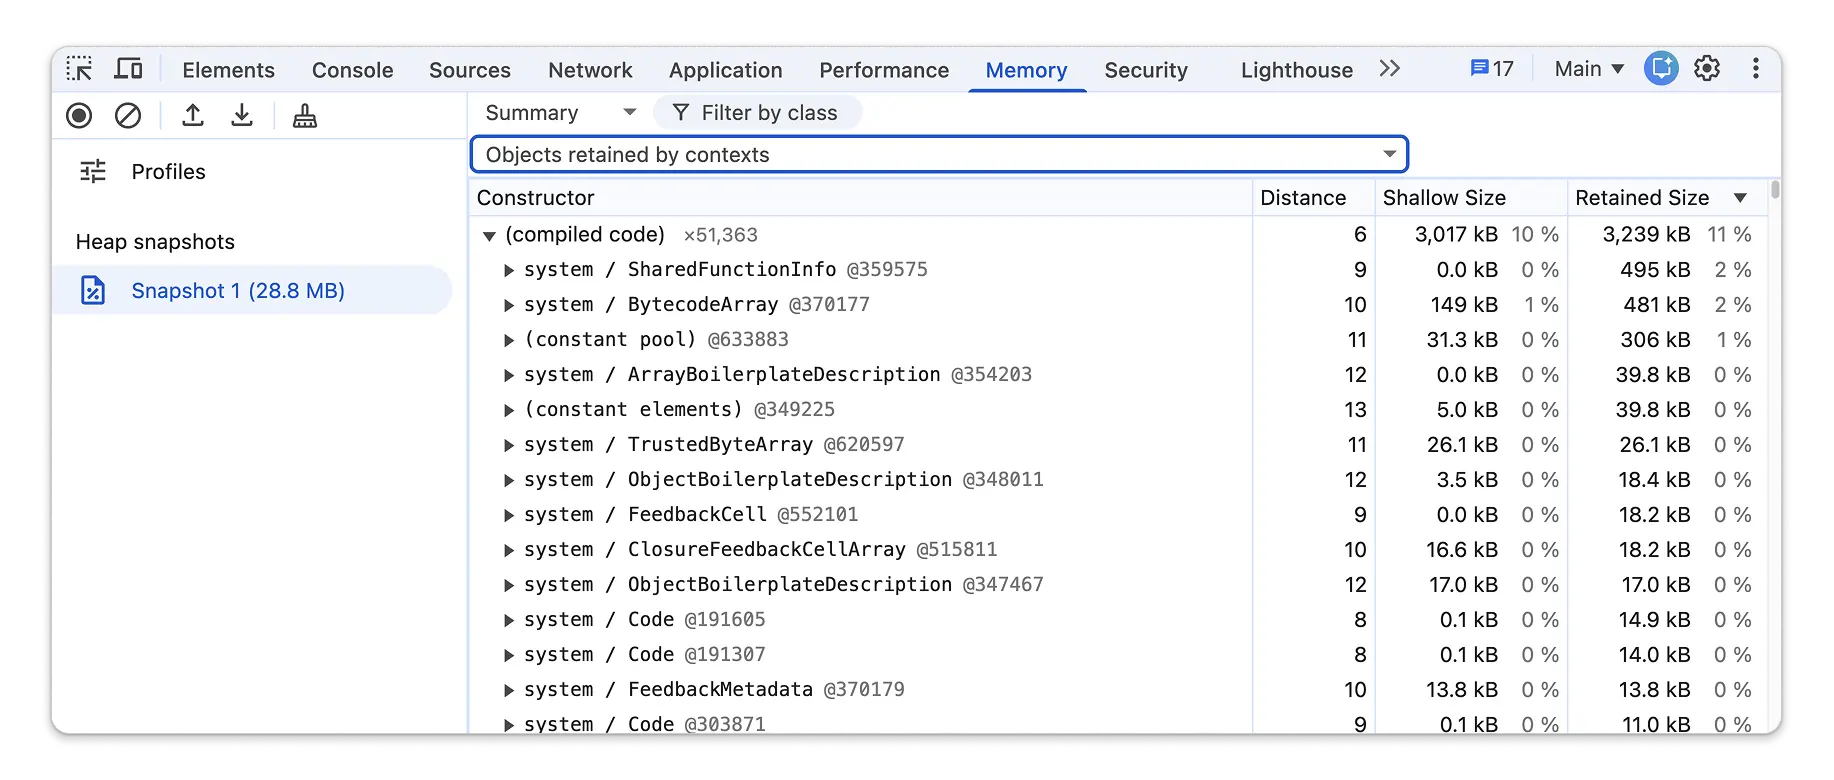
Diagnosing complex JavaScript memory leaks in multi-frame or multi-context web
applications is now significantly clearer in the **Memory** panel:
- **Native V8 context attribution:** Heap snapshots now execute a two-phase attribution algorithm. Static pointer inference resolves `native_context` maps, while graph reachability traces remaining objects. Objects reachable from a single native context are attributed directly to that context, while objects reachable from multiple contexts are categorized into a shared context bucket.
- **"Retained by Context" filter:** A new UI filter in the Heap Snapshot perspective lets you isolate objects retained exclusively through JavaScript closure context objects.
- **Configurable property display order:** A new context menu toggle, **Sort
properties alphabetically** (enabled by default), lets you toggle between alphabetical sorting and original JS property insertion order when inspecting heap object properties.
Chromium issues: [497855658](https://crbug.com/497855658),
[423838364](https://crbug.com/423838364), [40833016](https://crbug.com/40833016)
## Promisified Extension APIs and security hardening
DevTools extension APIs have been updated with modern asynchronous patterns and
tighter security controls:
- **Native Promise support:** Async methods in `chrome.devtools.network` (`getHAR()`, `Request.getContent()`), `chrome.devtools.panels`, and `chrome.devtools.inspectedWindow` (`eval()`, `getResources()`, `Resource.getContent()`, `Resource.setContent()`) now return standard JavaScript `Promise` objects when called without a callback parameter.
- **Extension security boundaries:** DevTools extensions are now restricted from fetching HAR resources of blocked target URLs, must satisfy `extensionsOnChromeUrls` permissions for cross-extension evaluations in `inspectedWindow.eval`, and enforce `allowFileAccess` checks on `file://` resources.
## Other highlights and fixes
A collection of smaller improvements and bug fixes in this release:
- **Performance** : Added **Soft FCP** (First Contentful Paint) timeline markers alongside Soft LCP and Soft Navigation markers, with updated details drawer headers.
- **Performance** : Added guards to skip compute pressure checks during CPU throttling calibration on Android devices without `PressureObserver` support.
- **Network** : Updated **Copy as cURL** to prefix target URLs with `--url` to prevent command-line flag misinterpretation for dash-prefixed URLs.
- **Sources**: Enabled source map scope resolution by default, improving variable scope resolution and symbol un-minification during debugging.
- **Settings** : Updated emulated device presets for newer iPhone and Pixel models with verified safe-area insets, and pre-populates custom device User-Agent fields with `navigator.userAgent`. (Chromium issues: [40718410](https://crbug.com/40718410), [518215252](https://crbug.com/518215252))
- **Settings** : Updated the **Link handling** setting drop-down to display user-friendly extension titles instead of raw extension origin URLs.
- **Lighthouse** : Updated bundled Lighthouse module to version **13.4.0** . (Chromium issue: [40543651](https://crbug.com/40543651))
## Accessibility improvements
Chrome 151 brings the following accessibility enhancements:
- **Elements** : Restored visibility of toggled toolbar icons (such as the script execution **Resume** button) under Windows High Contrast / `@media
(forced-colors: active)` mode by removing conflicting background-color overrides. (Chromium issue: [519762185](https://crbug.com/519762185))
- **Console** : Added accessible full-text `title` tooltips for truncated Live Expression string values in Console Pins.